

Apoplast Metabolomics Profiling Reveals Nitrogen-Dependent Modulation of Plant-Pathogen Interactions
- PMID: 40560929
- PMCID: PMC12190549
- DOI: 10.1111/mpp.70110
Apoplast Metabolomics Profiling Reveals Nitrogen-Dependent Modulation of Plant-Pathogen Interactions
Abstract
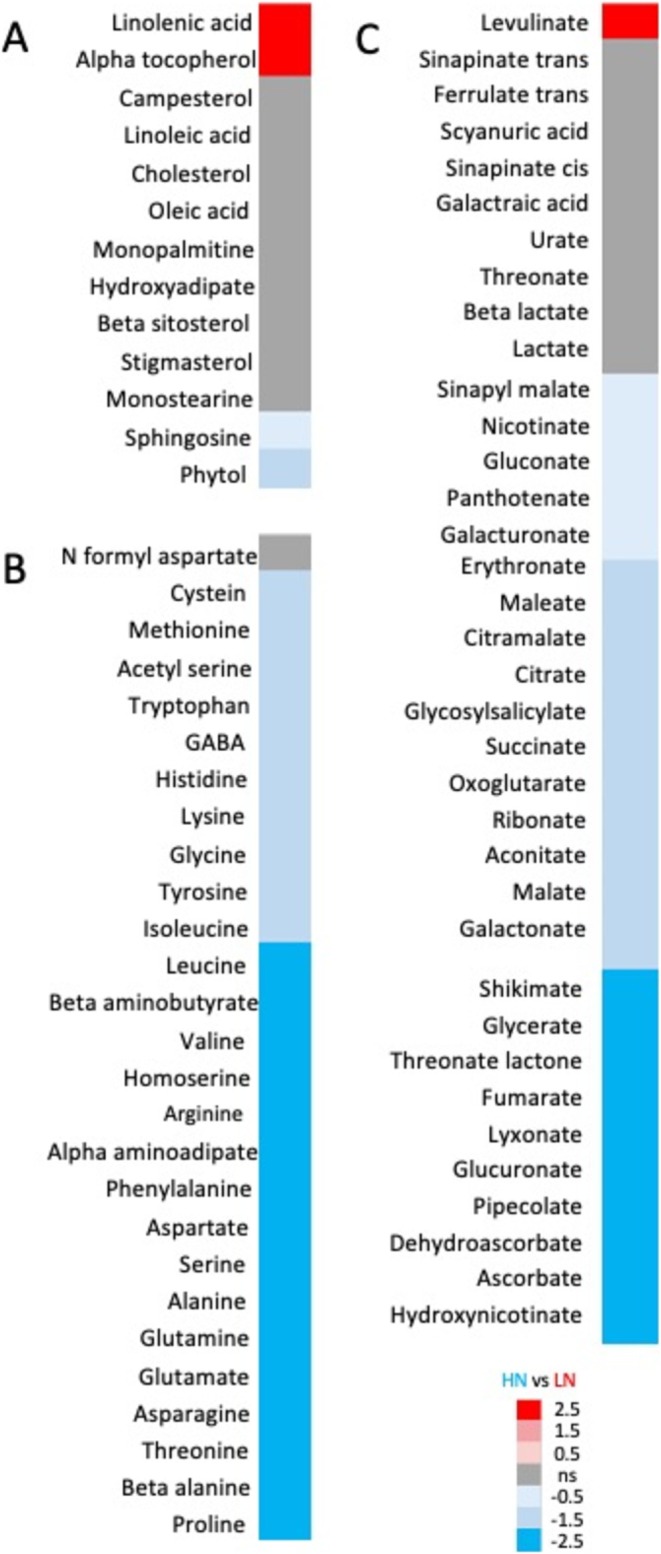
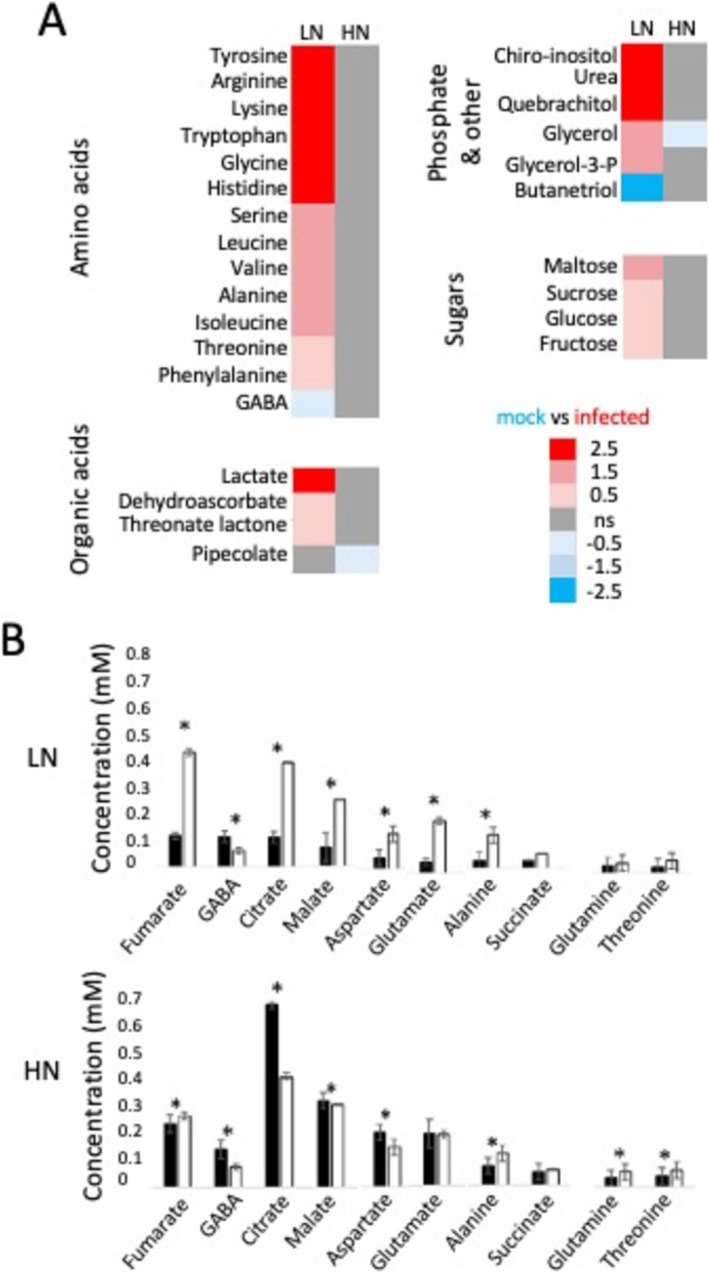
In the present study, we analysed the role played by the apoplast in the crosstalk between biotic and abiotic stress conditions. In particular, we studied the crosstalk between nitrogen (N) limitation and infection of the model plant Arabidopsis thaliana by Erwinia amylovora, an apoplastic bacterium. Our previous findings indicated that low N (LN) conditions increase E. amylovora in planta titres and expression of virulence factors. In this work, we extracted the apoplast wash fluids (AWF) from plants grown under low N or high N (HN) conditions and applied them to bacteria in vitro. We observed that LN-AWF induced stronger virulence gene expression than HN-AWF. Metabolomic analysis of both apoplast extracts revealed the presence of common metabolites; however, their proportions were distinct, indicating a direct effect of N availability on apoplast content. Interestingly, changes in the apoplast metabolite proportions were also observed early after bacterial infection, but only in plants grown under LN conditions. To evaluate the effect of single metabolites on virulence gene expression, we selected 43 metabolites and observed that 29 of them were activators, whereas two, GABA and citrate, acted as repressors. This study shows that environmental constraints, such as N availability, impact plant-pathogen interactions by altering the apoplastic content.
Keywords: Arabidopsis thaliana; Erwinia amylovora; hrp; apoplast; metabolome; multistress; nitrogen limitation; virulence.
© 2025 The Author(s). Molecular Plant Pathology published by British Society for Plant Pathology and John Wiley & Sons Ltd.
Conflict of interest statement
The authors declare no conflicts of interest.
Figures


Similar articles
-
Pathogen-induced root glutamine concentration is a determinant of the outcome of the Medicago truncatula-Aphanomyces euteiches interaction.Planta. 2025 May 26;262(1):8. doi: 10.1007/s00425-025-04728-8. Planta. 2025. PMID: 40419777
-
Systemic pharmacological treatments for chronic plaque psoriasis: a network meta-analysis.Cochrane Database Syst Rev. 2017 Dec 22;12(12):CD011535. doi: 10.1002/14651858.CD011535.pub2. Cochrane Database Syst Rev. 2017. Update in: Cochrane Database Syst Rev. 2020 Jan 9;1:CD011535. doi: 10.1002/14651858.CD011535.pub3. PMID: 29271481 Free PMC article. Updated.
-
Systemic pharmacological treatments for chronic plaque psoriasis: a network meta-analysis.Cochrane Database Syst Rev. 2021 Apr 19;4(4):CD011535. doi: 10.1002/14651858.CD011535.pub4. Cochrane Database Syst Rev. 2021. Update in: Cochrane Database Syst Rev. 2022 May 23;5:CD011535. doi: 10.1002/14651858.CD011535.pub5. PMID: 33871055 Free PMC article. Updated.
-
Signs and symptoms to determine if a patient presenting in primary care or hospital outpatient settings has COVID-19.Cochrane Database Syst Rev. 2022 May 20;5(5):CD013665. doi: 10.1002/14651858.CD013665.pub3. Cochrane Database Syst Rev. 2022. PMID: 35593186 Free PMC article.
-
Sertindole for schizophrenia.Cochrane Database Syst Rev. 2005 Jul 20;2005(3):CD001715. doi: 10.1002/14651858.CD001715.pub2. Cochrane Database Syst Rev. 2005. PMID: 16034864 Free PMC article.
References
-
- Anderson, J. C. , Wan Y., Kim Y.‐M., Pasa‐Tolic L., Metz T. O., and Peck S. C.. 2014. “Decreased Abundance of Type III Secretion System‐Inducing Signals in Arabidopsis mkp1 Enhances Resistance Against <styled-content style="fixed-case"> Pseudomonas syringae </styled-content> .” Proceedings of the National Academy of Sciences of the United States of America 111: 6846–6851. - PMC - PubMed
-
- Asif, M. , Xie X., and Zhao Z.. 2024. “Virulence Regulation in Plant‐Pathogenic Bacteria by Host‐Secreted Signals.” Microbiological Research 288: 127883. - PubMed
-
- Baker, C. J. , Kovalskaya N. Y., Mock N. M., et al. 2012. “An Internal Standard Technique for Improved Quantitative Analysis of Apoplastic Metabolites in Tomato Leaves.” Physiological and Molecular Plant Pathology 78: 31–37.
-
- Barny, M. A. , Guinebretière M. H., Marçais B., Coissac E., Paulin J. P., and Laurent J.. 1990. “Cloning of a Large Gene Cluster Involved in <styled-content style="fixed-case"> Erwinia amylovora </styled-content> CFBP1430 Virulence.” Molecular Microbiology 4: 777–786. - PubMed
-
- Berger, S. , Sinha A. K., and Roitsch T.. 2007. “Plant Physiology Meets Phytopathology: Plant Primary Metabolism and Plant Pathogen Interactions.” Journal of Experimental Botany 58: 4019–4026. - PubMed
MeSH terms
Substances
Grants and funding
LinkOut - more resources
Full Text Sources
