. 2025 Jun 27;11(26):eadw1924.
doi: 10.1126/sciadv.adw1924. Epub 2025 Jun 25.

PET-based immunomapping of intratumoral CD4+ cells to monitor acquired resistance to checkpoint inhibitors

Affiliations

PET-based immunomapping of intratumoral CD4+ cells to monitor acquired resistance to checkpoint inhibitors

Stefania Pezzana et al. Sci Adv. .

Abstract

CD4+ T cells are crucial in shaping response and resistance to immunotherapy. To enhance our understanding of their multifaceted functions, we developed copper-64-radiolabeled nanobodies targeting the human CD4 receptor (64Cu-CD4-Nb1) for positron emission tomography (PET). In human CD4-receptor knock-in mice, 64Cu-CD4-Nb1 specifically accumulated in different orthotopic tumors, correlating with histological CD4+ cell densities. Based on intratumoral CD4+ cell distribution patterns within the core and periphery, we distinguished responders to combined αPD-1/4-1BB antibodies early on-treatment. CD4-PET identified resistance to αPD-1 monotherapy, which was mitigated by adding regulatory T cell-depleting α4-1BB antibodies. Patients with early-stage non-small cell lung cancer who relapsed after neoadjuvant αPD-L1 therapy revealed low CD4+ T cell densities in the tumor core. In human and mouse tumor tissues, regulatory T cells correlated with CD4+ cell densities. Thus, visualizing the spatial distribution patterns of CD4+ cells by PET offers mechanistic insights into CD4-mediated therapy efficacy, with great potential for guiding combinatorial immunotherapies in patients with cancer.


Figures
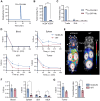
Fig. 1.
Fig. 1.. Specific binding and biodistribution dynamics of 64Cu-CD4-Nb1.
(A) High-performance liquid chromatography chromatogram of 64Cu-CD4-Nb1. Representative data from >3 independent experiments. (B) Immunoreactive fraction of 64Cu-CD4-Nb1 using magnetic beads coated with human CD4 (hCD4+) or left uncoated (hCD4). n = 3 per group, means ± SD, representative data from >3 independent experiments. (C) In vitro binding of 64Cu-CD4-Nb1 and a control Nb (64Cu-GFP-Nb) to freshly isolated hCD4+ T cells, hCD4 DHL cells, or no cells (−). n = 3 per group. (D) 64Cu-CD4-Nb1 PET uptake dynamics 5 to 360 min post-tracer injection (p.i.) in the blood, spleen, draining lymph nodes (dLNs), and tumors (n = 3 per group, means ± SD). The data are presented as the mean percent of the injected dose per ml (%ID/ml). (E) Representative maximum intensity projection PET images overlaid with anatomical MR images acquired 180 min after 64Cu-CD4-Nb1 injection in human CD4 knock-in (hCD4-KI) or WT mice with orthotopic PyMT triple-negative breast cancer tumors. The tumors are outlined with white circles, and the lymph nodes are highlighted by white arrows; k: kidney; b: bladder. (F) 64Cu-CD4-Nb1 PET uptake quantification 180 min after tracer injection in the blood, spleen, dLNs, and nondraining lymph nodes (ndLNs). (G) 64Cu-CD4-Nb1 PET uptake quantification 180 min after tracer injection in PyMT tumors and the tumor-to-blood ratio. Pairwise comparisons were performed with Student’s t test and corrected for multiple comparisons using the Holm-Sidak method (*P < 0.05; ***P < 0.001).
Fig. 2.
Fig. 2.. 64Cu-hCD4-Nb1 PET to quantify varying intratumoral CD4+ cell densities.
(A) Representative MR, PET, and coregistered PET/MR images 180 min after 64Cu-hCD4-Nb1 injection of PyMT and B16F10 tumors, which were implanted in WT (no hCD4 antigen) or hCD4-KI mice. Two groups were treated with αPD-1/α4-1BB antibodies for 1 week to increase CD4+ T cell infiltration. (B) Quantification of in vivo and (C) ex vivo 64Cu-CD4-Nb1 uptake at 180 min post-tracer injection and (D) mean hCD4+ cell/HPF ratio in the tumor center analyzed by IHC. Red horizontal lines represent background levels compared with those in the WT group. Pooled data from two independent experiments. n = 5 to 7 (two to four per experiment) per group, means ± SEM. (E) Representative hCD4 immunohistochemical images of the tumor core and periphery of PyMT and B16F10 tumors from hCD4-KI mice. Scale bar, 50 μm. Pairwise comparisons were performed with one-way ANOVA and corrected for multiple comparisons using the Holm-Sidak method (*P < 0.05; ***P < 0.001).
Fig. 3.
Fig. 3.. Noninvasive visualization of lymphatic organs in mice treated with or without αPD-1/α4-1BB immunotherapy.
(A) In vivo and (B) ex vivo quantification of the spleen, dLNs, and contralateral ndLNs of PyMT and B16F10 tumor-bearing hCD4-KI and WT mice acquired, with or without αPD-1/α4-1BB treatment, 180 min after 64Cu-CD4-Nb1 injection. Pooled data from two independent experiments. n = 5 to 7 (two to four per experiment) per group, means ± SEM. Pairwise comparisons were performed with ordinary one-way ANOVA and corrected for multiple comparisons using the Holm-Sidak method (*P < 0.05; **P < 0.01; ***P < 0.001). (C) Representative MR and coregistered PET/MR images acquired 180 min post-tracer injection, with a focus on the lymphatic organs. Spleens are highlighted by white lines, dLNs are highlighted by red arrows, and ndLNs are highlighted by white arrows. (D) Immunofluorescence (IF) microscopy of the spleens of each group. Scale bar, 10 μm.
Fig. 4.
Fig. 4.. Spatial distribution of intratumoral CD4+ T cells determines the response to immunotherapy.
(A) Tumor growth of PyMT hCD4-KI mice treated with αPD-1/α4-1BB antibodies (day 0 and day 3). Combined data from αPD-1/α4-1BB–treated animals of Fig. 2 (n = 5) and a second treatment cohort (n = 8). Seven mice were classified as responders (tumor volume d7/d0 < 1, blue), and six mice were classified as nonresponders (tumor volume d7/d0 > 1, red). (B) 64Cu-CD4-Nb1 PET uptake 7 days after αPD-1/α4-1BB therapy initiation in responders and nonresponders. (C) Representative MR (axial slice) and PET images (axial slice, tumor only) acquired 180 min after 64Cu-CD4-Nb1 injection. Tumors were classified as T cell–“enriched,” T cell–“excluded,” or T cell–“deserted” on the basis of the spatial distribution of 64Cu-CD4-Nb1 PET uptake. The tumor core and tumor margin uptake values were differentiated by a centered 50% reduced ROI (white circles). (D) The intratumoral CD4+ T cell distribution was quantified by the ratio of the tumor core and tumor margin 64Cu-CD4-Nb1 PET uptake. (E) Ex vivo quantification of CD4+ cells in the tumor core and the tumor margin by immunofluorescence. (F) Tumor core-to-margin ratios of CD4+ T cells. (G) Representative immunofluorescence images and fractions of CD4+FoxP3+ Treg cells within the tumor core and tumor margin (gray: DAPI; blue: FoxP3; red: CD4). Scale bar, 10 μm. (H) Tumor core-to-margin ratios of CD4+FoxP3+ Treg cells. Pairwise comparisons were performed with Student’s t test and corrected for multiple comparisons using the Holm-Sidak method (*P < 0.05; **P < 0.01; ***P < 0.001).
Fig. 5.
Fig. 5.. PET-guided therapy adaptation in MC38 tumor-bearing animals.
(A) Tumor growth of αPD-1–treated mice and the related response rate (RR). MC38 tumor cells were subcutaneously (sc) implanted into C57BL/6 hCD4-KI mice 10 days before the initiation of αPD-1 mAb therapy. Antibodies were applied every 3 days for a total of seven injections. n = 11, data from one experiment. (B) Schematic illustration of the treatment adaptation based on the 64Cu-CD4-Nb1 PET uptake 5 days post–αPD-1 therapy initiation. Additional α4-1BB mAbs were applied starting on day 6. (C) 64Cu-CD4-Nb1 PET uptake, PET image of the tumor, calculated tumor core-to-margin ratio, and therapy response per individual mouse. Animals with an increased tumor core-to-margin ratio (>1.3) continued αPD-1 therapy (orange). αPD-1 therapy was combined with α4-1BB mAbs when the core-to-margin ratio was less than <1.3 (blue). n = 21, combined data from two independent experiments (n = 8 to 13 per experiment). (D) Tumor growth and related response rates of αPD-1–treated mice. (E) Tumor growth and related response rates of αPD-1 and subsequently added α4-1BB treatment group. (F) 64Cu-CD4-Nb1 PET core-to-margin ratio and representative PET images 5 and 12 days post-therapy initiation of mice administered either with αPD-1 monotherapy or the sequential combination of αPD-1/α4-1BB therapy. n = 13, data from one experiment. Pairwise comparisons were performed with Student’s t test and corrected for multiple comparisons using the Holm-Sidak method (*P < 0.05).
Fig. 6.
Fig. 6.. Ex vivo multiplex immunofluorescence of whole tumor samples from patients with NSCLC treated with neoadjuvant PD-L1 ICI.
(A) Schematic illustration of the clinical study. (B) Quantification of CD3+CD8 T cell densities (considered as CD4+ T cells) within the tumor core (left) and tumor margin (right) from pretreatment and on-treatment tissue. n = 35, combined data from two independent clinical studies. (C) Multiplex immunofluorescence microscopy images of the indicated seven-marker antibody panel. Tumor biopsy samples before treatment (upper left image) and corresponding posttreatment whole tumor samples from three representative cases are displayed. Scale bars, 100 μm. (D) Classification of T cell–enriched, T cell–deserted, and T cell–excluded tumors on-treatment on the basis of the CD4 core and margin quantification. Red arrows indicate that patients relapsed within 1 year after surgery (n = 6). Gray arrows indicate that patients relapsed after more than 2 years after surgery (n = 5). (E) Correlation between the time to relapse after surgery and the number of CD4+ cells within the core of the resected tumors. (F) Tumor core and margin densities of CD4+ cells (left) and FoxP3+ Treg fraction of CD4+ cells (right) of patients relapsed within 1 year and >2 years after surgery. (G) Correlation of time to relapse after surgery and pathological response based on the fraction of vital cells. Pairwise comparisons were performed with Student’s t test and corrected for multiple comparisons using the Holm-Sidak method (*P < 0.05).

References

    1. Duhen R., Fesneau O., Samson K. A., Frye A. K., Beymer M., Rajamanickam V., Ross D., Tran E., Bernard B., Weinberg A. D., Duhen T., PD-1 and ICOS coexpression identifies tumor-reactive CD4+ T cells in human solid tumors. J. Clin. Invest. 132, e156821 (2022). - PMC - PubMed
    1. Tay R. E., Richardson E. K., Toh H. C., Revisiting the role of CD4+ T cells in cancer immunotherapy-new insights into old paradigms. Cancer Gene Ther. 28, 5–17 (2021). - PMC - PubMed
    1. Speiser D. E., Chijioke O., Schaeuble K., Münz C., CD4+ T cells in cancer. Nat. Cancer 4, 317–329 (2023). - PubMed
    1. Oh D. Y., Fong L., Cytotoxic CD4+ T cells in cancer: Expanding the immune effector toolbox. Immunity 54, 2701–2711 (2021). - PMC - PubMed
    1. Yang X., Wu J., Fan L., Chen B., Zhang S., Zheng W., Single-cell analysis identifies distinct populations of cytotoxic CD4+ T cells linked to the therapeutic efficacy of immune checkpoint inhibitors in metastatic renal cell carcinoma. J. Inflamm. Res 17, 4505–4523 (2024). - PMC - PubMed

MeSH terms

LinkOut - more resources