. 2025 Jun 27;11(26):eadu3919.
doi: 10.1126/sciadv.adu3919. Epub 2025 Jun 25.

Lysosomal zinc nanomodulation blocks macrophage pyroptosis for counteracting atherosclerosis progression

Affiliations

Lysosomal zinc nanomodulation blocks macrophage pyroptosis for counteracting atherosclerosis progression

Ruizhi Hu et al. Sci Adv. .

Abstract

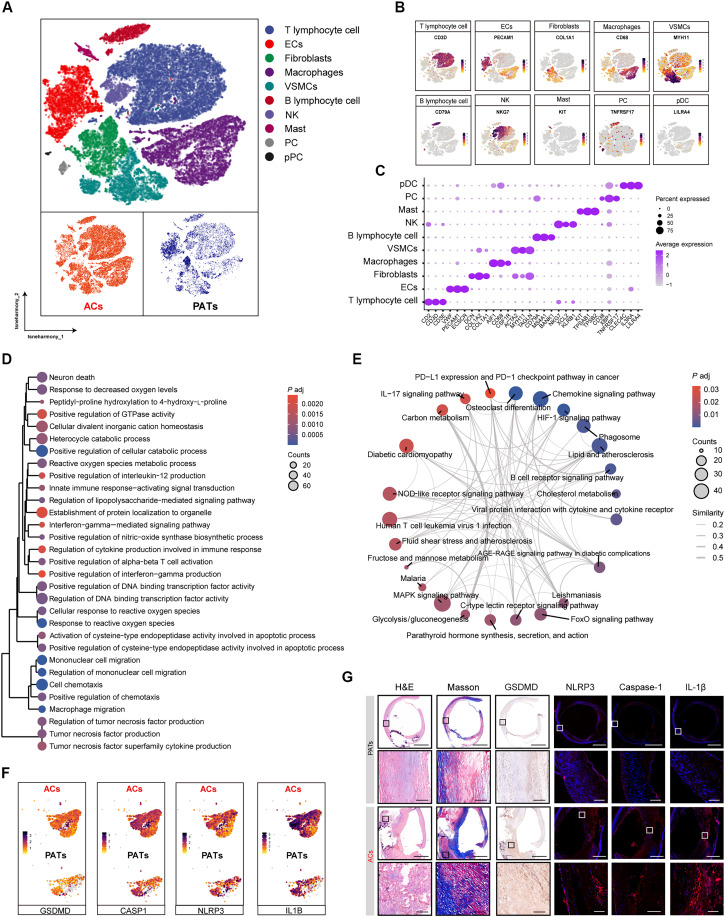
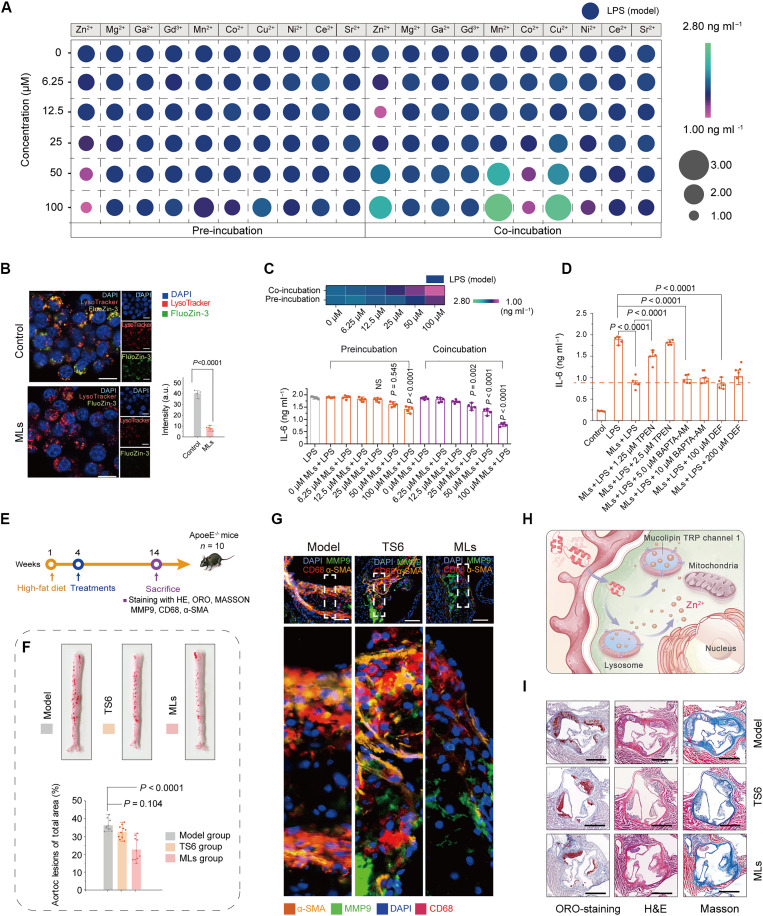
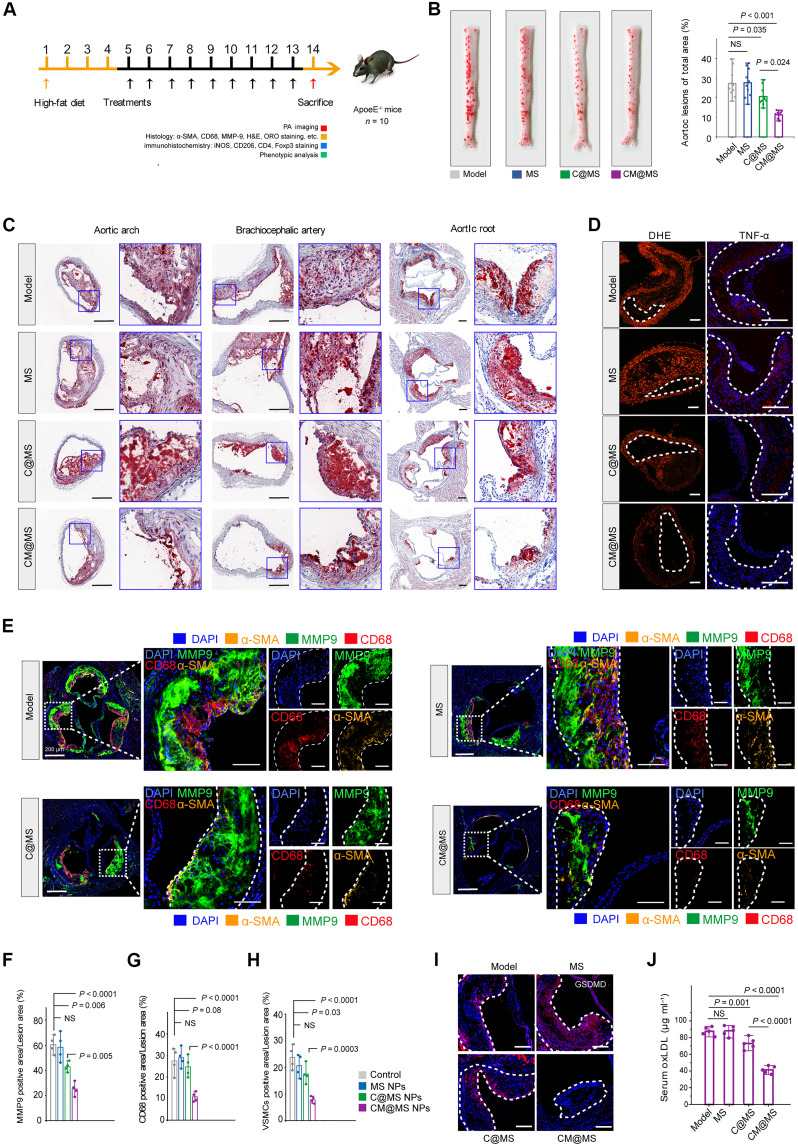
Macrophage pyroptosis has been identified as a critical pathological mechanism in inflammation-related atherosclerosis (AS). In this work, we have demonstrated that Zn2+ features the strongest anti-inflammatory performance by screening 10 representative metal ions, and the MTC1 agonists can trigger lysosomal Zn2+ release and inhibit pyroptosis in macrophages. Based on these findings, we further engineered a mucolipin TRP channel 1 (MTC1)-related therapeutic nanoplatform for endogenously triggering lysosomal zinc release to curb inflammation and block macrophage pyroptosis. This nanoplatform consists of mesoporous silica nanoparticles to deliver MTC1 agonists and carbon nanodots, which could synergistically exert antiatherosclerotic effect by scavenging toxic reactive oxygen species, inhibiting macrophage pyroptosis, modulating macrophage transition, and rebuilding atherosclerotic immune microenvironment. These findings demonstrate that macrophage pyroptosis can be efficiently blocked via leveraging self-lysosomal zinc pool, which provides the paradigm of lysosomal zinc modulation-involved nanotherapeutics for managing other inflammatory diseases.


Figures

Fig. 1.
Fig. 1.. Schematic illustration of synthetic procedure of CM@MS NPs and anti-atherogenic therapy as enabled by CM@MS NPs.
(A) Scheme of synthetic process of CM@MS NPs, including synthesis of MSNs, APTES surface modification, ICG engineering (MS NPs), and C ND and ML coloading (CM@MS NPs). (B) Schematic illustration of the therapeutic procedure of CM@MS NPs for AS management, including ROS elimination by C NDs component and anti-inflammatory property through ML-driven intracellular redistribution of zinc ions.
Fig. 2.
Fig. 2.. Pyroptosis is involved in human AS.
(A) A t-SNE visualization that identified 10 major cell types exhibited in atherosclerotic lesions from patients undergoing carotid endarterectomy. (B) Feature plots exhibiting the expression profiles of cell type–specific marker genes. (C) Dot plot exhibiting the expression level of key marker genes across the cell types. (D) GO biological process analysis and (E) KEGG pathway enrichment of DEMs in macrophages within atherosclerotic plaques. (F) Dotted lines represented P-adjusted value 0.5 and < −0.5 corresponding to PATs and ACs cells, respectively. t-SNE visualization of the pyroptosis associated differential genes in ACs versus PATs macrophages. (G) Histological analysis of HE, Masson, GSDMD, and immunofluorescence assay of NLRP3, caspase-1, and IL-1β from PATs and ACs in human plaque lesions (n = 3).
Fig. 3.
Fig. 3.. MLs trigger Zn2+ release from lysosome and corresponding therapeutic effect of MLs.
(A) Levels of IL-6 in J774A.1 cells after co-incubated or pre-incubated with various concentrations of metal ions. (B) Fluorescence images of J774A.1 cells stained with FluoZin-3 (–AM) and LysoTracker after different treatments, and corresponding statistical analysis of FluoZin-3 intensities after different treatments. Scale bars, 20 μm. (C) Levels of IL-6 in J774A.1 cells after co-incubated or pre-incubated with MLs. (D) Levels of IL-6 in J774A.1 cells after co-incubated with different formulations. (E) Schematic illustration of the in vivo therapeutic protocols. (F) Representative photographs of ORO-stained aortas of mice following treatment with varied formulations and corresponding statistical analysis after different treatments. (G) Representative immunofluorescent images of aorta sections stained with antibody against CD68, MMP9, and α-SMA. Scale bars, 100 μm. (H) Schematic illustration of the cellular Zn2+ release from lysosomes triggered by MLs. (I) Representative photographs of ORO-stained, and H&E/Masson immunohistochemical images of aortas root sections following treatment with varied formulations. Scale bars, 500 μm. Statistical analysis from [(C), (D), and (F)] was performed by one-way analysis of variance (ANOVA), and statistical analysis from (B) was calculated via the Student’s t test. The data are presented as mean ± standard deviation (SD). DAPI, 4′,6-diamidino-2-phenylindole.
Fig. 4.
Fig. 4.. Single-cell resolution analysis of gene expression from atherosclerotic plaques of ApoE−/− mice after treatment of MLs.
(A) t-SNE visualization that categorized seven main cell types presented in atherosclerotic plaques from ApoE−/− mice. (B) Key marker genes defining each type of cell cluster in (A) are presented. (C) Heatmap showing cluster-specific genes at plaque regions. (D) Network visualizing the comprehensive inflammatory-related GO terms and pathways across seven cell types. (E) GO analysis of DEMs exhibiting the biological process, cellular component, and molecular function from annotated macrophages. (F) Dotted lines presenting classical pyroptosis-related marker genes for the annotated macrophages. (G) Pseudotime-ordered analysis of CD8+ T cells identified two distinct cell fates from ML-treated group as compared with model group. (H) Bar plot exhibiting the proportions of each subcluster. (I) Two-dimensional plots exhibiting the expression of selected genes along the pseudo-time from model group and ML-treated group. (J) Heatmap displaying the dynamic variation in gene expression along the pseudotime.
Fig. 5.
Fig. 5.. Characterizations and cellular internalization of CM@MS NPs.
(A) TEM images of CM@MS NPs at different magnifications and schematic illustration of modification process of ICG-engineered CM@MS NPs. Scale bars, (A1) 100 nm, (A2) 50 nm, and (A3) 2 nm. (B) UV-vis–NIR spectra of MSNs, MLs, ICG, C nanodots, and CM@MS NPs. (C) XPS spectrum of CM@MS NPs and (D) corresponding XPS spectrum of C1s region in CM@MS NPs. (E) In vitro concentration-dependent PA signals of CM@MS NPs under 808-nm laser irradiation. (F) Uptake of CM@MS NPs by J774A.1 cells and (G) quantification of uptake based on fluorescence intensity within 8 hours. (H) Colocalized images of CM@MS NPs in J774A.1 cells incubated for different time points. Scale bars, 20 μm. (I) Fluorescence images of J774A.1 cells stained with FluoZin-3 (–AM) and LysoTracker after different treatments and corresponding statistical analysis of FluoZin-3 intensity after different treatments. Scale bars, 20 μm. (J) Schematic illustration of lysosome escape of CM@MS NPs. Statistical analysis was performed by one-way ANOVA. The data are presented as means ± SDs. a.u., arbitrary unit.
Fig. 6.
Fig. 6.. Evaluation of ROS-scavenging property and anti-inflammatory effect by CM@MS NPs at cellular level.
(A) Confocal microscopy images of total ROS, O2 , and •OH in J774A.1 cells after different treatments. Scale bars, 20 μm. (B) Confocal microscopy images on the changes of mitochondrial membrane potential in J774A.1 cells after different treatments. Scale bars, 20 μm. Levels of (C) IL-6, (D) TNF-α, and (E) IL-1α in LPS-treated J774A.1 cells after varied treatments. (F) Schematic illustration of therapeutic process of CM@MS NPs in cells. (G) Immunofluorescence of IL-6, TNF-α and IL-1α and (H) corresponding fluorescence intensities in LPS-induced J774A.1 cells after different treatments. Scale bars, 50 μm. (I) Confocal fluorescence images showed cellular internalization of Dil-labeled oxidized LDL in J774A.1 cells. For fluorescence observation, nuclei were labeled with DAPI (blue), and the cell membrane was stained with Dil (magenta). (J) Observation of ORO in foam cells derived from J774A.1 cells. Scale bars, 20 μm. (K) Representative flow cytometry plots of M1 subtypes of macrophages percentage after varied treatments. Statistical analysis was performed by one-way ANOVA. The data are presented as means ± SD.
Fig. 7.
Fig. 7.. Evaluation on cell pyroptosis inhibition by CM@MS NPs at cellular level.
(A) SYTOX Green staining of LPS plus nigericin-induced J774A.1 cells after varied treatment. Scale bars, 20 μm. (B) Morphological features of J774A.1 cell membrane observed by CLSM after varied treatments. The cell membrane was stained with PlasMem Bright Red. Scale bars, 20 μm. (C) Circle diagram of enriched biological process terms from GO analysis after treatment with CM@MS NPs. (D) Circle diagram of KEGG enrichment analysis of inflammatory/pyroptosis-involved DEMs. (E) Rank-order plot for RNA-seq of DEMs from J774A.1 cells treated with LPS plus nigericin and LPS plus nigericin plus CM@MS NPs. (F) Friends analysis to identify key pyroptosis-associated DEMs. (G) Quantitative analysis of varied gene expression levels after treatment with CM@MS NPs as determined by PCR. (H) Western blot results of protein expression (including caspase-1, GSDMD, and GSDMD-N) and corresponding quantitative analysis of varied gene expression levels after different treatments. (I) Immunofluorescence images of GSDMD and caspase-1 in LPS plus nigericin-induced J774A.1 cells after different treatments. Scale bars, 20 μm. (J) Pyroptosis of LPS plus nigericin-induced J774A.1 cells after varied treatments. The cells were stained with fluorescein-labeled fluorochrome inhibitor of caspases (FAM-FLICA) caspase-1 assay kit and analyzed by flow cytometry analysis. Statistical analysis was performed by one-way ANOVA.
Fig. 8.
Fig. 8.. Therapeutic effects of CM@MS NPs in ApoE−/− mice.
(A) Schematic illustration of the in vivo therapeutic protocols treated by CM@MS NPs. (B) Representative photographs and quantitative analysis of ORO-stained aortas of mice following treatment with varied formulations. (C) Representative ORO-stained cryosections. Scale bars, 400 μm. (D) Fluorescence images stained with DHE and antibody against TNF-α from ApoE−/− mice after varied treatments. Scale bars, 200 μm. (E) Fluorescence images and (F to H) quantitative analysis of aortic root sections stained with MMP-9, antibody to CD68, and antibody to α-SMA from ApoE−/− mice after varied treatments. Scale bars, 400 μm. (I) Fluorescence images stained with antibody against GSDMD from ApoE−/− mice after varied treatments. Scale bars, 200 μm. (J) Serum levels of ox-LDL. Statistical analysis was performed by one-way ANOVA. NS, not significant.
Fig. 9.
Fig. 9.. Immune regulation at plaque lesions by CM@MS NPs in ApoE−/− mice.
(A to F) Representative flow cytometry plots showing CD3+ T cell, CD4+ T cell, CD8+ T cell, and Treg cell ratios in aortas and spleen extracted from mice after different treatments. (G to N) Quantitative analysis of the number of CD3+ T cell and the CD4+ T cell, CD8+ T cell, and Treg cell ratios in aortas and spleen after varied treatments. (O) Immunofluorescence assay showing iNOS (red) and CD206 (green) and (P and Q) Quantitative analysis in the aortic root sections from mice after different treatments. Scale bars, 100 μm. (R) Immunofluorescence assay showing CD4 (red) and Foxp3 (green) and (S and T) quantitative analysis in the aortic root sections from mice after varied treatments. Scale bars, 100 μm. (U) Schematic illustration of CM@MS NPs potentially immunoregulation of mechanism at plaque lesions.

Similar articles

Cited by

References

    1. Libby P., The changing landscape of atherosclerosis. Nature 592, 524–533 (2021). - PubMed
    1. Björkegren J. L. M., Lusis A. J., Atherosclerosis: Recent developments. Cell 185, 1630–1645 (2022). - PMC - PubMed
    1. Koelwyn G. J., Corr E. M., Erbay E., Moore K. J., Regulation of macrophage immunometabolism in atherosclerosis. Nat. Immunol. 19, 526–537 (2018). - PMC - PubMed
    1. Tabas I., Bornfeldt K. E., Macrophage phenotype and function in different stages of atherosclerosis. Circ. Res. 118, 653–667 (2016). - PMC - PubMed
    1. Martinet W., Schrijvers D. M., De Meyer G. R. Y., Necrotic cell death in atherosclerosis. Basic Res. Cardiol. 106, 749–760 (2011). - PubMed

MeSH terms