. 2025 Jun 27;11(26):eads6132.
doi: 10.1126/sciadv.ads6132. Epub 2025 Jun 25.

External strain on the plasma membrane is relayed to the endoplasmic reticulum by membrane contact sites and alters cellular energetics

Affiliations

External strain on the plasma membrane is relayed to the endoplasmic reticulum by membrane contact sites and alters cellular energetics

Ziming Chen et al. Sci Adv. .

Abstract

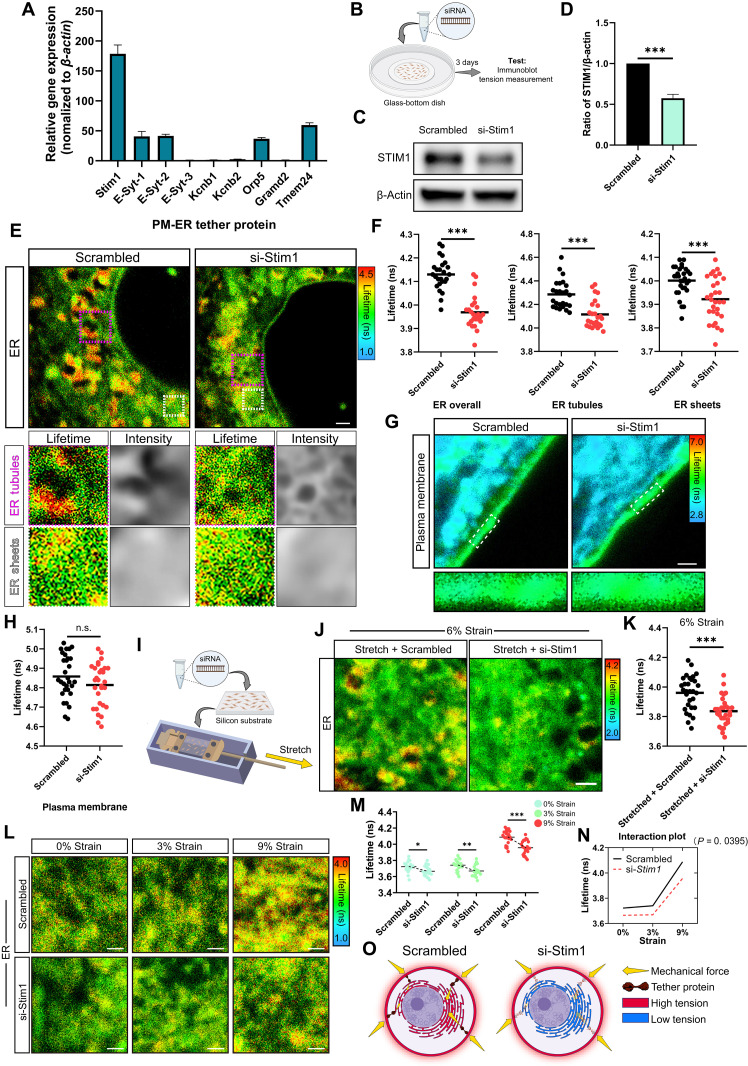
Mechanotransduction is essential for living cells to adapt to their extracellular environment. However, it is unclear how the biophysical adaptation of intracellular organelles responds to mechanical stress or how these adaptive changes affect cellular homeostasis. Here, using the tendon cell as a mechanosensitive cell type within a bioreactor, we show that the tension of the plasma membrane (PM) and the endoplasmic reticulum (ER) adaptively increases in response to repetitive external stimuli. Depletion of stromal interaction molecule 1 (STIM1), the highest expressed PM-ER tether protein, interfered with mechanotransduction from the PM to the ER, and affected the ER tension. We found that an optimized mechanical strain increased ER tension in a homeostatic manner, but excessive strain resulted in ER expansion, as well as activating ER stress. Last, we showed that changes in ER tension were linked with ER-mitochondria interactions and associated with cellular energetics and function. Together, these findings identify a PM-ER mechanotransduction mechanism that dose-dependently regulates cellular metabolism.


Figures

Fig. 1.
Fig. 1.. Cyclic mechanical strain increases tension of the PM and the ER.
(A) Schematic diagram illustrating the experimental approach used to mechanically stimulate monolayers of mouse tendon cells. (B) Representative FLIM images of PM tension probed by Flipper-TR in tendon cells with or without cyclic mechanical stimulation. Each bottom panel is an enlargement of the dashed boxed area in the corresponding top panel. (C) Distribution of fluorescence lifetime of Flipper-TR after selecting the PM as the region of interest (ROI) between the static group and the stretched group (n = 25 cells per group, each with at least two ROIs, from three independent experiments). (D) Representative FLIM images of overall ER (top) stained with ER Flipper-TR in tendon cells with or without cyclic mechanical stimulation and their enlargements showing ER tubules (middle), as indicated by the red arrows in the top images, and areas of ER sheets (bottom), as indicated by purple dashed rectangles in the top images. (E) Distribution of fluorescence lifetime of ER Flipper-TR selecting the overall ER, ER tubules, or ER sheets, as the ROI between the static group and the stretched group (n = 24 cells per group, each with at least two ROIs, from three independent experiments). (F) Representative FLIM images of mitochondria stained with Mito Flipper-TR (top) and lysosome stained with Lyso Flipper-TR (bottom), in tendon cells with or without cyclic mechanical strain. Each top right panel is an enlargement of the red dashed boxed area in the yellow dashed boxed bottom left panel. (G) Distribution of fluorescence lifetime of Mito Flipper-TR and Lyso Flipper-TR between static group and stretched group (n = 30 cells per group, each with at least three ROIs, from three independent experiments). Line marks the mean of the distribution. Scale bars, 1 μm. **P < 0.01; ***P < 0.001; n.s., not significant by Student’s t test.
Fig. 2.
Fig. 2.. Comparison of ER loading profiles from 3D cell constructs between underloaded, normal loaded, and overloaded conditions.
(A) Representative confocal and FLIM images of ER Flipper-TR in 3D tendon constructs showing the intensity and corresponding fluorescence lifetime. Scale bars, 10 μm. Bottom panels show the enlargement of the cell in tendon construct as the ROI. (B) Representative fluorescence lifetime histograms of ER Flipper-TR with Gaussian fits in 3D tendon constructs receiving 0, 3, 6, or 9% cyclic strain. (C) Quantification of fluorescence lifetime of ER Flipper-TR in 3D tendon constructs receiving 0, 3, 6, or 9% cyclic strain (n = 15 cells per group from three independent experiments). (D) Hypothetical model of tension-driven ER morphological changes. Tensile stress can expand the area of membranes and flatten the membrane at force. (E) Representative confocal images of GFP-labeled ER and Hoechst-labeled nuclei in tendon cells receiving 3D mechanical stretching with the indicated loading regimes. (F) ER morphology was analyzed by drawing 56-pixel-wide line segments from the nuclear envelope, selecting ER sheets (orange) and tubules (atrovirens) using Renyi entropy threshold, and calculating sheet percentage per segment. (G and H) Quantification of the percentage of ER sheets (G) and overall ER area (H) in different mechanical loading environments using method (F) (n = 15 cells per group from three independent experiments, three regions per cell). (I and J) RT-PCR analysis (I) and its quantification (J) of XBP1 splicing with different mechanical loading regimes (three biological replicates from three independent experiments). The size of unspliced XBP1 (uXBP1) is 205 base pairs (bp), whereas spliced XBP1 (sXBP1) is 179 bp. Total XBP1 (tXBP1) was defined as uXBP1 + sXBP1. Scale bars, 5 μm. *P < 0.05; **P < 0.01; ***P < 0.001; n.s., not significant by one-way ANOVA. Error bars stand for SEM.
Fig. 3.
Fig. 3.. Partial knockdown of the PM-ER tether protein STIM1 reduces ER tension.
(A) RT-qPCR analysis of PM-ER tether proteins in mouse tendon cells (three biological replicates from three independent experiments). (B) Schematic diagram illustrating the experimental approach used to test membrane tension of tendon cells transfected with scrambled siRNA or Stim1-siRNA. (C and D) Immunoblot analysis (C) and quantification (D) of STIM1 expression in cells 3 days post-siRNA transfection (three biological replicates from three independent experiments). (E and F) Representative FLIM images (E) of ER Flipper-TR in cells transfected with siRNA (top). Bottom panels show enlarged views of ER tubules (purple dashed rectangles) and ER sheets (white dashed rectangles) from the top panels, alongside confocal images displaying intensity, and quantification (F) selecting the overall ER, ER tubules, or ER sheets (n = 25 to 30), as the ROI. (G and H) Representative FLIM images (G) of Flipper-TR in cells transfected with siRNA and quantification (H) selecting the PM as the ROI (n = 30). (I) Schematic illustrating 2D mechanical stimulation to tendon cells transfected with siRNA. (J and K) Representative FLIM images of ER Flipper-TR in cells transfected with siRNA after 2D 6% cyclic strain (J) and quantification (K) (n = 30). (L and M) Representative FLIM images of ER Flipper-TR in tendon cells transfected with siRNA after 2D 0, 3, or 9% cyclic strain (L) and quantification (M) (n = 21 to 24). (N) Interaction plot from two-way ANOVA indicating the interactive effect of partial Stim1 knockdown and cyclic strain on ER tension. (O) Schematic illustrating that detethering the ER from the PM disrupts mechanical force propagation, reducing adaptive ER tension. Scale bars, 1 μm. n, cells per group, each with at least two ROIs, from three independent experiments. *P < 0.05; **P < 0.01; ***P < 0.001; n.s., not significant by Student’s t test (D, F, H, and K) or two-way ANOVA with Sidak’s post hoc (M and N). Error bars stand for SEM. (B), (I), and (O) created with BioRender.com.
Fig. 4.
Fig. 4.. Regulating the PM-ER tethered mechanotransmission system can manipulate the ER tension without interfering the actin cytoskeleton.
(A) Representative confocal images and analysis of CFSE-labeled cells (green), phalloidin-labeled F-actin (red), and merged images with Hoechst-labeled nuclei (blue) in tendon cells transfected with either scrambled siRNA or Stim1-siRNA or treated with cytochalasin D. For image analysis, the cell contour (yellow) is indicated by CFSE, and the F-actin orientation is color coded (rightmost images). More highly magnified images in the phalloidin-stained cells (middle) and the color-coded F-actin orientation indicated that cells (rightmost) are of the white dashed boxed areas. Scale bars, 10 μm. (B) Fluorescence intensity quantification by analyzing phalloidin fluorescence intensity divided by cell area (n = 15 cells per group from three independent experiments). (C) Dispersion quantification of F-actin by analyzing F-actin orientation (n = 15 cells per group from three independent experiments). (D) Representative FLIM images of PM tension probe Flipper-TR–stained tendon cells treated with carrier [dimethyl sulfoxide (DMSO)] or with cytochalasin D. Scale bar, 1 μm. (E) Distribution of the fluorescence lifetime of Flipper-TR selecting the PM as the ROI in tendon cell treated with or without cytochalasin D (n = 25 cells per group, each with at least two ROIs, from three independent experiments). **P < 0.01; ***P < 0.001; n.s., not significant by Student’s t test (B and C) or by one-way ANOVA (E). Error bars stand for SEM.
Fig. 5.
Fig. 5.. STIM1 mediates ER tension via the physical PM-ER tethering rather than SOCE.
(A) Representative time course of cytosolic Ca2+ measurements in Fluo-4 NW–loaded tendon cells transfected with scrambled siRNA or Stim1-siRNA and further treated with DMSO (carrier) or Synta66 for 6 days. (B) Normalized maximal values of SOCE from tendon cells transfected with siRNA and further treated with DMSO or Synta66 for 6 days (five biological replicates, three independent experiments). (C) Cartoon showing the PM-ER contact sites measured by SPLICSLER-PM that can detect interactions occurring between the PM and the ER within a reciprocal distance of around 40 nm. (D) Representative 3D-rendered confocal image of tendon cells expressing SPLICSLER-PM. SPLICSLER-PM spots were rendered by detecting SPLICSLER-PM signals. Rendered intracellular view (bottom) is an enlargement of the red dashed boxed area in the top panel, showing SPLICSLER-PM spot-labeled PM-ER contact sites. (E and F) Representative 3D-rendered confocal images of tendon cells expressing SPLICSLER-PM and transfected with siRNA, further treated with DMSO or Synta66 for 6 days (E) and quantification (F) (n = 31 to 37 cells per group from three independent experiments). Each top left panel is an enlargement of the yellow dashed boxed area in the corresponding middle panel. Scale bars, 10 μm. (G) Schematics summarizing the status of PM-ER tethering and the SOCE ability in tendon cells with different treatments. (H and I) Representative FLIM images (H) of ER Flipper-TR in tendon cells transfected with siRNA and treated with DMSO or Synta66 in 2D cyclic stretching environment for 6 days and quantification (I) (n = 24 cells per group, each with at least two ROIs, from three independent experiments). Scale bars, 1 μm. *P < 0.05; **P < 0.01; ***P < 0.001; n.s., not significant by one-way ANOVA (B and I) or Kruskal-Wallis test (F). Error bars stand for SEM. (C) and (G) created with BioRender.com.
Fig. 6.
Fig. 6.. ER tension dose-dependently associates with ER-mitochondria interaction.
(A) Schematic diagram illustrating our hypothetical model of tension-driven ER-mitochondria interaction. (B) Representative 3D confocal images (left) and fluorescence intensity analysis (right) around the mitochondria showing the colocalization between RFP-labeled mitochondria (red) and GFP-labeled ER (green) in 3D tendon constructs receiving 0, 3, 6, or 9% cyclic strain. Scale bars, 1 μm. (C) Quantification of the Manders’ coefficient based on data from (B) (n = 15 cells from three independent experiments). (D and E) Representative live-cell SIM images (D) and corresponding color-coded distribution maps of the ER on the mitochondria (magenta) (E) showing the colocalization between RFP-labeled mitochondria and GFP-labeled ER in 3D tendon constructs receiving 0, 3, 6, or 9% cyclic strain. Scale bars, 1 μm. (F and G) Representative TEM images of 3D tendon constructs receiving 0, 3, 6, or 9% cyclic strain (F). Scale bars, 200 nm. Middle panels show the pseudocolored images highlighting the ER (orange), the mitochondria (red), and ER-mitochondria contact sites (yellow) in different colors. ER-mitochondria contact sites are defined as sites of contact within a reciprocal distance of 30 nm. Bottom panels are the zooms of the purple dashed boxed area in the corresponding middle panel. Yellow lines indicate the ER-mitochondria contacts. The corresponding quantitative analysis to the extent of individual ER-mitochondria contact site (0% strain, n = 74; 3% strain, n = 127; 6% strain, n = 119; 9% strain, n = 102; n, contact sites from three independent experiments) (G). ***P < 0.001; n.s., not significant by one-way ANOVA (C) or by Kruskal-Wallis test (G). SIM, structured illumination microscopy. Violin plot presents the median and quartiles. Error bars stand for SEM. (A) created with BioRender.com.
Fig. 7.
Fig. 7.. Mechanical strain affects cellular energy metabolism.
(A to C) Luminescence measurement of ATP (A) (n = 5 biological replicates from three independent experiments), representative confocal fluorescence images of H2DCFDA-labeled ROS (scale bar, 10 μm) (B), and corresponding fluorescence intensity quantification (C) of H2DCFDA in 3D tendon constructs receiving 0, 3, 6, or 9% cyclic strain (n = 5 biological replicates from three independent experiments). (D) Mitochondrial respiration and glycolysis activity of 3D tendon constructs receiving 0, 3, 6, or 9% cyclic strain (n = 5 biological replicates from four independent experiments) measured by the OCR and ECAR. (E to G) Luminescence measurement of ATP (E) (n = 5 biological replicates from three independent experiments) and representative immunoblot analysis of TNMD and COL1 expression (F), as well quantitative analysis of the immunoblot data (G) (three biological replicates from three independent experiments), of 3D tendon constructs receiving 9% strain treated with or without NAC. β-Actin expression was measured as the internal control in the immunoblot analysis. (H) Bubble plots of integrative bioinformatics analysis showing the top 5 ranked GO terms for biological process (BP; left) and molecular function (MF; right) (by P value) for common mechanoresponsive cellular activities. *P < 0.05; **P < 0.01; ***P < 0.001; n.s., not significant by one-way ANOVA (A and C) or by Student’s t test (E and G). NAC, N-acetylcysteine. Error bars stand for SEM (A, C, E, and G) or SD (D). (H) created with BioRender.com.
Fig. 8.
Fig. 8.. Manipulation of the PM-ER tether structure alters mechanoresponsive energy metabolism and related ER responses.
(A and B) Representative TEM images of 3D tendon constructs transfected with siRNA and cultured under 9% cyclic strain showing PM-ER contacts (A). Middle panels highlighting the PM (red), ER (orange), and contact sites (yellow). PM-ER contact sites, a reciprocal distance of 30 nm. Right panels are from the purple dashed boxed area in the middle panel. ExcM, extracellular matrix. (B) Quantification to the extent of individual PM-ER contact site (n = 62 to 73 contact sites). (C and D) Representative confocal images of GFP-labeled ER (C) and ER morphology analysis (D) in constructs (n = 15 cells). (E and F) Representative 3D confocal images (E) showing colocalization of RFP-labeled mitochondria and GFP-labeled ER in constructs transfected with siRNA under 9% strain and Manders’ coefficient quantification (F) (n = 15 cells). (G and H) Representative SIM imaging (G) and distribution maps of GFP-labeled ER on RFP-labeled mitochondria (H) in constructs receiving 9% strain and transfected with siRNA. (I and J) Representative TEM images of constructs transfected with siRNA under 9% strain showing the ER-mitochondria contacts (I) and quantification (J) (n = 67 to 107 contact sites). (K to M) ATP luminescence (K), representative confocal fluorescence images of H2DCFDA-labeled ROS (L), and H2DCFDA quantification (M) (n = 5 biological replicates) in constructs receiving 9% strain with siRNA transfection. (N) Mitochondrial respiration of tendon constructs transfected with siRNA and treated with DMSO or Synta66 under 9% strain (n = 7 biological replicates). (O) Luminescence measurement of ATP in constructs receiving 9% strain, transfected with siRNA, and treated with DMSO or Synta66 (n = 5 biological replicates). Scale bars, 200 nm (A and I), 10 μm (C and L), or 1 μm (E and G). n, replicates per group from at least three independent experiments. *P < 0.05; **P < 0.01; ***P < 0.001; n.s., not significant by Student’s t test (B, D, F, K, M, and J) or one-way ANOVA (N and O). Error bars stand for SEM.
Fig. 9.
Fig. 9.. Schematic diagram illustrating a tension-related PM-ER mechanotransduction mechanism that dose-dependently regulates cellular metabolism.
Mechanical strain can be transferred from the PM to the ER on MCSs via PM-ER tether structures composed of tether proteins that localize to contact sites between the two membranes, most notably STIM1. The repeatedly mechanical forces then increase ER tension as a mechanoadaptation mechanism in a dose-dependent manner. Furthermore, the mechanical strain leads to the regulation of ER-mitochondria interactions that ultimately associates with the degree of mitochondrial function and cellular function. In particular, optimal mechanical loading leads to strengthening of the ER-mitochondria interactions and a boosting of energy metabolism, as well as greater cell function. On the other hand, mechanical overloading leads to a pathological expansion of ER content, an uncoupling of ER-mitochondria contacts, increased ER stress, and an impairment in cellular energy metabolism, as well as reduced cell function. Furthermore, detethering the ER from the PM alleviated mechanical stress in the ER under stretching. Therefore, we can manipulate this system by genetic suppression of Stim1 expression to improve outcomes in response to overloading. Figure created with BioRender.com.

Similar articles

References

    1. Hu J., Chen S., Hu W., Lü S., Long M., Mechanical point loading induces cortex stiffening and actin reorganization. Biophys. J. 117, 1405–1418 (2019). - PMC - PubMed
    1. Mathieu S., Manneville J. B., Intracellular mechanics: Connecting rheology and mechanotransduction. Curr. Opin. Cell Biol. 56, 34–44 (2019). - PubMed
    1. Tsujita K., Satow R., Asada S., Nakamura Y., Arnes L., Sako K., Fujita Y., Fukami K., Itoh T., Homeostatic membrane tension constrains cancer cell dissemination by counteracting BAR protein assembly. Nat. Commun. 12, 5930 (2021). - PMC - PubMed
    1. Jaalouk D. E., Lammerding J., Mechanotransduction gone awry. Nat. Rev. Mol. Cell Biol. 10, 63–73 (2009). - PMC - PubMed
    1. Ma S., Cahalan S., LaMonte G., Grubaugh N. D., Zeng W., Murthy S. E., Paytas E., Gamini R., Lukacs V., Whitwam T., Loud M., Lohia R., Berry L., Khan S. M., Janse C. J., Bandell M., Schmedt C., Wengelnik K., Su A. I., Honore E., Winzeler E. A., Andersen K. G., Patapoutian A., Common PIEZO1 allele in African populations causes RBC dehydration and attenuates plasmodium infection. Cell 173, 443–455.e12 (2018). - PMC - PubMed

LinkOut - more resources