. 2025 Jun 27;11(26):eadu8422.
doi: 10.1126/sciadv.adu8422. Epub 2025 Jun 25.

Cardiomyocyte-derived YOD1 promotes pathological cardiac hypertrophy by deubiquitinating and stabilizing STAT3

Affiliations

Cardiomyocyte-derived YOD1 promotes pathological cardiac hypertrophy by deubiquitinating and stabilizing STAT3

Bozhi Ye et al. Sci Adv. .

Abstract

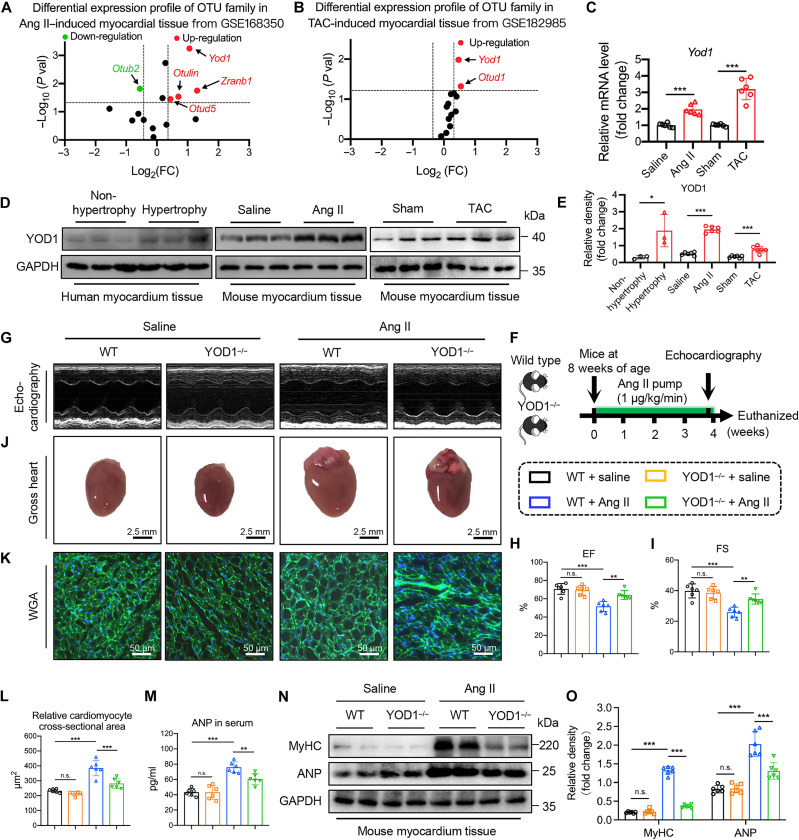
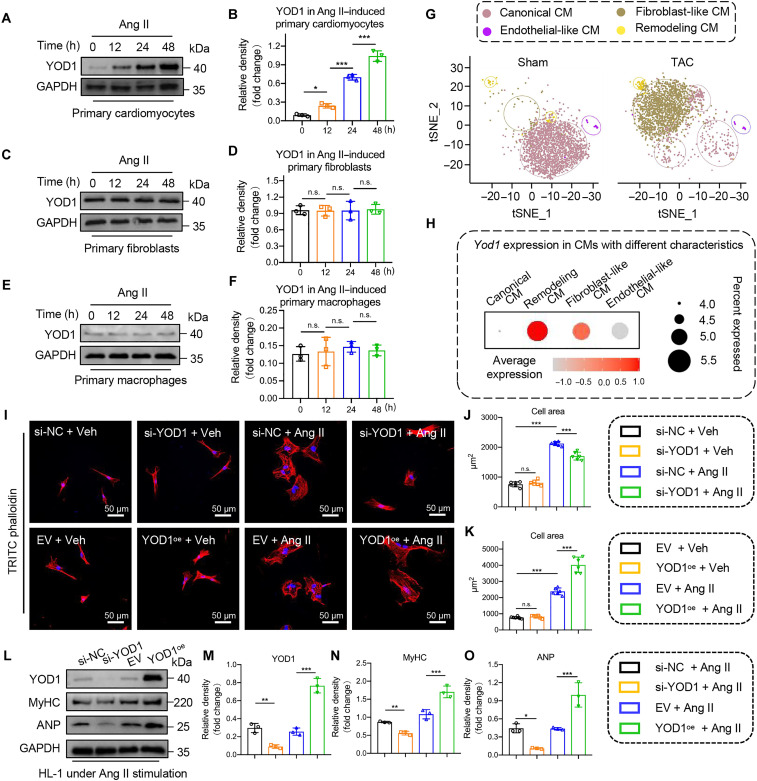
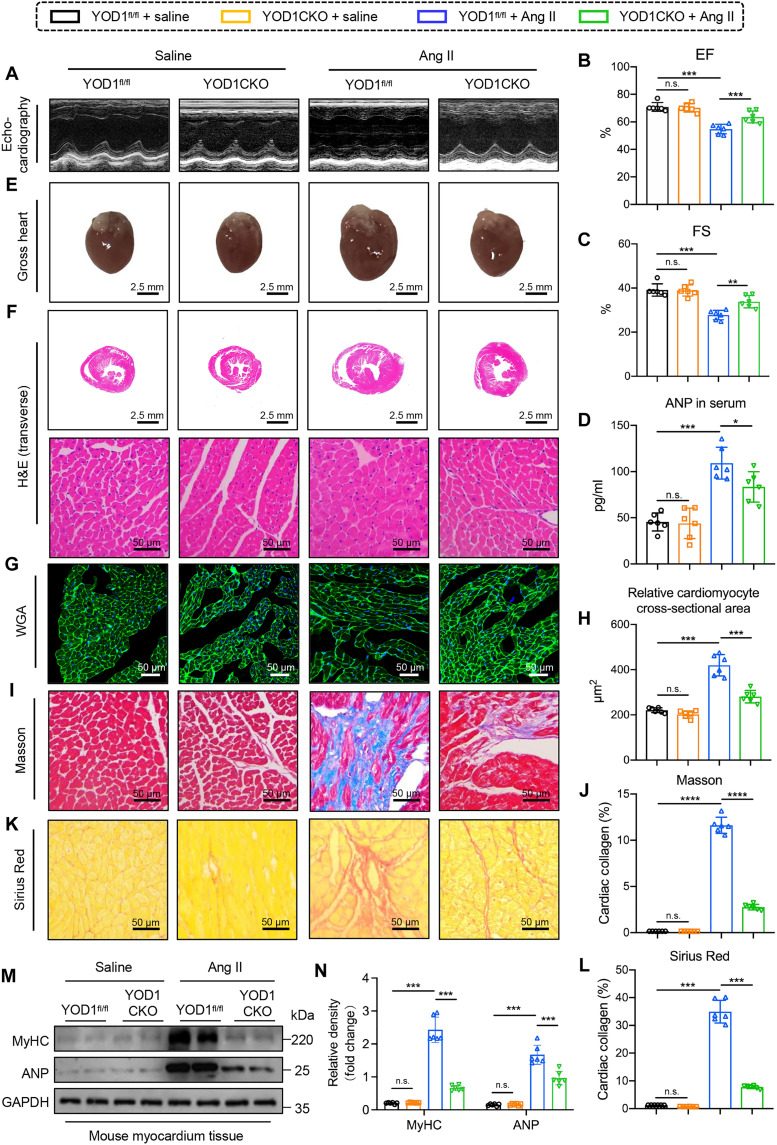
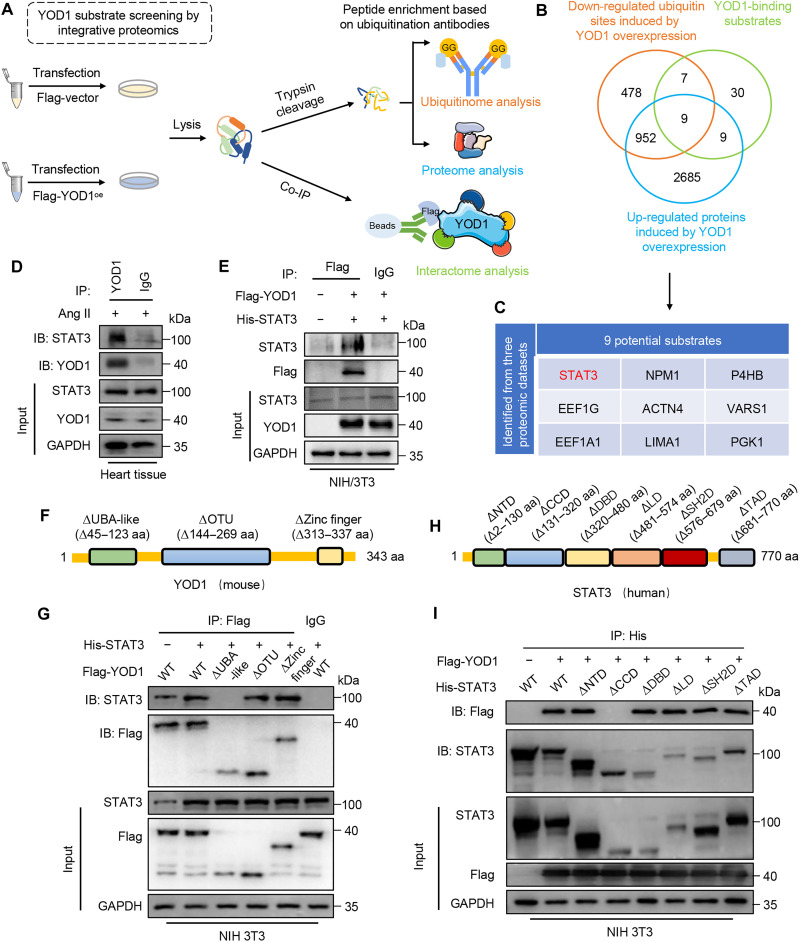
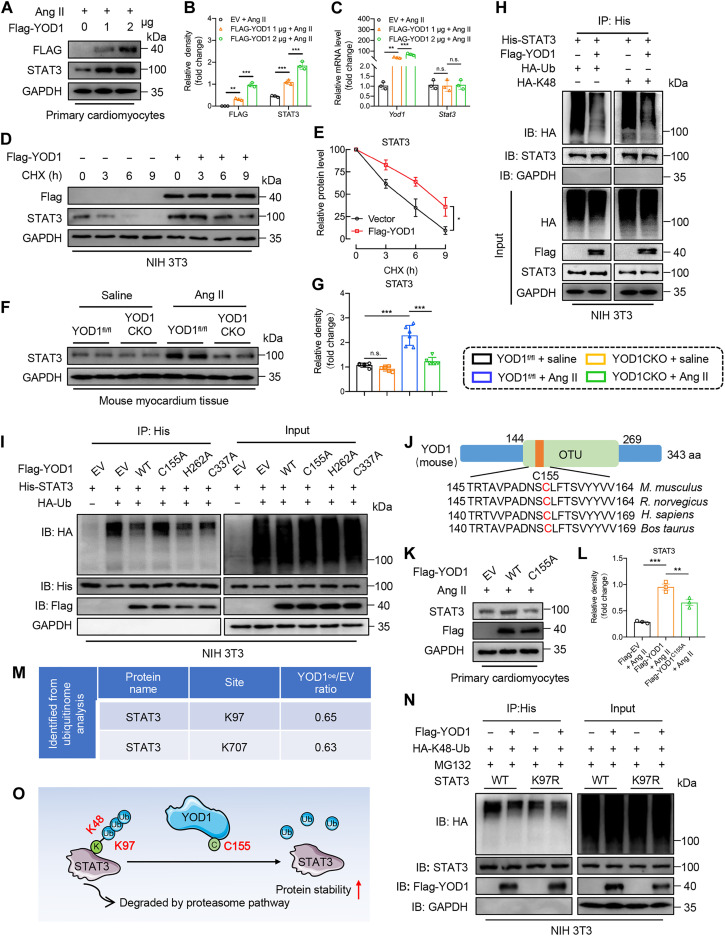
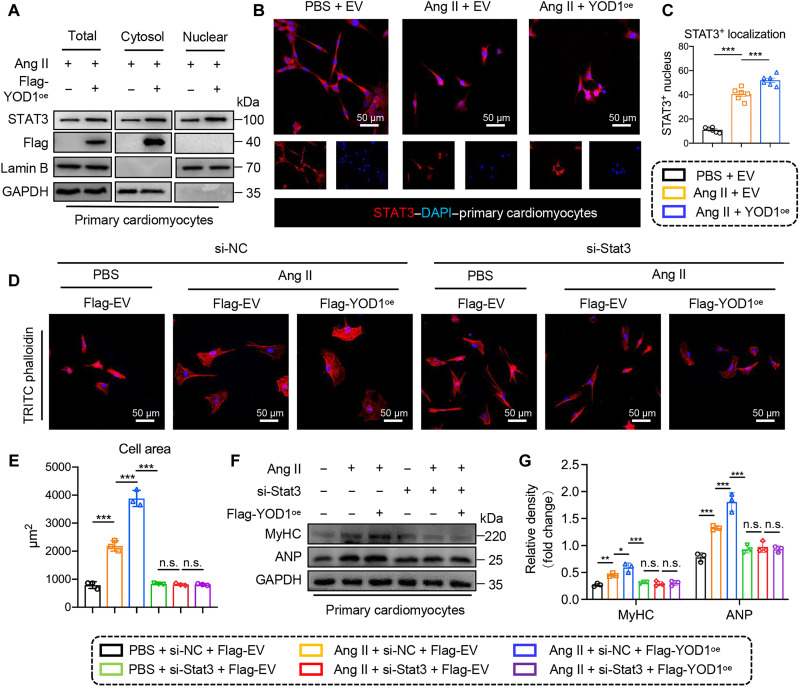
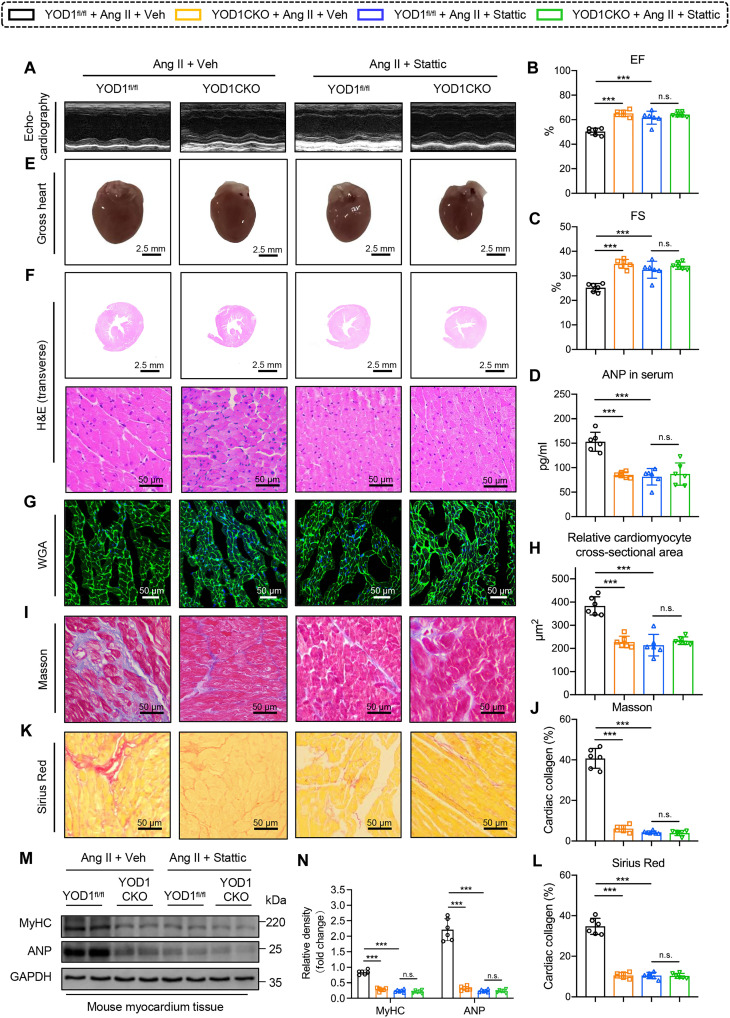
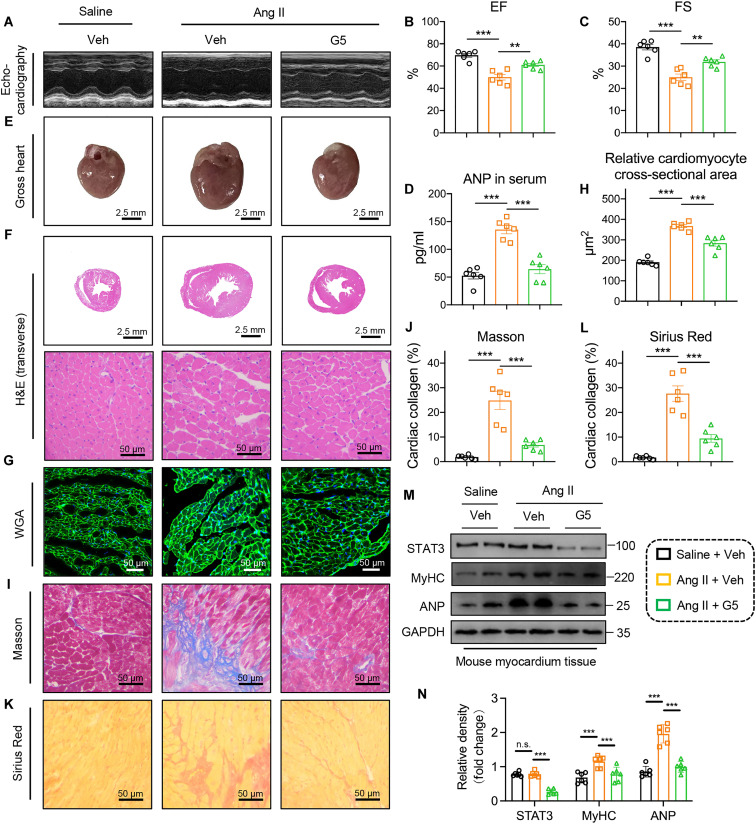
Identifying previously unknown targets for pathological cardiac hypertrophy and understanding its mechanisms are crucial. Here, we observed that the deubiquitinating enzyme YOD1 was moderately elevated in human hypertrophic myocardium and mouse models. Cardiomyocyte-specific knockout of YOD1 reduced Ang II- and TAC-induced cardiac hypertrophy. Subsequently, we used multiple proteomic analyses to identify and confirm STAT3 as a substrate protein for YOD1. Mechanistically, our findings revealed that the C155 site of YOD1 removes K48-linked ubiquitin chains from K97 on STAT3, stabilizing STAT3 levels and enhancing its nuclear translocation in cardiomyocytes under Ang II stimulation. Notably, inhibiting STAT3 reversed the antihypertrophic effects of YOD1 deficiency in Ang II-challenged mice. In addition, pharmacological inhibition of YOD1 mitigated Ang II-induced pathological ventricular remodeling in mice. This study clarifies the role of YOD1 and introduces a previously unidentified YOD1-STAT3 axis in regulating pathological cardiac hypertrophy, providing valuable insights for drug development targeting this condition.


Figures

Fig. 1.
Fig. 1.. Identification of YOD1 as a contributor to cardiac hypertrophy.
(A and B) RNA transcriptome sequencing was performed to analyze the expression profile of DUBs in the OTU family within mouse myocardium subjected to Ang II– (A) and TAC-induced (B) conditions. The log2 fold change (FC) values reflect relative expression changes of OTU family members. Red and green points indicate up-regulated and down-regulated OTUs compared to the control group, while black points represent OTUs without statistically significant differences from the control group. (C) Real-time quantitative PCR (qPCR) analysis of mRNA expression levels of OTU family members in mouse myocardium tissue induced by Ang II and TAC stimulation. (D and E) Representative Western blot analysis of YOD1 in human myocardium tissues from both nonhypertrophic and hypertrophic samples, as well as in mouse myocardium tissues subjected to saline and Ang II stimulation, along with tissues from sham-operated and TAC-treated mice (E) and densitometric quantification (E). (F) The experimental flowchart for the Ang II–induced cardiac hypertrophic mouse model. YOD1 whole-body knockout (YOD1−/−) mice and wild-type (WT) C57BL/6J mice were injected with Ang II (1 μg kg–1 min–1) or saline via an osmotic pump for 4 weeks to induce cardiac hypertrophy. (G) Representative M-mode echocardiography of mice in each group. (H and I) Myocardial function parameters, including ejection fraction (EF; H) and fractional shortening (FS; I), were evaluated in mice through echocardiography. (J) Representative images of whole hearts. (K and L) Representative images of wheat germ agglutinin (WGA; K) staining in sections of hearts and quantitative area analysis (L). (M) The plasma levels of atrial natriuretic peptide (ANP) in each group. (N and O) Representative Western blot analysis of MyHC and ANP in myocardium tissues of YOD1−/− and WT mice subjected to saline and Ang II stimulation (N) and densitometric quantification (O). Not significant (n.s.), P > 0.05; *P < 0.05; **P < 0.01; ***P < 0.001. n = 6 [n = 3 for the human myocardium sample in (D)].
Fig. 2.
Fig. 2.. Cardiomyocyte YOD1 is highly expressed and promotes cardiomyocyte hypertrophy.
(A to F) Representative Western blot analysis of YOD1 in primary cardiomyocytes (A), primary fibroblasts (C), and primary macrophages (E) subjected to Ang II stimulation at various time points and densitometric quantification (B, D, and F). n = 3. h, hours. (G) Single-cell mRNA sequencing was conducted on the hearts of mice subjected to sham operation and TAC treatment. For each group, single-cell suspensions from three to four hearts were pooled into one sample. The t-SNE distribution of clustering identified four distinct functional cardiomyocyte clusters: canonical cardiomyocyte, fibroblast-like cardiomyocyte, endothelial-like cardiomyocyte, and remodeling cardiomyocyte. CM, cardiomyocyte. (H) The dot plot illustrates the relative expression of Yod1 across various functional cardiomyocyte clusters. (I to K) Representative images of tetramethyl rhodamine isothiocyanate (TRITC)–labeled rhodamine-phalloidin staining in primary cardiomyocytes. Cardiomyocytes were transfected with plasmids containing either the empty vector (EV) or YOD1 overexpression (YOD1oe) and siRNAs targeting negative control (si-NC) or YOD1 (si-YOD1), followed by stimulation with Ang II (1 μM for 24 hours) or Vehicle (Veh). The surface area of the cardiomyocytes was assessed using TRITC-labeled rhodamine-phalloidin staining (I), accompanied by a corresponding quantitative analysis (J and K). n = 6. (L to O) Representative Western blot analysis of YOD1, MyHC, and ANP in HL-1 under Ang II stimulation (L) and densitometric quantification (M to O). n = 6. The cell processing procedure is consistent with that depicted in (J). n = 3. n.s., P > 0.05; *P < 0.05; **P < 0.01; ***P < 0.001.
Fig. 3.
Fig. 3.. Cardiomyocyte-specific knockout of YOD1 alleviated the cardiac remodeling.
Healthy male YOD1CKO mice (cardiomyocyte-specific YOD1CKO mice) aged 6 to 8 weeks and YOD1fl/fl mice were injected with Ang II (1 μg kg–1 min–1) or normal saline via an osmotic pump (catalog no. ALZET Model 1004, USA) for 4 weeks to induce cardiac hypertrophy. (A) Representative M-mode echocardiography of mice in each group. (B and C) Myocardial function parameters, including EF (B) and FS (C), were evaluated in mice through echocardiography. (D) The plasma levels of ANP in each group. (E) Representative images of whole hearts. Scale bars, 2.5 mm. (F) Representative images of H&E staining of transverse section in myocardium tissues. Scale bars, 2.5 mm and 50 μm. (G and H) Representative images of WGA (G) staining in sections of hearts and quantitative area analysis (H). Scale bars, 50 μm. (I to L) Fibrotic areas were evaluated using Masson’s trichrome (I) and Sirius Red (K) staining, as well as the quantification of fibrotic regions (H and J) in heart sections from each group. Scale bars, 50 μm. (M and N) Representative Western blot analysis of MyHC and ANP (M) and densitometric quantification (N). n = 6. n.s., P > 0.05; *P < 0.05; **P < 0.01; ***P < 0.001. YOD1fl/fl, YOD1fl/fl mice.
Fig. 4.
Fig. 4.. YOD1 directly interacts with STAT3.
(A) Schematic diagram of three omic processes for YOD1 substrate screening. Cardiomyocytes were transfected with Flag-vector or Flag-YOD1 plasmids, followed by Ang II stimulation (1 μM for 24 hours). Anti-Flag and protein G–Sepharose beads were added to the cell samples for interactome analysis using co-IP. The binding proteins were extracted, digested to peptides, and then subjected to LC-MS/MS measurement for ubiquitinome and proteome analyses. (B and C) The Venn diagram depicts the integration of three omic approaches for identifying substrate proteins of YOD1 (B). The following table presents the nine candidate substrates of YOD1 that were screened using these three omic methods (C). (D) Co-IP of endogenous YOD1 and STAT3 in primary cardiomyocytes following Ang II stimulation. Endogenous YOD1 was immunoprecipitated using an anti-YOD1 antibody. IgG, immunoglobulin G. (E) Co-IP of YOD1 and STAT3 in NIH 3T3 cells cotransfected with Flag-YOD1 and His-STAT3 plasmids. Exogenous STAT3 was immunoprecipitated by anti-His antibody. (F) A schematic representation of the STAT3 domain deletion construct used in (G). aa, amino acids; UBA, Ub-associated domain. (G) Co-IP of WT-STAT3, mut-STAT3, and YOD1 in NIH 3T3 cells cotransfected with overexpression plasmids of Flag-WT-STAT3, Flag-mut-STAT3, and Flag-YOD1. Exogenous normal or mutated STAT3 was immunoprecipitated by anti-His antibody. (H) A schematic representation of the YOD1 domain deletion construct used in Fig. 5I. (I) Co-IP of WT-YOD1, mut-YOD1, and STAT3 in NIH 3T3 cells cotransfected with overexpression plasmids of Flag-WT-YOD1, Flag-mut-YOD1, and His-STAT3. Exogenous normal or mutated YOD1 was immunoprecipitated by anti-Flag antibody. IB, immunoblotting; NTD, N-terminal Domain; CCD, Coiled-coil Domain; DBD, DNA-binding Domain; LD, Linker Domain; SH2, Src Homology 2 Domain; TAD, Transactivation Domain.
Fig. 5.
Fig. 5.. YOD1 regulates the deubiquitination and stability of STAT3.
(A to C) Representative Western blot analysis of YOD1 and STAT3 in primary cardiomyocytes (A) and real-time qPCR analysis of mRNA expression levels of Yod1 and Stat3 in NIH 3T3 cells (C) transfected with varying doses of Flag-YOD1oe plasmids and densitometric quantification (B). n = 3. (D and E) Representative Western blot analysis of STAT3 in NIH 3T3 cells transfected with Flag-YOD1oe plasmids, followed by a CHX pulse-chase assay (D) and densitometric quantification (E). n = 3. (F and G) Representative Western blot analysis of STAT3 in Ang II–induced heart tissues from YOD1CKO mice (F) and densitometric quantification (G). n = 6. (H) Co-IP of STAT3 in NIH 3T3 cells cotransfected with overexpression plasmids for His-STAT3, Flag-YOD1, hemagglutinin (HA)–Ub, and HA-Ub-K48. Ubiquitinated STAT3 was identified to elucidate the ubiquitination pattern of STAT3 regulated by YOD1. (I) Co-IP of STAT3 in NIH 3T3 cells cotransfected with overexpression plasmids for Flag-YOD1-WT, Flag-YOD1-Mut, His-STAT3, and HA-Ub. Ubiquitinated STAT3 was detected to elucidate the ubiquitination level of STAT3 regulated by the active site of YOD1. (J) Schematic representation of the sequence of YOD1-C155 across various species. (K and L) Representative Western blot analysis of STAT3 in primary cardiomyocytes transfected with Flag-YOD1-WT and Flag-YOD1-C155A overexpression plasmids (K) and densitometric quantification (L). n = 3. (M) Ubiquitinome analysis showed YOD1-regulated ubiquitination lysine residues of STAT3. (N) Co-IP of STAT3 in NIH 3T3 cells that were cotransfected with overexpression plasmids encoding Flag-YOD1, His-STAT3-WT, His-STAT3-K97R, and HA-Ub-K48. Ubiquitinated STAT3 was detected to elucidate the ubiquitination lysine residues of STAT3 regulated by YOD1. (O) Schematic illustrating that YOD1 preserves the stability of STAT3 by deubiquitinating it at residue K97 through its active site C155. n.s., P > 0.05; **P < 0.01; ***P < 0.001.
Fig. 6.
Fig. 6.. YOD1 facilitates the nuclear translocation of STAT3.
Cardiomyocytes from (A) to (C) were transfected with plasmids containing either the empty vector or YOD1 (YOD1oe), followed by stimulation with Ang II (1 μM for 24 hours). Cardiomyocytes from (D) to (G) were transfected with plasmids containing either the empty vector or YOD1 (YOD1oe) and siRNAs targeting negative control or STAT3, followed by stimulation with Ang II (1 μM for 24 hours). (A) Representative Western blot analysis of STAT3 in total cell lysate, cytoplasmic lysate, and nuclear lysate. Glyceraldehyde phosphate dehydrogenase (GAPDH) and lamin B were used as loading controls. (B and C) Representative images of immunofluorescence staining illustrating STAT3 nuclear translocation in cardiomyocytes (B), along with the corresponding quantitative analysis (C). The staining results are presented as follows: Red represents STAT3, while blue indicates 4′,6-diamidino-2-phenylindole (DAPI). Scale bars, 50 μm. n = 6. (D and E) The surface area of the cardiomyocytes was assessed using TRITC-labeled rhodamine-phalloidin staining (D), accompanied by a corresponding quantitative analysis (E). n = 3. (F and G) Representative Western blot analysis of MyHC and ANP in cardiomyocytes (F) and densitometric quantification (G). n.s., P > 0.05; *P < 0.05; **P < 0.01; ***P < 0.001.
Fig. 7.
Fig. 7.. YOD1 enhances Ang II–induced cardiac hypertrophy dependent on STAT3.
To verify the effect of YOD1 on STAT3, the STAT3 inhibitor Stattic (10 mg/kg, gavage) or vehicle [0.5% O-carboxymethylcellulose (CMC)–Na and 0.25% Tween 80] was administered every 3 days via oral gavage. Healthy male YOD1CKO mice aged 6 to 8 weeks and YOD1fl/fl mice were injected with Ang II (1 μg kg–1 min–1) or normal saline via an osmotic pump (catalog no. ALZET Model 1004, USA) for 4 weeks to induce cardiac hypertrophy. (A) Representative M-mode echocardiography of mice in each group. (B and C) Myocardial function parameters, including EF (B) and FS (C), were evaluated in mice through echocardiography. (D) The plasma levels of ANP in each group. (E) Representative images of whole hearts. Scale bars, 2.5 mm. (F) Representative images of H&E staining of transverse section in myocardium tissues. Scale bars, 2.5 mm and 50 μm. (G and H) Representative images of WGA (G) staining in sections of hearts and quantitative area analysis (H). Scale bars, 50 μm. (I to L) Fibrotic areas were evaluated using Masson’s trichrome (I) and Sirius Red (K) staining, as well as the quantification of fibrotic regions (H and J) in heart sections from each group. Scale bars, 50 μm. (M and N) Representative Western blot analysis of MyHC and ANP (M) and densitometric quantification (N). n = 6. n.s., P > 0.05; ***P < 0.001.
Fig. 8.
Fig. 8.. Pharmacological inhibition of YOD1 alleviates Ang II–induced cardiac hypertrophy.
To investigate the pharmacological inhibition of YOD1 on cardiac hypertrophy, the YOD1 inhibitor G5 (10 mg/kg, gavage) or vehicle (0.5% CMC-Na and 0.25% Tween 80) was delivered every 3 days using oral gavage. Healthy male WT mice aged 6 to 8 weeks were injected with Ang II (1 μg kg–1 min–1) or normal saline via an osmotic pump (catalog no. ALZET Model 1004, USA) for 4 weeks to induce cardiac hypertrophy. (A) Representative M-mode echocardiography of mice in each group. (B and C) Myocardial function parameters, including EF (B) and FS (C), were evaluated in mice through echocardiography. (D) The plasma levels of ANP in each group. (E) Representative images of whole hearts. Scale bars, 2.5 mm. (F) Representative images of H&E staining of transverse section in myocardium tissues. Scale bars, 2.5 mm and 50 μm. (G and H) Representative images of WGA (G) staining in sections of hearts and quantitative area analysis (H). Scale bars, 50 μm. (I to L) Fibrotic areas were evaluated using Masson’s trichrome (I) and Sirius Red (K) staining, as well as the quantification of fibrotic regions (H and J) in heart sections from each group. Scale bars, 50 μm. (M and N) Representative Western blot analysis of STAT3, MyHC, and ANP (M) and densitometric quantification (N). n = 6. n.s., P > 0.05; **P < 0.01; ***P < 0.001.

Similar articles

References

    1. Messerli F. H., Williams B., Ritz E., Essential hypertension. Lancet 370, 591–603 (2007). - PubMed
    1. Oldfield C. J., Duhamel T. A., Dhalla N. S., Mechanisms for the transition from physiological to pathological cardiac hypertrophy. Can. J. Physiol. Pharmacol. 98, 74–84 (2020). - PubMed
    1. McKinsey T. A., Kass D. A., Small-molecule therapies for cardiac hypertrophy: Moving beneath the cell surface. Nat. Rev. Drug Discov. 6, 617–635 (2007). - PubMed
    1. Karbassi E., Fenix A., Marchiano S., Muraoka N., Nakamura K., Yang X., Murry C. E., Cardiomyocyte maturation: Advances in knowledge and implications for regenerative medicine. Nat. Rev. Cardiol. 17, 341–359 (2020). - PMC - PubMed
    1. Wang B., Cai W., Ai D., Zhang X., Yao L., The role of deubiquitinases in vascular diseases. J. Cardiovasc. Transl. Res. 13, 131–141 (2020). - PubMed

LinkOut - more resources