

Occupation, displacement, and violence in the West Bank: A retrospective analysis of data from 2014-2024
- PMID: 40561106
- PMCID: PMC12193732
- DOI: 10.1371/journal.pgph.0004829
Occupation, displacement, and violence in the West Bank: A retrospective analysis of data from 2014-2024
Abstract
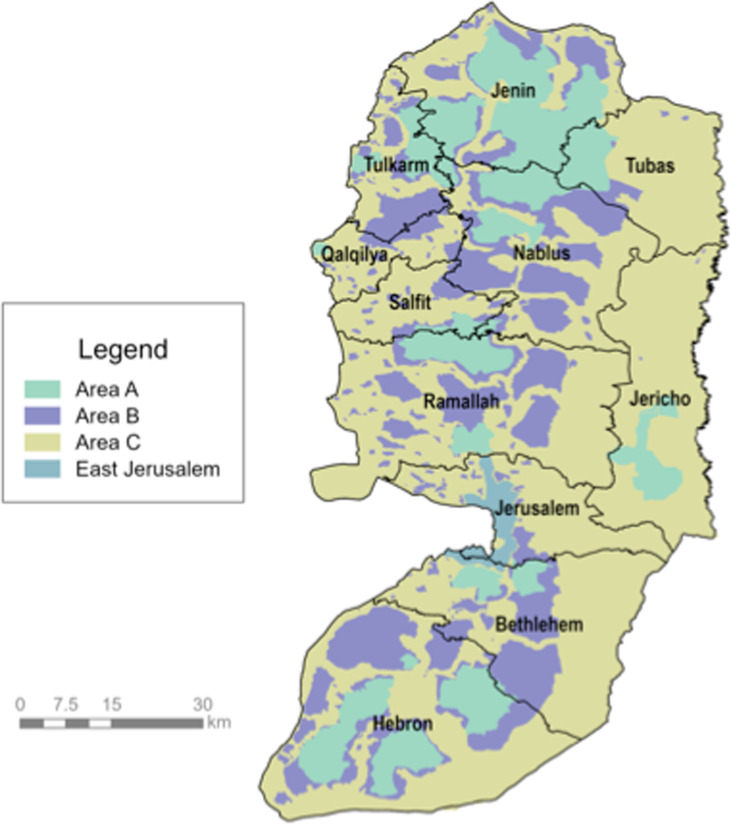
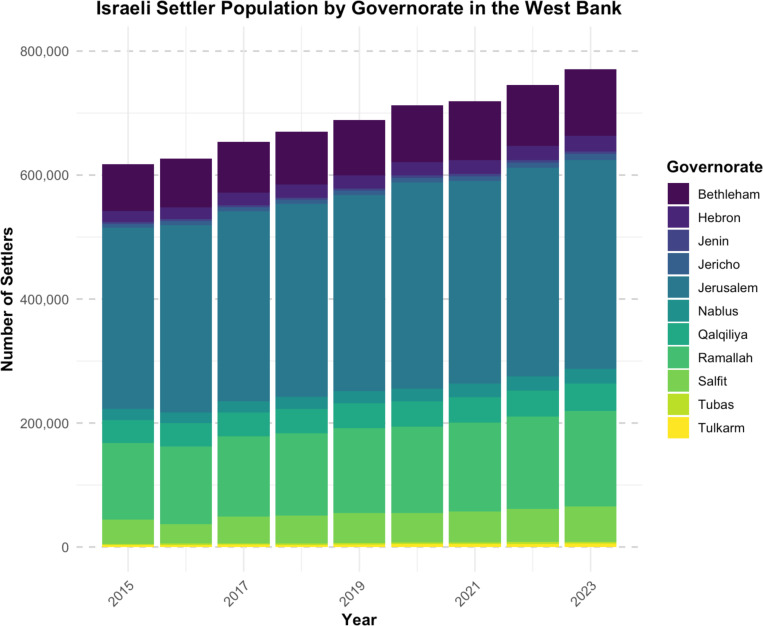
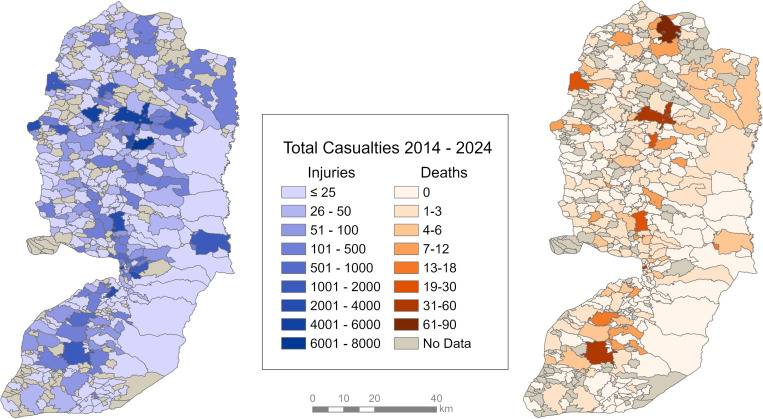
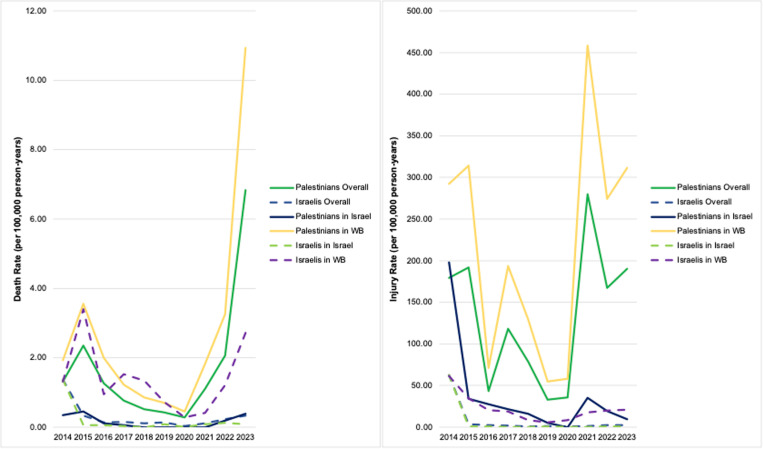
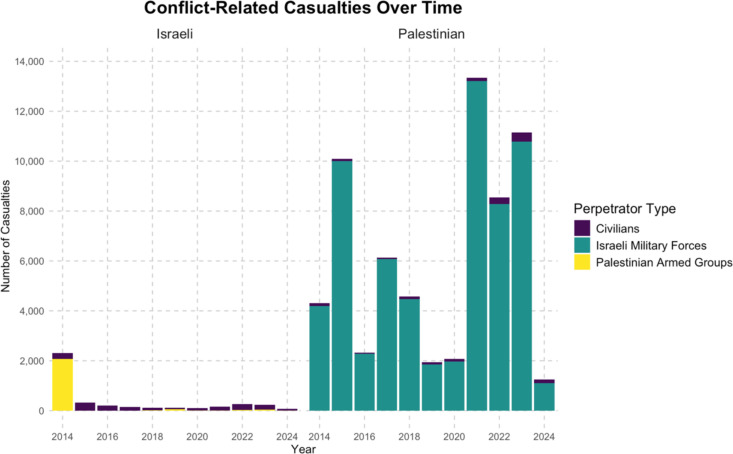
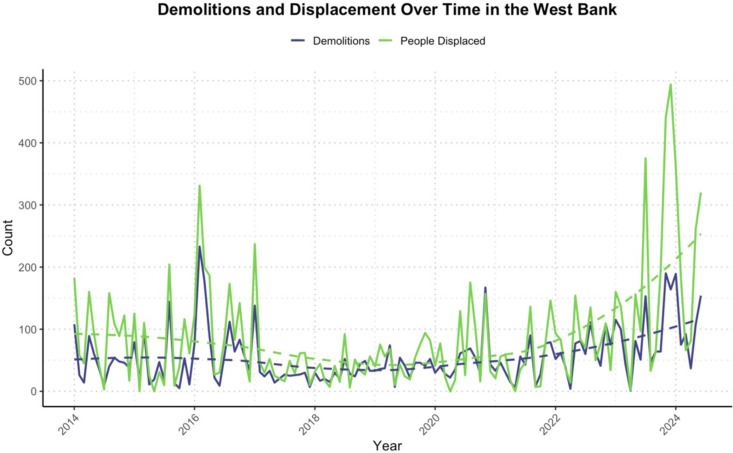
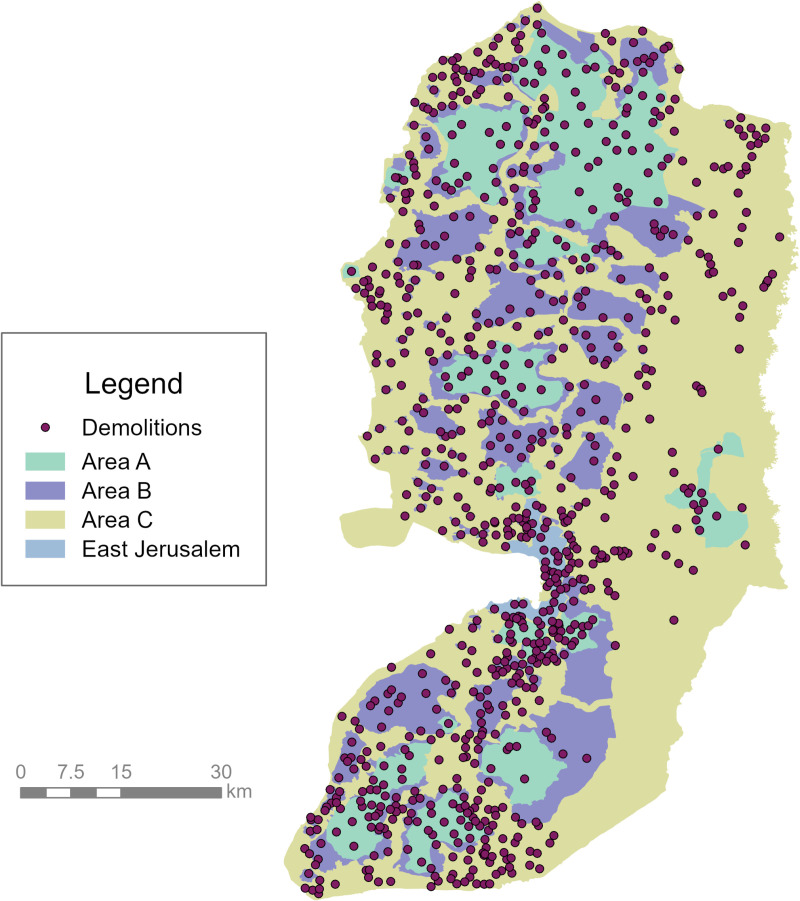
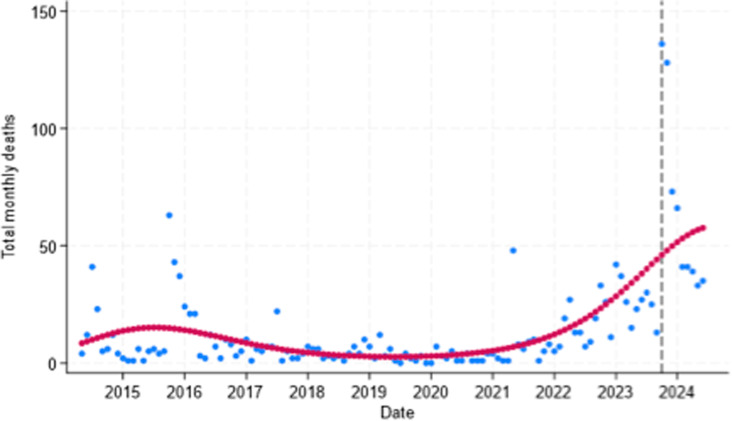
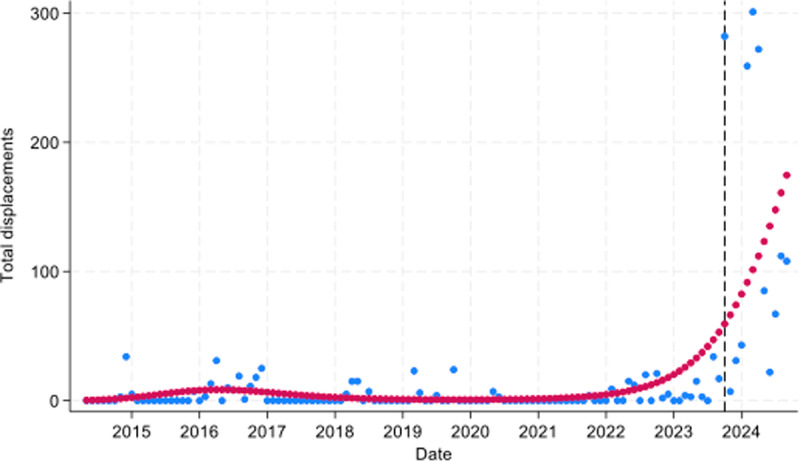
Israeli settlement expansion in the West Bank has intensified violence in the occupied Palestinian territories (oPt). This violence escalated after attacks by Hamas on Israel on 7 October 2023 and the subsequent military campaign in Gaza. This study examines the possible impacts of military and land occupation on displacement, injuries, and deaths in the West Bank. This cross-sectional observational study analyses casualties and displacement data in the West Bank and Israel from May 1, 2014, to June 30, 2024. Sources include the United Nations Office of Coordination of Humanitarian Affairs, Statista, and the Palestinian Central Bureau of Statistics. Death and injury rates per 100,000 person-years were calculated and compared across populations. Interrupted time-series analysis compared observed Palestinian deaths, injuries, and displacement to expected levels since October 2023. Chi-square analysis examined demolition patterns by West Bank area. GIS mapping methods visualized spatial variations in casualties and demolitions. Death and injury rates were substantially higher for Palestinians than Israelis: RR = 5.72 (95% CI 2.38, 13.75; p < 0.001) for deaths and RR = 16.47 (6.86, 39.56; p < 0.001) for injuries. Refugee camps had increased death rates: IRR = 7.91 (5.26, 11.89; p < 0.0001) compared to non-refugee camp populations. Since October 2023, West Bank deaths were 25% higher than expected: RR = 1.25 (1.15, 1.36; p < 0.0001) and displacement 17% higher: RR = 1.17 (1.12, 1.21; p < 0.0001). Nablus and Jenin recorded the highest fatalities. Jabal al-Mukkabir in East Jerusalem experienced the highest number of demolitions. Our study confirms a significant disparity in rates of conflict-related traumatic injuries and deaths between Palestinians and Israelis. The findings emphasize the need to limit military force against civilians, to hold the Israeli government accountable for demolitions and displacement, and to instigate protective measures in refugee communities. Policy efforts should prioritize conflict de-escalation, including reaching a sustainable political solution.
Copyright: © 2025 Aly et al. This is an open access article distributed under the terms of the Creative Commons Attribution License, which permits unrestricted use, distribution, and reproduction in any medium, provided the original author and source are credited.
Conflict of interest statement
The authors have declared that no competing interests exist.
Figures
Similar articles
-
Surveillance for Violent Deaths - National Violent Death Reporting System, 50 States, the District of Columbia, and Puerto Rico, 2022.MMWR Surveill Summ. 2025 Jun 12;74(5):1-42. doi: 10.15585/mmwr.ss7405a1. MMWR Surveill Summ. 2025. PMID: 40493548 Free PMC article.
-
Running shoes for preventing lower limb running injuries in adults.Cochrane Database Syst Rev. 2022 Aug 22;8(8):CD013368. doi: 10.1002/14651858.CD013368.pub2. Cochrane Database Syst Rev. 2022. PMID: 35993829 Free PMC article.
-
Systemic pharmacological treatments for chronic plaque psoriasis: a network meta-analysis.Cochrane Database Syst Rev. 2021 Apr 19;4(4):CD011535. doi: 10.1002/14651858.CD011535.pub4. Cochrane Database Syst Rev. 2021. Update in: Cochrane Database Syst Rev. 2022 May 23;5:CD011535. doi: 10.1002/14651858.CD011535.pub5. PMID: 33871055 Free PMC article. Updated.
-
Sertindole for schizophrenia.Cochrane Database Syst Rev. 2005 Jul 20;2005(3):CD001715. doi: 10.1002/14651858.CD001715.pub2. Cochrane Database Syst Rev. 2005. PMID: 16034864 Free PMC article.
-
War and chronic illness: a health center-based study of Palestinians with non-communicable diseases in Gaza.Confl Health. 2025 Jun 24;19(1):36. doi: 10.1186/s13031-025-00679-9. Confl Health. 2025. PMID: 40556013 Free PMC article.
References
-
- Occupied Palestinian Territory [Internet]. United Nations Office for the Coordination of Humanitarian Affairs. 2025. [cited 2025 Feb 12]. Available from: https://www.unocha.org/occupied-palestinian-territory
-
- Settlements [Internet]. B’Tselem. 2019. [cited 2025 Feb 12]. Available from: http://www.btselem.org/settlements
-
- Chapter 3: Israeli Settlements and International Law [Internet]. Amnesty International. 2019. [cited 2025 Feb 12]. Available from: https://www.amnesty.org/en/latest/campaigns/2019/01/chapter-3-israeli-se...
-
- Legal Consequences arising from the Policies and Practices of Israel in the Occupied Palestinian Territory, in [Internet]. International Court of Justice. [cited 2025 Feb 12]. Available from: https://www.icj-cij.org/case/186
-
- Israel’s settlement expansion is alarming and flies in face of international law - OHCHR [Internet]. United Nations. [cited 2025 Feb 12]. Available from: https://www.un.org/unispal/document/israels-settlement-expansion-19aug24/
LinkOut - more resources
Full Text Sources