. 2025 Jul 1;37(7):koaf164.
doi: 10.1093/plcell/koaf164.

Ubiquitin-dependent proteolysis of KNL2 driven by APC/CCDC20 is critical for centromere integrity and mitotic fidelity

Affiliations

Ubiquitin-dependent proteolysis of KNL2 driven by APC/CCDC20 is critical for centromere integrity and mitotic fidelity

Manikandan Kalidass et al. Plant Cell. .

Abstract

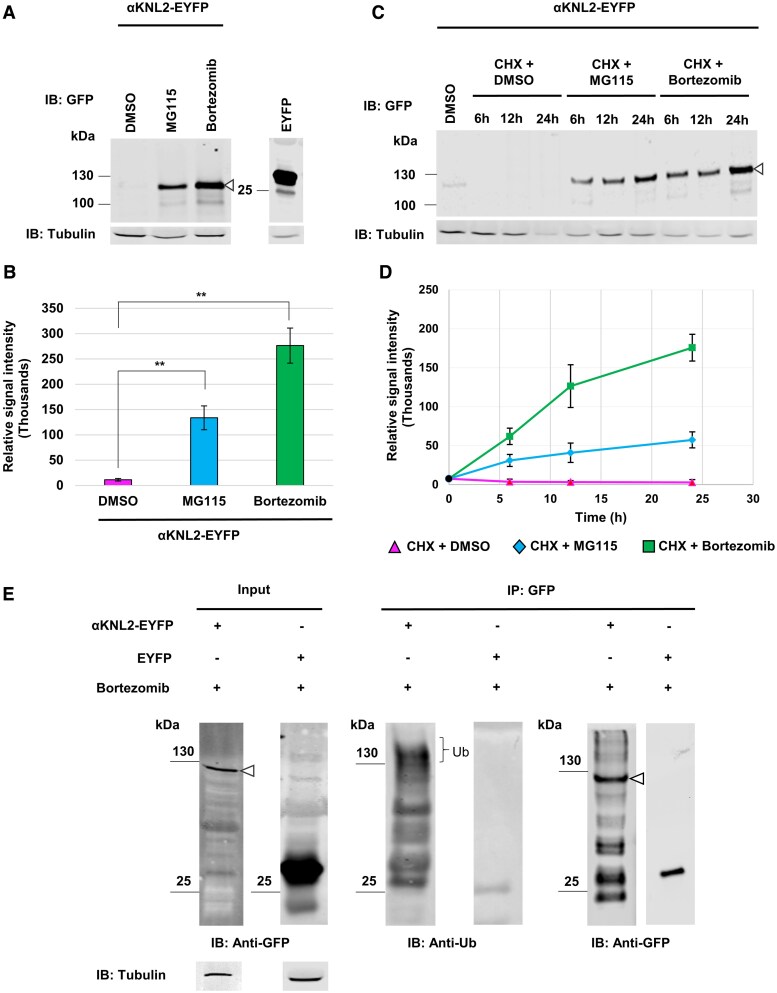
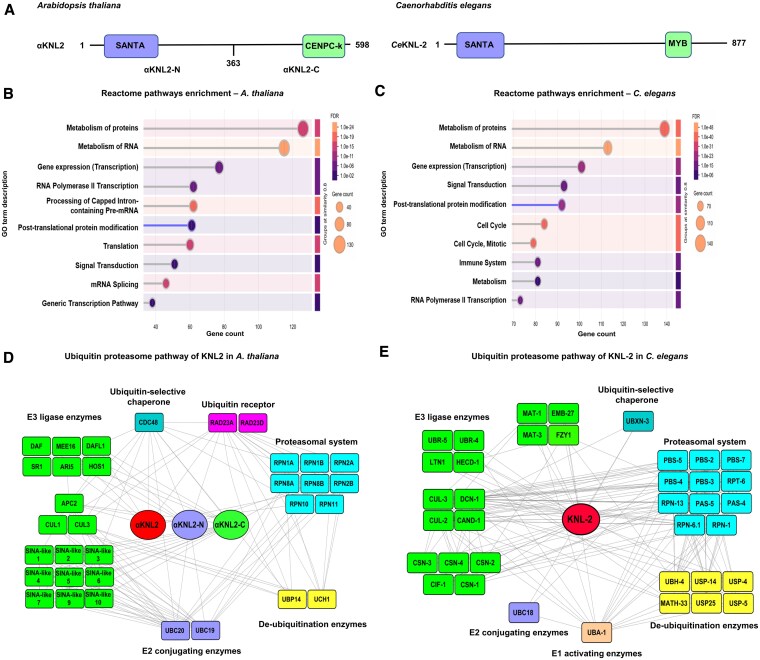
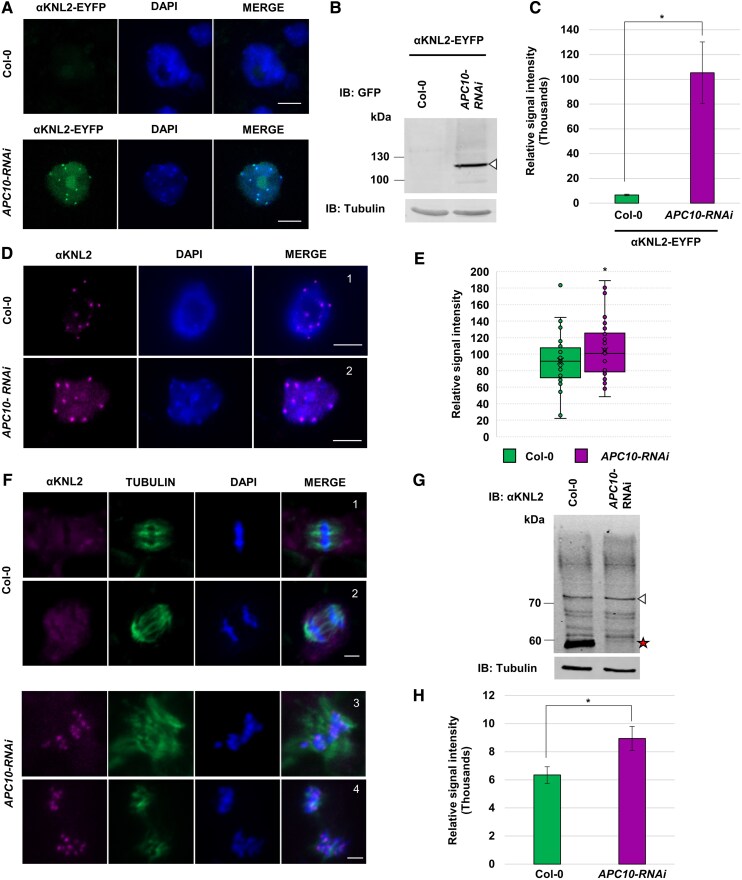
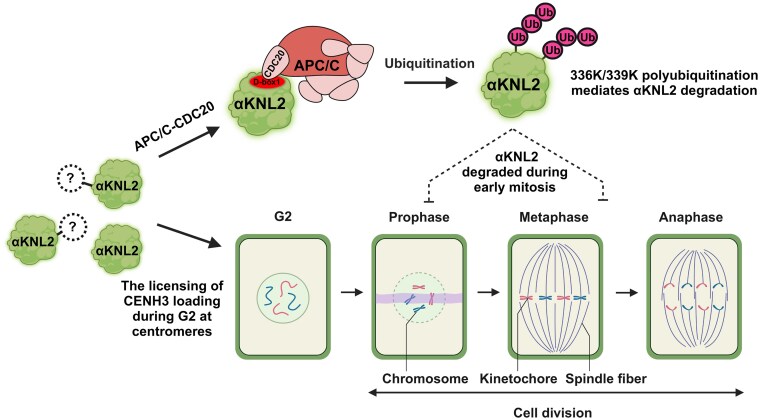
Kinetochores are large protein complexes that serve as attachment sites for spindle microtubules, ensuring proper chromosome segregation during cell division. KINETOCHORE NULL2 (αKNL2) is a key kinetochore protein required for the incorporation of the centromeric histone variant CENH3. The precise regulation of αKNL2 levels is crucial, but the molecular mechanisms controlling this process remain largely unexplored. In this study, we demonstrated that the Anaphase-Promoting Complex/Cyclosome (APC/C) mediates the ubiquitin-dependent proteolysis of αKNL2 during mitosis. Our findings revealed that αKNL2 accumulates in the presence of 26S proteasome inhibitors, and our yeast 2-hybrid and proteomic screens showed that proteins from the ubiquitin-proteasome pathway interact with KNL2 in Arabidopsis (Arabidopsis thaliana) and nematode (Caenorhabditis elegans). Arabidopsis αKNL2 directly interacts with Anaphase-Promoting Complex subunit 10 (APC10) and Cell Division Cycle 20.1 (CDC20.1), 2 substrate recognition components of the APC/C. RNAi-mediated depletion of APC/C resulted in the accumulation and mislocalization of endogenous αKNL2. Additionally, mutation or deletion of the D-box1 region, or substitution of residues K336 and K339, impaired αKNL2 degradation. The expression of a proteasome-resistant αKNL2 variant in planta caused severe defects in growth, fertility, and mitotic division. These findings show that APC/CCDC20-mediated degradation of αKNL2 is critical for proper kinetochore function and centromere integrity.


Conflict of interest statement

Conflict of interest statement. None declared.

Figures

Figure 1.
Figure 1.
Polyubiquitination and degradation of αKNL2 in vivo. A and B) Analysis of αKNL2 protein levels in N. benthamiana leaves transiently expressing αKNL2-EYFP in the presence of 26S proteasome inhibitors. A) Western blot analysis of total protein extracts from N. benthamiana leaves expressing αKNL2-EYFP, treated with DMSO (control), MG115, or bortezomib (100 µM each) 2 d postinfiltration. Anti-GFP antibodies were used for detection; leaves infiltrated with an EYFP-expressing vector served as a negative control. Tubulin was used as a loading control. The triangle symbol (▵) indicates the MW of αKNL2. B) Quantification of αKNL2 protein levels in different treatment groups. The ratio of αKNL2 versus tubulin expression was used for the measurement of the αKNL2 levels. Data are presented as means ± SEM (n = 3). Significant differences between groups were assessed using Welch's t-test and are indicated by ** (P < 0.05). C and D) Examination of αKNL2 protein levels in N. benthamiana leaves expressing αKNL2-EYFP in the presence of 26S proteasome and translational inhibitors. C) Western blot analysis of total protein extracts from leaves treated with DMSO (control) or CHX combined with either DMSO, MG115, or bortezomib (100 µM each) at 2 d postinfiltration. Detection was performed using anti-GFP antibodies; leaves infiltrated with an EYFP-expressing vector were used as a negative control. Tubulin served as a loading control. The triangle symbol (▵) indicates the MW of αKNL2. D) Quantification of αKNL2 protein levels over time across different treatment groups. The ratio of αKNL2 versus tubulin expression was used for the measurement of the αKNL2 levels. Data are presented as means ± SEM (n = 3). E) Ubiquitination assay of αKNL2 in N. benthamiana leaves expressing αKNL2-EYFP treated with bortezomib 2 d postinfiltration. Leaves expressing EYFP alone served as a control. Total protein extracts were subjected to IP using GFP magnetic agarose beads. Input samples were immunoblotted with anti-GFP (left panel), and immunoprecipitated samples were probed with anti-ubiquitin (Ub) (center panel) or anti-GFP (right panel). Tubulin served as a loading control. The triangle symbol (▵) indicates the MW of αKNL2, and the bracket marks the ubiquitinated form of αKNL2. IB, immunoblot; IP, immunoprecipitation.
Figure 2.
Figure 2.
Identification of KNL2 interaction partners reveals a link between KNL2 and ubiquitin-proteasome pathway in A. thaliana and C. elegans.  A) The domain organization of KNL2 in A. thaliana and C. elegans. In Arabidopsis, the full-length KNL2 protein (αKNL2; 1 to 598 amino acids), as well as its N-terminal (αKNL2-N; 1 to 363 amino acids) and C-terminal (αKNL2-C; 364 to 599 amino acids) fragments, was shown. The KNL2 contains 2 functional domains: the SANTA and CENPC-k motifs. In C. elegans, the full-length KNL2 protein (CeKNL-2; 1 to 877 amino acids) was shown, featuring both SANTA and MYB domains. B and C) The top 10 GO enrichment terms (Reactome pathways) of the KNL2 interactors in A. thaliana  B) and C. elegans  C). The graph displays the number of genes associated with each GO term (gene count) along with the corresponding enriched GO terms. Dot size indicates gene count, while color represents the false discovery rate, with lighter colors denoting higher significance. The GO term posttranslational protein modification was highlighted (violet). D and E) Interaction network illustrating the association of KNL2 with an ubiquitin-proteasome pathway in A. thaliana  D) and C. elegans  E). Proteins identified as interactors of KNL2 are categorized based on functional annotations. The nodes represent KNL2 interactors, and the edges between the nodes indicate interactions between the proteins. The node colors indicate the different functional groups of the ubiquitin-proteasome pathway. The network was constructed using STRING and Cytoscape programs.
Figure 3.
Figure 3.
Direct interaction of KNL2 with APC/C proteins. A) BiFC analysis showing the interactions between αKNL2/αKNL2-N/αKNL2-C fused to VENn and APC10/CDC20.1 fused to VENc. Venus fluorescence in the nucleus was shown in white dotted boxes. Scale bars represent 50 µm. The right panel displays an enlarged image of the corresponding BiFC signals in the nucleus, but may not always correspond to the exact nuclei shown in the overview panel. Scale bars represent 5 µm. B) Y2H assay testing interactions between αKNL2 (bait) and APC10/CDC20.1 (prey). Zygotes expressing both prey and bait were selected on -LT medium (double dropout: YNB without leucine and tryptophan). Protein–protein interactions were assessed on -LTH medium (TDO: YNB without leucine, tryptophan, and histidine). The strength of the protein–protein interactions was evaluated using a drop dilution assay. AD, activation domain; BD, binding domain. C) Co-IP interactions between αKNL2 and CDC20.1/APC10. N. benthamiana leaves were infiltrated with constructs containing CDC20.1-HA and αKNL2-C-cMYC (Lanes 1, 2), APC10-HA and αKNL2-C-cMYC (Lanes 3, 4), as well as HA and αKNL2-C-cMYC (Lanes 5, 6). Total protein extracts were precipitated with HA magnetic beads, and the samples were analyzed before (input) and after (IP) immunoprecipitation by immunoblotting with HA and c-MYC antibodies. The triangle (▵) marks the MW of CDC20.1, APC10, and empty control while the red arrowhead (▴) indicates the MW of αKNL2-C. IB, immunoblot; IP, immunoprecipitation. D) AlphaFold 3 prediction between C. elegans KNL-2 (blue) and MAT-3 or FZY-1 (yellow). The left panels present the predictions of the complexes formed between the protein pairs. Red boxes highlight the areas of interaction. The middle panels display heat maps of the interactions, with arrows indicating the specific sites of interaction. The right panels provide a close-up view of the red boxes in the left panels, highlighting the precise locations where the interaction is predicted. CeMAT-3 (weakly) is predicted to interact with one of the predicted APC/C-specific degron motifs (purple), whereas CeFZY-1 (strongly) predicted to interact with CeKNL-2.
Figure 4.
Figure 4.
αKNL2 is a target of the APC/C complex in A. thaliana.  A) Immunostaining of meristematic nuclei from APC10-RNAi lines and wild-type plants transformed with the αKNL2-EYFP construct using anti-GFP antibodies. Scale bars represent 5 µm. B and C) Analysis of αKNL2 protein levels in APC10-RNAi and wild-type plants expressing αKNL2-EYFP. B) Western blot analysis of nuclear protein extracts from APC10-RNAi and wild-type plants expressing αKNL2-EYFP, using an anti-GFP antibody. Tubulin was used as a loading control. The triangle symbol (▵) indicates the MW of αKNL2. C) Quantification of αKNL2 protein levels from B), with band intensities normalized to tubulin. Data are presented as mean values ± SEM (n = 3). Significant differences between groups were assessed using Welch's t-test and are marked by * (P < 0.5). D) Immunostaining of meristematic nuclei of Arabidopsis wild-type (1) and the APC10-RNAi lines (2) using anti-αKNL2 antibodies. Scale bars are 5 μm. E) Relative intensity measurements of αKNL2 signals on nuclei from APC10-RNAi and wild type. Boxplots show the distribution of fluorescence intensities (n = 35 per group). The centerline indicates the median, and box limits represent the upper and lower quartiles (Q1 and Q3); whiskers extend to 1.5× the interquartile range. Significant differences between groups were assessed using Welch's t-test and are indicated by * (P < 0.5). F) The mitotic localization of αKNL2 in root meristem tissues of wild-type (1,2) and APC10-RNAi (3,4) using αKNL2 antibodies (magenta). αKNL2 localizes to centromeres during mitosis in APC10-RNAi. DAPI-stained chromosomes are shown in blue, and anti-α-tubulin immunosignals are shown in green. (1, 3) metaphase; (2, 4) anaphase. Scale bars are 5 μm. G and H) Analysis of endogenous αKNL2 protein levels in wild type and APC10-RNAi. G) Western blot analysis of nuclear protein extracts from wild type, and APC10-RNAi lines, detected using αKNL2-specific antibody. Tubulin was used as a loading control. The white triangle (▵) indicates the MW of αKNL2, and the red star (★) denotes the absence of degradation products. H) Quantification of αKNL2 protein levels from G), with band intensities normalized to tubulin. Data are shown as mean values ± SEM (n = 3). Significant differences between groups were assessed using Welch's t-test and are indicated by * (P < 0.5).
Figure 5.
Figure 5.
The APC/C D-box1 region at the N-terminus is a functional degron of αKNL2. A) Schematic of the ubiquitination process involving E2 conjugation enzymes and E3 ligases, marking substrates with degrons for proteasomal degradation. B) Diagram of αKNL2 structure showing SBC, D-box1, and D-box2 degrons. C) WebLogo alignment showing conserved αKNL2 sequences (48 to 88 amino acids) in Brassicales, highlighting conserved SBC (VFTSS) and D-box1 (RGFL) domains (red asterisks). D) Superresolution SIM image showing colocalization of αKNL2ΔD-box1-EYFP fluorescence signals (green) with CENH3 (magenta) in N. benthamiana leaves. Scale bars represent 5 µm. E) The localization pattern of αKNL2ΔD-box1-EYFP in Arabidopsis root tips. Scale bars represent 10 µm. F) BiFC analysis shows no interaction between αKNL2ΔD-box1-VENn and CDC20.1-VENc (no fluorescence), while αKNL2ΔD-box2-VENn and CDC20.1-VENc show nuclear fluorescence. Scale bars represent 5 µm. G) Y2H assay shows interaction of αKNL2ΔD-box2 but not αKNL2ΔD-box1 with CDC20.1. Zygotes were selected on -LT medium (double dropout), and interactions were evaluated on -LTH medium (TDO) using a drop dilution assay. AD, activation domain; BD, binding domain. H) Western blot of proteins from plants expressing αKNL2ΔD-box1-EYFP, αKNL2ΔD-box2-EYFP, and αKNL2-EYFP treated with Apcin, detected with anti-GFP antibody. The triangle (▵) represents αKNL2 MW. I) Quantification of protein levels from H), normalized to tubulin, shown as mean ± SEM (n = 3). Significant differences between groups were assessed using Welch's t-test and are indicated by ** (P < 0.05).
Figure 6.
Figure 6.
αKNL2 ubiquitination sites and their role in protein stability. A) Model illustrating the ubiquitination process, where ubiquitin is transferred to lysine residues on a substrate after its interaction with the E2–E3 complex. B) Schematic representation of αKNL2 protein containing 3 conserved lysine (K) residues at positions 145, 161, and 184 (Mut-UBI1 site) and 6 conserved K residues at positions 336, 339, 342, 343, 347, and 348 (Mut-UBI2 site) that were substituted with arginine. C) The WebLogo show the relative frequency of each amino acid at both Mut-UBI sites based on the alignment of KNL2 homologs from Brassicales species. Asterisks indicate the positions of highly conserved KNL2 lysine residues. D) SIM image showing the colocalization of αKNL2Mut-UBI2-EYFP (green) with CENH3 (magenta) in N. benthamiana leaves, indicating centromere-specific signals. Scale bars represent 5 µm. E) Expression pattern of αKNL2Mut-UBI2-EYFP in Arabidopsis root tips. Scale bars represent 10 µm. F and G) Analysis of αKNL2 protein levels in N. benthamiana leaves transiently expressing ubiquitin site–mutagenized variants of αKNL2. F) Western blot analysis of total protein extracts from leaves expressing αKNL2Mut-UBI1-EYFP, αKNL2Mut-UBI2-EYFP, αKNL2K336R-EYFP, and αKNL2K339R-EYFP, using a monoclonal anti-GFP antibody. The triangle symbol (▵) denotes the MW of αKNL2. G) Quantification of αKNL2 protein levels among the different ubiquitin site–mutagenized constructs F). Protein levels were normalized to tubulin. Data are presented as mean ± SEM (n = 3). Significant differences are marked by lowercase letters based on ANOVA and Tukey's multiple comparison tests (P < 0.05). H) Ubiquitination assay of ubiquitin site–mutagenized αKNL2 variants. Total protein extracts from plants expressing αKNL2Mut-UBI1-EYFP, αKNL2Mut-UBI2-EYFP, αKNL2K336R-EYFP, and αKNL2K339R-EYFP, treated with bortezomib, were immunoprecipitated using a GFP trap. Input samples were immunoblotted with monoclonal anti-GFP antibody (left panel), while immunoprecipitated samples were probed with monoclonal antibodies against ubiquitin (Ub) (center panel) or GFP (right panel). Tubulin was used as a loading control. The triangle symbol (▵) (central and right panel) indicates the size of mutagenized αKNL2 in fusion with EYFP, and the bracket marks the ubiquitinated form of αKNL2 (middle panel). IB, immunoblot; IP, immunoprecipitation.
Figure 7.
Figure 7.
The phenotype of degradation-resistant αKNL2 lines. A) Root growth phenotype of 7-day-old Arabidopsis seedlings expressing the αKNL2ΔD-box1-EYFP and αKNL2-EYFP constructs. Scale bars represent 1 cm. B) Box plot illustrating the primary root length of wild-type, αKNL2-EYFP, and degradation-resistant lines of αKNL2 grown for 7 d on 0.5× MS medium containing 1% sucrose. Data represent 25 seedlings per construct. The centerline indicates the median, and box limits represent the upper and lower quartiles (Q1 and Q3); whiskers extend to 1.5× the interquartile range. Significant differences are indicated by lowercase letters according to ANOVA followed by Tukey's multiple comparison tests (P < 0.05). C) Mitotic metaphases and anaphases of wild-type and transgenic Arabidopsis plants expressing either αKNL2-EYFP or degradation-resistant αKNL2 variants, showing misaligned and lagging chromosomes (indicated by white arrows). Scale bars represent 5 µm. D) Quantification of abnormal metaphases and anaphases in plants expressing degradation-resistant αKNL2 variants, in comparison to wild-type and αKNL2-EYFP-expressing plants. For each variant, 30 metaphase and anaphase cells were examined. In lines expressing degradation-resistant αKNL2, 24% to 32% of metaphases were misaligned and 28% to 36% of anaphases exhibited bridged and/or lagging chromosomes. E) Silique size comparison between αKNL2ΔD-box1-EYFP- and αKNL2-EYFP-expressing plants (upper panel). Scale bars represent 1 cm. Scanning electron microscopy images of respective siliques are shown (lower panel). Scale bars represent 20 µm. F) Analysis of seed setting in Arabidopsis wild-type and transgenic plants expressing either αKNL2-EYFP or degradation-resistant αKNL2 variants. Box plot showing the average number of seeds per silique for 15 plants per construct, with 10 siliques analyzed per plant. The centerline indicates the median, while the box limits denote the lower (Q1) and upper (Q3) quartiles. Whiskers extend to 1.5× the interquartile range. Significant differences are marked by lowercase letters based on ANOVA and Tukey's multiple comparison tests (P < 0.05).
Figure 8.
Figure 8.
Model of APC/C-mediated ubiquitination and degradation of αKNL2 in Arabidopsis. When αKNL2 accumulates excessively, the APC/C E3 ubiquitin ligase, activated by E1 and E2 enzymes, targets it through the D-box1 motif (shown in red). This recognition triggers polyubiquitination at lysine residues 336 and 339, directing the protein to proteasomal degradation (upper part). αKNL2 is shown in green, while white circles with question marks indicate unknown regulatory mechanisms. Ubiquitin molecules are depicted as dark pink circles labeled “Ub,” and the APC/C–CDC20 complex is shown in light red-pink. During early mitosis, αKNL2 is also degraded through the APC/C–CDC20 pathway (dashed inhibitory arrows), ensuring proper SAC function and promoting cell cycle progression (lower part). This model was created using BioRender.com.

References

    1. Abramson J, Adler J, Dunger J, Evans R, Green T, Pritzel A, Ronneberger O, Willmore L, Ballard AJ, Bambrick J, et al. Accurate structure prediction of biomolecular interactions with AlphaFold 3. Nature. 2024:636:E4. 10.1038/s41586-024-08416-7 - DOI - PMC - PubMed
    1. Ahmadli U, Kalidass M, Khaitova LC, Fuchs J, Cuacos M, Demidov D, Zuo S, Pecinkova J, Mascher M, Ingouff M, et al. High temperature increases centromere-mediated genome elimination frequency and enhances haploid induction in Arabidopsis. Plant Commun. 2023:4(3):100507. 10.1016/j.xplc.2022.100507 - DOI - PMC - PubMed
    1. Amato A, Schillaci T, Lentini L, Di Leonardo A. CENPA overexpression promotes genome instability in pRb-depleted human cells. Mol Cancer. 2009:8(1):1–14. 10.1186/1476-4598-8-119 - DOI - PMC - PubMed
    1. Antosz W, Pfab A, Ehrnsberger HF, Holzinger P, Köllen K, Mortensen SA, Bruckmann A, Schubert T, Längst G, Griesenbeck J, et al. The composition of the Arabidopsis RNA polymerase II transcript elongation complex reveals the interplay between elongation and mRNA processing factors. Plant Cell. 2017:29(4):854–870. 10.1105/tpc.16.00735 - DOI - PMC - PubMed
    1. Arribere JA, Bell RT, Fu BX, Artiles KL, Hartman PS, Fire AZ. Efficient marker-free recovery of custom genetic modifications with CRISPR/Cas9 in Caenorhabditis elegans. Genetics. 2014:198(3):837–846. 10.1534/genetics.114.169730 - DOI - PMC - PubMed

MeSH terms

LinkOut - more resources