. 2025 Aug 26;9(16):4306-4310.
doi: 10.1182/bloodadvances.2025016480.

Blood-derived cell-free DNA is a superior biomarker for noninvasive DNA methylation profiling in multiple myeloma

Affiliations

Blood-derived cell-free DNA is a superior biomarker for noninvasive DNA methylation profiling in multiple myeloma

Robbe Heestermans et al. Blood Adv. .
No abstract available


Conflict of interest statement

Conflict-of-interest disclosure: The authors declare no competing financial interests.

Figures

None
Graphical abstract
Figure 1.
Figure 1.
Characteristics of circulating biomarker DNA methylation profiles in MM. (A) Absolute number of CGIs that are assigned to a methylation level category as indicated by the color code in the right-side legend. Dark red indicates a highly methylated state (>80%), whereas the lightest color indicates the lowest methylation state (<20%). For BM-DNA, PBMNC-DNA, CTC-DNA, and cfDNA, each bar represents 1 patient with MM (n = 11). For control gDNA and control cfDNA, each bar represents 1 healthy individual (n = 4). (B) Principal component analysis of the methylation data from patient and control DNA samples. Control gDNA samples are indicated with red squares and control cfDNA samples with red triangles. For samples from patients with MM, BM-DNA samples are depicted as blue diamonds, PBMNC-DNA samples as blue squares, cfDNA samples as blue triangles, and CTC-DNA samples with a blue asterisk.
Figure 2.
Figure 2.
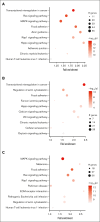
Pathway enrichment analysis of differentially methylated genes. Results from the pathway enrichment analysis performed on the total data set of DMRs identified in MM samples compared to healthy control gDNA (A); and the DMRs with a cross-sample mean methylation value that indicates hypermethylation (B) and hypomethylation (C). The bubble plots depict the top 10 significantly enriched KEGG terms for each of the analyzed data sets. Diameter and color intensity of the circles are relative to the number of involved genes and the significance of the obtained enrichment score, respectively.

References

    1. Walker BA, Boyle EM, Wardell CP, et al. Mutational spectrum, copy number changes, and outcome: results of a sequencing study of patients with newly diagnosed myeloma. J Clin Oncol. 2015;33(33):3911–3920. - PMC - PubMed
    1. Walker BA, Wardell CP, Chiecchio L, et al. Aberrant global methylation patterns affect the molecular pathogenesis and prognosis of multiple myeloma. Blood. 2011;117(2):553–562. - PubMed
    1. Kortüm KM, Mai EK, Hanafiah NH, et al. Targeted sequencing of refractory myeloma reveals a high incidence of mutations in CRBN and Ras pathway genes. Blood. 2016;128(9):1226–1233. - PMC - PubMed
    1. Muylaert C, Van Hemelrijck LA, Maes A, et al. Aberrant DNA methylation in multiple myeloma: a major obstacle or an opportunity? Front Oncol. 2022;12 - PMC - PubMed
    1. Haertle L, Barrio S, Munawar U, et al. Single-nucleotide variants and epimutations induce proteasome inhibitor resistance in multiple myeloma. Clin Cancer Res. 2023;29(1):279–288. - PubMed