. 2025 Jul:117:105814.
doi: 10.1016/j.ebiom.2025.105814. Epub 2025 Jun 24.

Integrated proteomic and targeted Next Generation Sequencing reveal relevant heterogeneity in lower-grade meningioma and ANXA3 as a new target in NF2 mutated meningiomas

Affiliations

Integrated proteomic and targeted Next Generation Sequencing reveal relevant heterogeneity in lower-grade meningioma and ANXA3 as a new target in NF2 mutated meningiomas

Maryam Shah et al. EBioMedicine. 2025 Jul.

Abstract

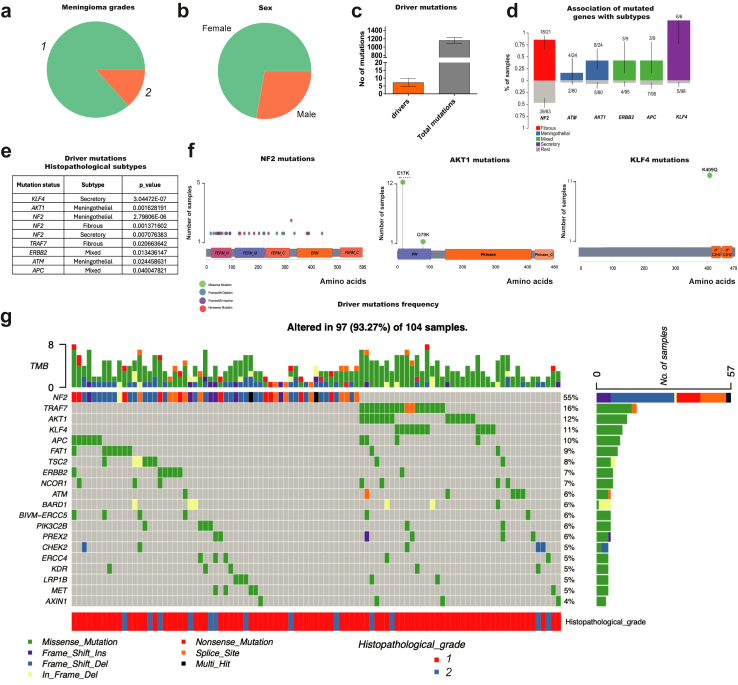
Background: Meningiomas, the most common primary brain tumours, are classified by the World Health Organization (WHO) into grades 1, 2, and 3. Some grade 1 tumours exhibit increased clinical aggressiveness, with the biallelic mutation of NF2 being the most frequently reported.

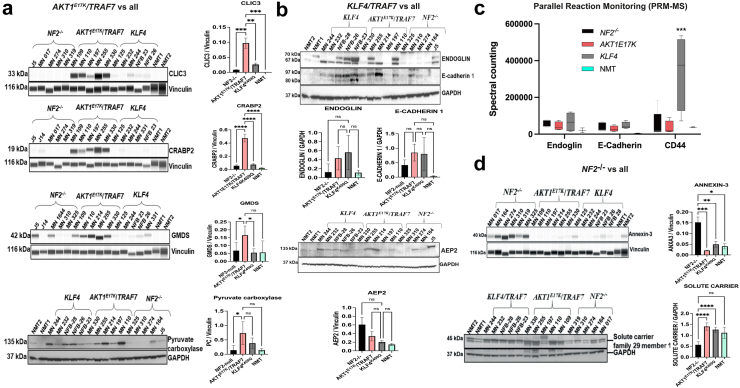
Methods: In our study, we analysed the most common driver mutations (NF2, AKT1, KLF4, and TRAF7) in meningioma by genomics describing co-occurrences and new mutations. Furthermore, tumour tissue bearing the driver mutations was analysed by proteomics. The relevance of the specific target found in the most common driver mutation in meningiomas (NF2) was validated in vitro using both lower and higher-grade meningioma and further, the higher-grade meningioma was analysed in vivo using an NOD scid gamma (NSG) mouse model.

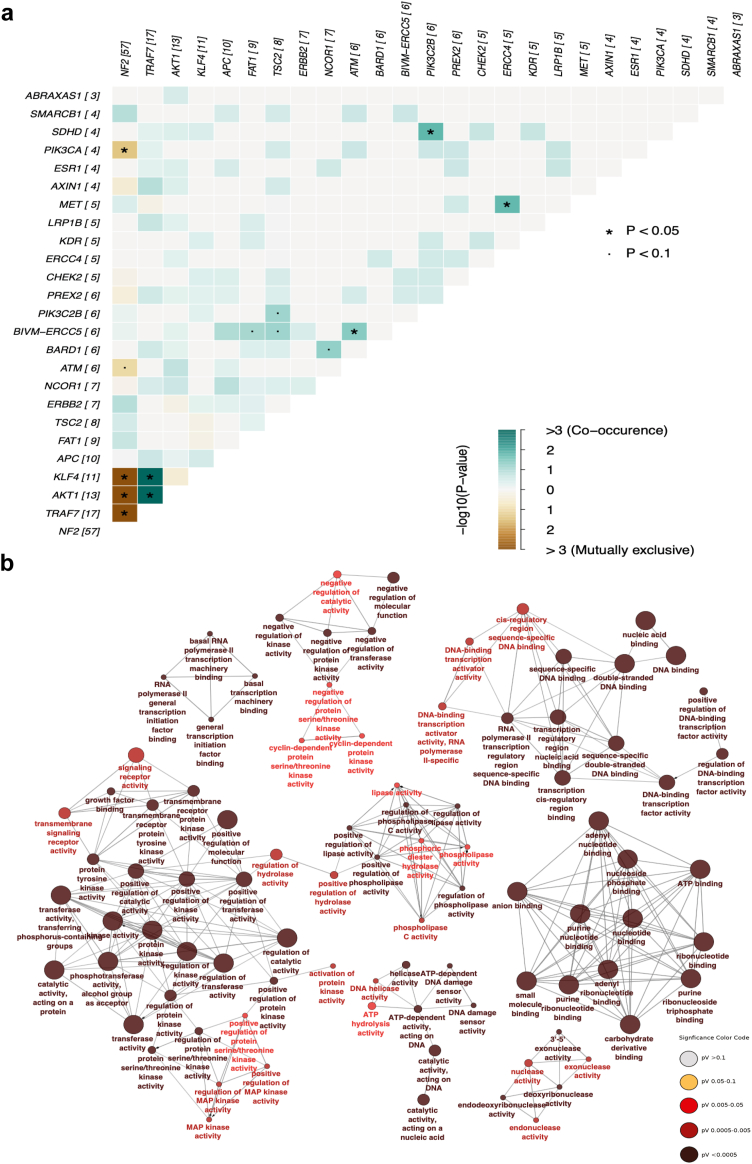
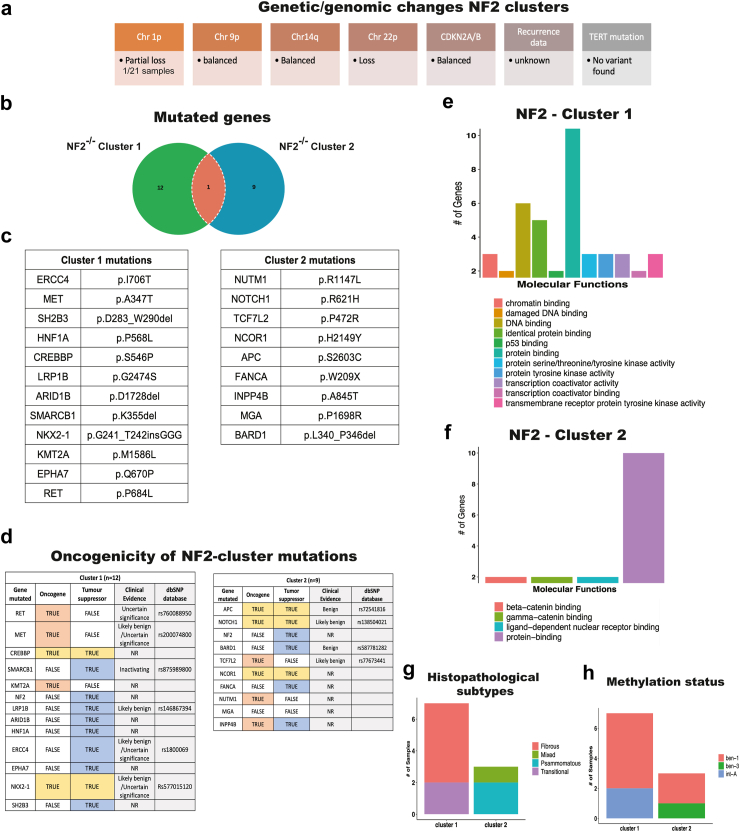
Findings: Our genomic data revealed co-occurrences of non-NF2 mutations in lower-grade meningiomas, suggesting synergistic effects supporting tumour growth. NF2-/- meningiomas showed distinct proteomic clustering, with different mutations found in these clusters. Additionally, proteomics identified Annexin-3 (ANXA3) upregulated in NF2-/- meningioma. Its role in proliferation was confirmed in grade 1 and subsequently grade 3 tumours in vitro and with abolished growth when knocked down in a meningioma mouse model.

Interpretation: These findings highlight new targets in different meningioma backgrounds, presenting ANXA3 as a potential therapeutic target for meningioma treatment.

Funding: This work was funded by the Brain Tumour Centre of Excellence.

Keywords: AKT1; ANXA3; KLF4; Meningioma; NF2; TRAF7.


Conflict of interest statement

Declaration of interests The authors declare no competing interest. COH in 2022 received consulting fees from Recursion pharma. COH is member of the International Consortium of Meningioma. This is an academic consortium.

Figures

Fig. 1
Fig. 1
Histopathological features and driver mutations frequency. A total of 118 samples of meningioma tumours were collected, and samples were processed for DNA extraction and further analysis. a) Distribution of the population into meningioma grades, b) sex, c) number of driver mutations (0.58%) compared to the total mutations found in the population analysed. d) ClinicalEnrichment showing the classification of the histopathological subtypes based on the driver mutations. e) Histopathological subtypes for AKT1E17K, KLF4K409Q, TRAF7, and NF2−/− mutations. f) Schematic diagram showing the distribution of mutations on the genes NF2, AKT1, and KLF4. g) Driver mutation frequency, histopathological subtypes, and the classification of the type of genetic modification found. TMB = tumour mutation burden. ClinicalEnrichment tool in maftools utilised Fisher's exact test with p-values adjusted for multiple testing by a Benjamini–Hochberg FDR at 1% to perform both pairwise and groupwise comparisons for d) and e), identifying association between genes and clinical subtype. Associations with a p-value < 0.05 was considered significant. The error bars represent the 95% confidence interval of binomial ratios while the bars are annotated with the number relative to the total number of samples.
Fig. 2
Fig. 2
Driver mutation co-occurrence and molecular functions. a) Significantly mutually exclusive and co-occurring genes were identified using somatic interaction function in maftools (R package). The function applied pair-wise Fisher's Exact test with p-values adjusted for multiple testing by a Benjamini–Hochberg FDR at 1% to identify significant gene pairs and is represented as ∗p < 0.05 and ·p < 0.1 inside the squares. The numbers shown in brackets beside each gene indicate the number of samples in which a particular gene has been mutated. Green shows co-occurrence and brown is mutually exclusive. b) Further, gene enrichment analysis was conducted to explore the interactions between mutated driver genes and molecular functions using ClueGO v2.5.10, a Cytoscape tool. ClueGo employed a Two-sided hypergeometric statistical test to identify significant molecular functions enriched in dataset, with p-value cutoff 0.05 adjusted by Bonferroni step down method and Kappa Score Threshold 0.6. The node size represents the number of genes and the colour the level of significance.
Fig. 3
Fig. 3
Tissue proteomics from tumour-derived driver mutations. Tumour tissue from samples holding AKT1E17K/TRAF7, KLF4K409Q/TRAF7, and NF2−/− mutations were processed for mass spectrometry analysis and compared to normal meningeal tissue. a) Heatmap showing the differential expression profile for each meningioma background and the proteome clustering of the samples. Red squares show the NF2−/− samples clustering into two subgroups. b–e) Venn diagrams representing each genetic background showing up and down-regulated proteins and their overlap in the middle (bold) with all data sets. f–h) Top 5 proteins up and down-regulated (if there are) for each genetic background overlapping with all data sets. Differentially expressed proteins for hierarchical clustering were obtained by submitting relative expression profiles to Perseus and performing an ANOVA (p-value < 0.05) on data imputation.
Fig. 4
Fig. 4
Proteomic validation of up-regulated targets. The same tumour tissue samples used for the proteomic assay were used for validation of the up-regulated targets by Western blot, Simple Wes, and PRM-MS. a) Tumours holding AKT1E17K/TRAF7 genetic background (5 samples) were evaluated for four up-regulated targets: CLIC3, CRABP2, GMDS, and Pyruvate Carboxylase (PC) by Simple Wes and Western blot and b) Tumours with KLF4K409Q/TRAF7 genetic background (5 samples) were used for validation by Western blot using three up-regulated targets: Endoglin, E-cadherin, and Anion exchange protein 2, c) Parallel Reaction Monitoring-Mass Spectrometry (PRM-MS) was carried out on an independent set of samples (5 NF2−/−, 4 KLF4K409Q/TRAF7, 4 AKT1E17K/TRAF7, and 2 NMT samples) for further validation of Endoglin, E-Cadherin, and CD44 expression and compared to all samples. d)NF2−/− tumours (5 NF2−/− samples) were evaluated by Simple Wes and Western blot for two up-regulated targets: ANXA3 and Solute carrier family 29 member 1 blot. NMT = normal meningeal tissue, Endoglin and E-cadherin 1 were normalised by the same GAPDH. Experiments were carried out in three independent experiments. One-Way ANOVA with Dunnett's multiple comparisons test with simple pooled variance was employed for experiments with more than two samples assuming normal distribution, alongside non-parametric tests (Friedman's test) if data is not normal. Significance levels will be indicated by ∗ < 0.05, ∗∗ < 0.01, ∗∗∗ < 0.001, and ∗∗∗∗ < 0.0001.
Fig. 5
Fig. 5
NF2 splits into two subgroups. The proteomic analysis and hierarchal characterisation generated two clusters for NF2−/− samples, a) further genetic/genomic analysis was done on samples into these two groups. b) Ven diagram showing the number of mutated genes in NF2-clusters 1 and 2. c) Mutations presented by NF2-Cluster 1 (7 samples) and NF2-Cluster 2 (3 samples). d) Oncogenicity analysis of the NF2-clusters 1 and 2 showing mutated genes on oncogenes (orange), tumour suppressors (blue) and both (yellow). Clinical evidence is provided and the access number of the references from the dbSNP database (https://www.ncbi.nlm.nih.gov/snp/) is shown (NR = not reported). Genes found in both clusters were submitted to molecular function characterisation for specific molecular functions affected by these mutations: e) NF2-Cluster 1 and f) NF2-Cluster 2. The number of genes within each molecular function is shown. g) Histopathological subtype stratification and h) Methylation status for NF2-clusters.
Fig. 6
Fig. 6
NF2-deficient tumour-derived cells require ANXA3 for proliferation. ANXA3 KD constructions were designed into lentivirus and the efficiency of KD was tested in Ben-men-1 immortalised cell line. a) Ben-men-1 ANXA3 KD using three constructions 622, 695, and 751 the protein loading was normalised with vinculin for ANXA3 expression. The same constructions were tested for MCM2 expression and b) proliferation assay quantified by microscopy showing the % of Edu positive cells. c) ANXA3 KD in NF2−/− tumour-derived primary meningioma cells with the quantification of ANXA3 normalised by vinculin and the evaluation of the proliferation marker MCM2. d) EdU proliferation assay showing the microscopy and % of EdU-positive cells. e) Inhibition of MAPK pathway via phosphorylation of ERK1/2 was evaluated in ANXA3 KD tumour-derived primary meningioma cells. Experiments were carried out in three independent experiments. One-way ANOVA with Dunnett's multiple comparisons test with simple pooled variance was employed for experiments with more than two samples assuming normal distribution, alongside non-parametric tests (Friedman's test) if data is not normal. Significance levels will be indicated by ∗ < 0.05, ∗∗ < 0.01, and ∗∗∗ < 0.001. Annexin expression measured as a double band at 36 and 33 KDa.
Fig. 7
Fig. 7
ANXA3 KD in vivo reduces tumour growth in higher grades meningiomas. a) Tumour tissue from meningioma grades 1, 2, and 3 was used for a) ANXA3 expression among grades followed by normalisation by vinculin. b) ANXA3 KD in NCH93 GFP-LUC2 NF2−/− grade 3 immortalised cells over-expressing GFP with the quantification of ANXA3 and the evaluation of the proliferation marker MCM2 normalised by GAPDH in the same blot. c) EdU proliferation assay showing the microscopy and % of EdU-positive cells. Experiments were carried out in three independent experiments. d) Representative bioluminescence images of NSG mice engrafted with SCR (top panel) and ANXA3 KD (bottom panel) NCH93 GFP-LUC2 cells, 29 days post-surgery, with luciferase signal directly correlating to tumour size. e) Representative fluorescent images overlaid on the skull convexity, showing the ex vivo GFP signal from tumour cells (days post-surgery indicated in the bottom right panel). f) Quantification of tumour growth represented as fold-increase in bioluminescence normalised to 5d post-surgery. A total of 10 animals with SCR cells and 8 animals with shANXA3 cells were used in 2 independent experiments and the cell growth was monitored up to 29 days post-surgery. Representative images of 3 animals showing the biggest (NSG3, 11), middle size (NSG5, 12), and smallest tumours (NSG6, 14) in the experiment for SCR and shANXA3, respectively. Scale bars show maximum and minimum luminescence and GFP signals, all images were set to the same scale. Statistical significance was assessed using unpaired two-tailed t-tests for two-sample comparisons assuming normal distribution. Significance levels will be indicated by ∗ < 0.05 and ∗∗ < 0.01. Annexin expression was measured as a double band at 36 and 33 KDa.

References

    1. Maggio I., Franceschi E., Tosoni A., et al. Meningioma: not always a benign tumor. A review of advances in the treatment of meningiomas. CNS Oncol. 2021;10 - PMC - PubMed
    1. Louis D.N., Perry A., Wesseling P., et al. The 2021 WHO classification of tumors of the central nervous system: a summary. Neuro Oncol. 2021;23:1231–1251. - PMC - PubMed
    1. Sahm F., Schrimpf D., Stichel D., et al. DNA methylation-based classification and grading system for meningioma: a multicentre, retrospective analysis. Lancet Oncol. 2017;18:682–694. - PubMed
    1. Berghoff A.S., Hielscher T., Ricken G., et al. Prognostic impact of genetic alterations and methylation classes in meningioma. Brain Pathol. 2022;32 - PMC - PubMed
    1. Parada C.A., Osbun J.W., Busald T., et al. Phosphoproteomic and kinomic signature of clinically aggressive grade I (1.5) meningiomas reveals Rb1 signaling as a novel mediator and biomarker. Clin Cancer Res. 2020;26:193–205. - PubMed

MeSH terms

LinkOut - more resources