. 2025 Jun 25;16(1):5384.
doi: 10.1038/s41467-025-60855-6.

Polyglutamylation of microtubules drives neuronal remodeling

Affiliations

Polyglutamylation of microtubules drives neuronal remodeling

Antoneta Gavoci et al. Nat Commun. .

Abstract

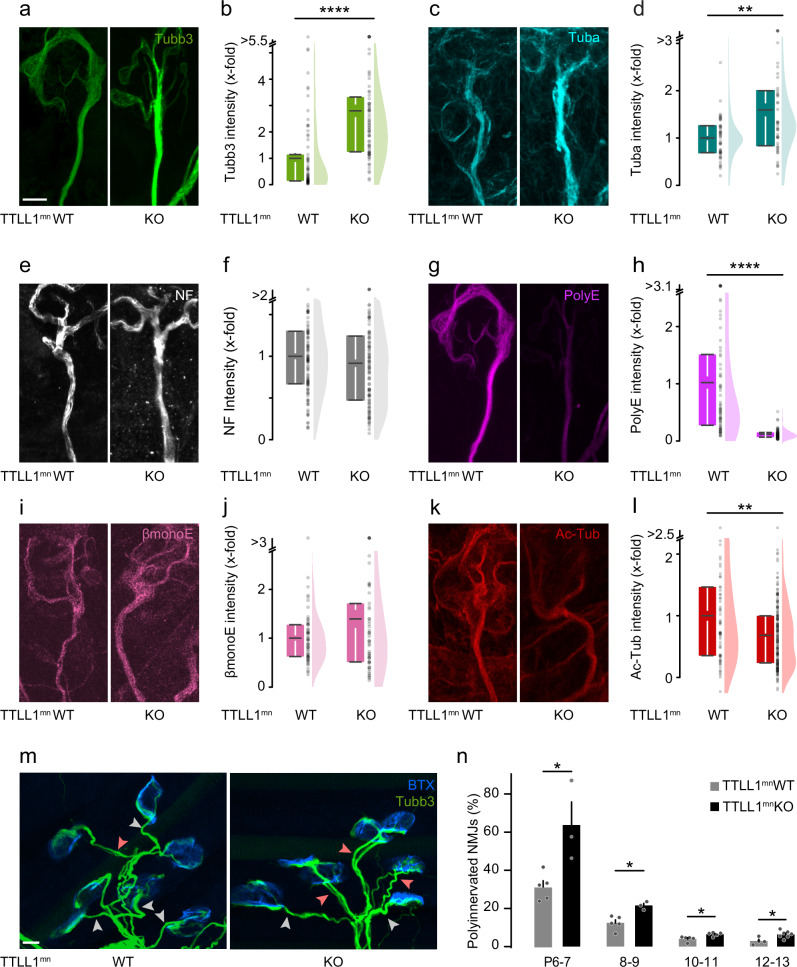
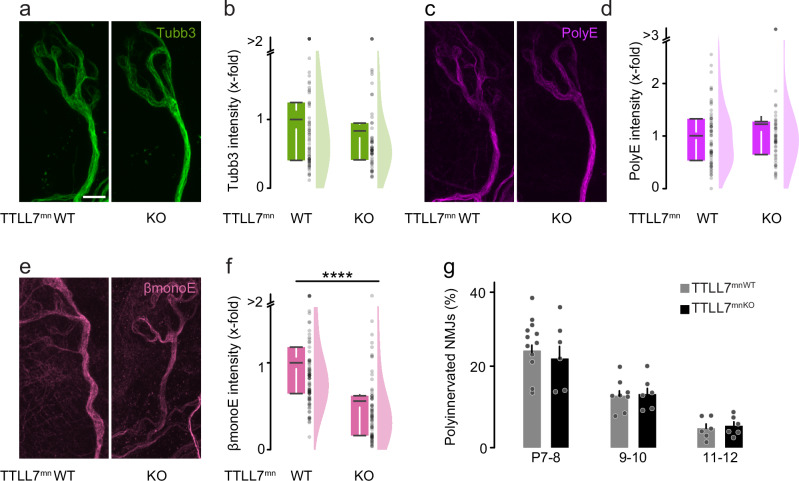
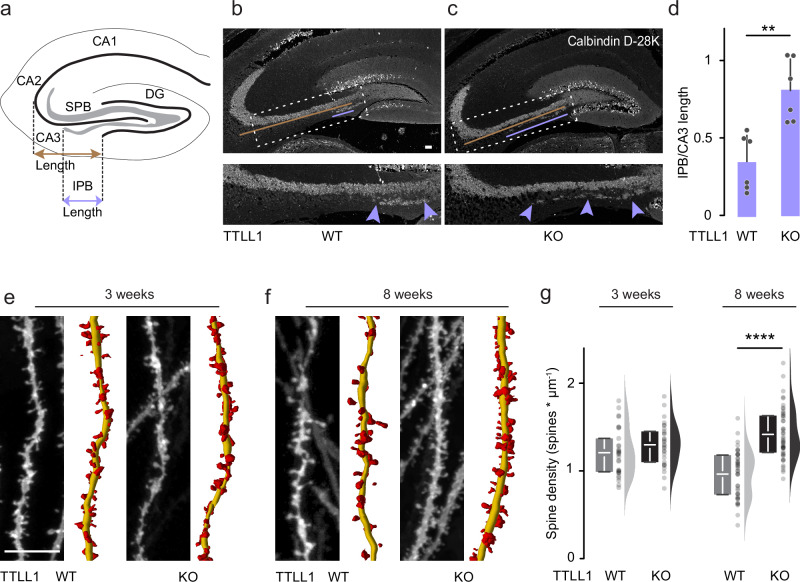
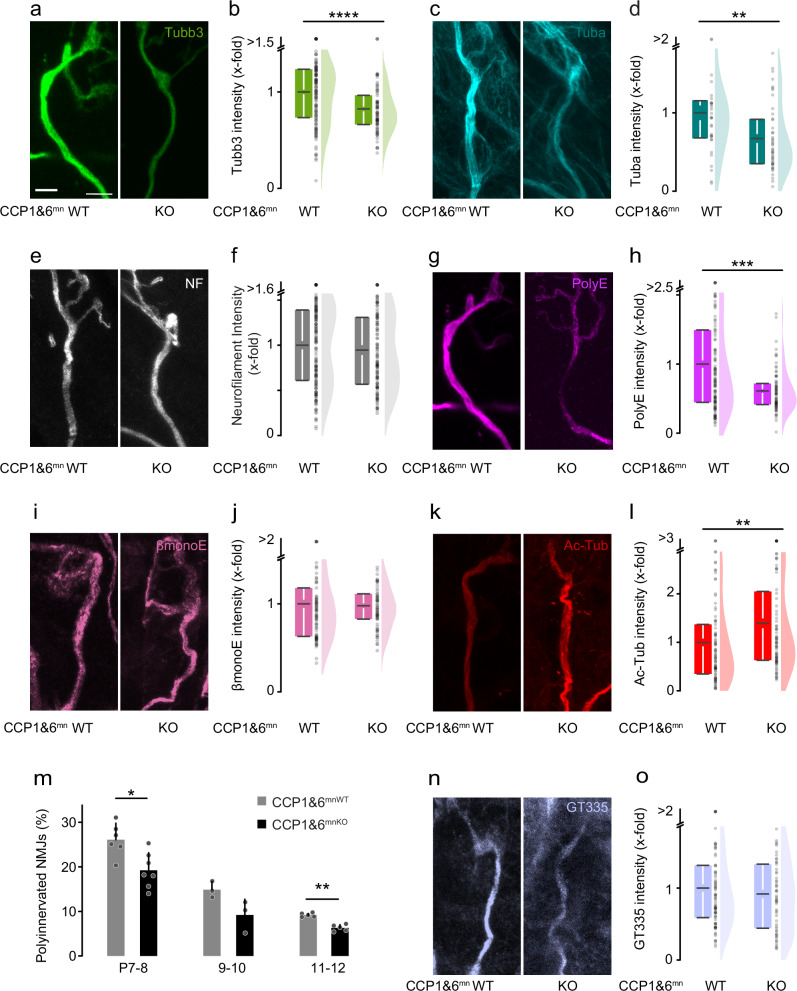
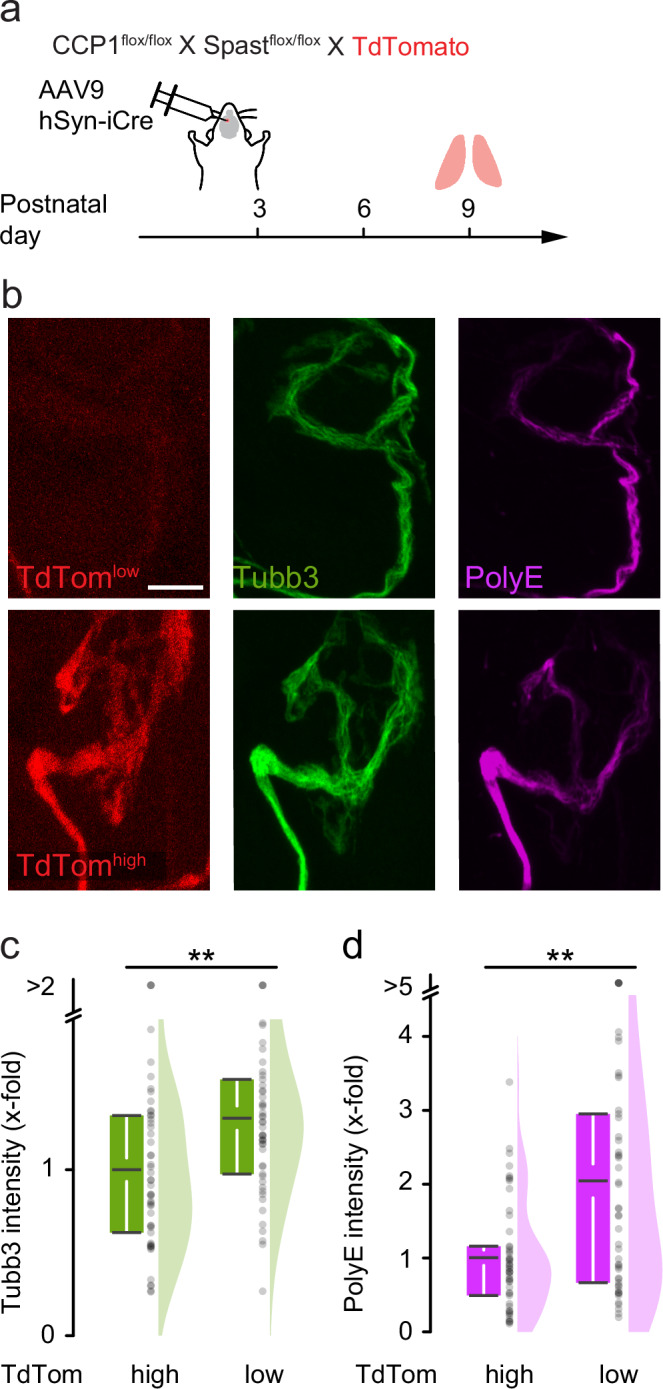
Developmental remodeling shapes neural circuits via activity-dependent pruning of synapses and axons. Regulation of the cytoskeleton is critical for this process, as microtubule loss via enzymatic severing is an early step of pruning across many circuits and species. However, how microtubule-severing enzymes, such as spastin, are activated in specific neuronal compartments remains unknown. Here, we reveal that polyglutamylation, a post-translational tubulin modification enriched in neurons, plays an instructive role in developmental remodeling by tagging microtubules for severing. Motor neuron-specific gene deletion of enzymes that add or remove tubulin polyglutamylation-TTLL glutamylases vs. CCP deglutamylases-accelerates or delays neuromuscular synapse remodeling in a neurotransmission-dependent manner. This mechanism is not specific to peripheral synapses but also operates in central circuits, e.g., the hippocampus. Thus, tubulin polyglutamylation acts as a cytoskeletal rheostat of remodeling that shapes neuronal morphology and connectivity.


Conflict of interest statement

Competing interests: The authors declare no competing interests.

Figures

Fig. 1
Fig. 1. Motor neuron transcriptome during postnatal remodeling.
a Strategy to isolate and sequence motor neuron-specific mRNA from ChAT-Cre mice crossbred to Rpl22HA. HA-tagged ribosomes (orange) and associated mRNA (cyan) were immunoprecipitated from spinal cords at different developmental time points (postnatal day, P5, 7, 9, 11, 14) and sequenced. b Confocal image stacks of longitudinal spinal cord sections of 8-week-old ChAT-Cre X Rpl22HA mice immunostained for choline acetyltransferase (ChAT, gray) and hemagglutinin (HA, orange), merged channels on the left (n = 3 mice). c Schematic illustration of tubulin post-translational modifications investigated in this study. Microtubules consist of alpha (α) and beta (β) tubulin dimers (gray), which may carry modifications in their luminal face (acetyl, red) or on their C-terminal tails (monoglutamate, pink; polyglutamate, magenta). Elongator TTLL glutamylases (turquoise) extend glutamyl side chains (polyglutamate, magenta); initiator TTLL glutamylases (gold) catalyze the addition of the first glutamate (monoglutamate, pink) to tubulin C-terminal tails; CCP deglutamylases (purple) remove glutamate residues. df Normalized mRNA read counts of (d) elongator TTLL glutamylases, (e) initiator TTLL glutamylases, and (f) CCP deglutamylases in motor neurons at postnatal day (P) 5, 7, 9, 11, 14 (n = 3 mice per age group). Graphs: Mean ± SEM. Scale bar, 25 µm.
Fig. 2
Fig. 2. Genetic ablation of TTLL1 delays motor axon remodeling.
ak Quantitative immunostainings for microtubule markers and neurofilament heavy polypeptide on triangularis sterni muscles at postnatal day (P) 8–12 from TTLL1mnKO vs. TTLL1mnWT littermate controls. Confocal stacks of terminal axons leading to NMJs depicting immunostainings against (a) tubulin beta-3 (Tubb3, green), (c) alpha-tubulin (Tuba, cyan), (e) neurofilament (NF, white), (g) polyglutamate chains (PolyE, magenta), (i) monoglutamate on beta-tubulin (βmonoE, pink), and (k) acetylated tubulin (Ac-Tub, red). bl Corresponding quantifications of immunostaining intensities in TTLL1mnKO terminal motor axons (right; relative to TTLL1mnWT, left, which is set to 1). b Tubb3, normalized to NF (WT n = 70 axons, 3 mice; KO n = 72 axons, 3 mice, p-value = 7,04949E-13). d Tuba normalized to NF (WT n = 46 axons, 3 mice; KO n = 50 axons, 4 mice, p-value = 0.0036). f NF (WT n = 108 axons, 7 mice; KO n = 100 axons, 6 mice). h polyE normalized to Tubb3 (WT n = 70 axons, 3 mice; KO n = 72 axons, 3 mice, p-value = 1,23212E-24). j βmonoE, normalized to Tubb3 (WT n = 58 axons, 3 mice; KO n = 54 axons, 3 mice). l ac-tub, normalized to Tubb3 NF (WT n = 68 axons, 4 mice; KO n = 177 axons, 8 mice, p-value = 0.00546). m Confocal stacks showing NMJs of P12 TTLL1mnKO and TTLL1mnWT littermates crossbred to Thy1-YFP or stained for Tubb3 (green; BTX, blue), depict singly (gray arrowheads) and polyinnervated synapses (light red arrowheads). n Percentage of polyinnervated NMJs in TTLL1mnWT vs. TTLL1mnKO littermates at postnatal day (P) 6-7, 8-9, 10-11, 12-13. (P6-7 WT n = 5, KO n = 3, p-value = 0.0357; P8-9 WT n = 5, KO n = 3, p-value = 0.0357; P10-11 WT n = 5, KO n = 5 mice, p-value = 0.0159, WT n = 4, KO n = 7, p-value = 0.0242; ≥ 197 NMJs per animal). Graphs: 25− 75% quantiles shown as a box with top and bottom black lines, mean as middle black line, and SEM as white lines (left); data representing single axons as dots (middle); half violin (right) in (b, d, f, h, j, l) or mean + SEM, with data representing single animals as dots in (n). A two-sided Mann-Whitney test determined significance: *, P < 0.05; **, P < 0.01; ****, P < 0.0001. Scale bar in (a) 5 µm also applies to (c, e, g, i, k), in (m) 10 µm. Source data are provided as a Source Data file.
Fig. 3
Fig. 3. Genetic ablation of TTLL7 does not affect peripheral pruning.
af Quantitative immunostainings for microtubule markers and neurofilament heavy polypeptide on triangularis sterni muscles at P9 from TTLL7mnKO vs. TTLL7mnWT littermate controls. Confocal stack of a terminal axon leading to an NMJ showing (a) tubulin beta-3 staining (Tubb3, green), (c) polyglutamate chain staining (PolyE, magenta; same NMJ as in (a) and (e) beta-tubulin staining (βmonoE, pink). Corresponding quantifications of immunostaining intensities in TTLL7mnKO terminal motor axons (right; relative to TTLL7mnWT, left, which is set to 1) of: (b) Tubb3, normalized to neurofilament heavy polypeptide (WT n = 65 axons, 5 mice, KO n = 55 axons, 4 mice), (d) polyE intensity, normalized to tubulin beta-3 (WT n = 65 axons, 5 mice, KO n = 55 axons, 4 mice) and (f) βmonoE, normalized to tubulin beta-3 (WT n = 94 axons, 4 mice, KO n = 76 axons, 4 mice, p-value = 2,73259E-11). g Percentage of polyinnervated NMJs in TTLL7mnWT vs. TTLL7mnKO littermates crossbred to Thy1-YFP or stained for Tubb3 (green; BTX, blue) at postnatal day (P)7-8, 9-10, and 11-12 (P7-8 WT n = 12, KO n = 6; P9-10 WT n = 8, KO n = 6; P11-12 WT n = 6, KO  6 mice; ≥96 NMJs per animal). Graphs: 25−75% quantiles shown as a box with top and bottom black lines, mean as middle black line, and SEM as white lines (left); data representing single axons as dots (middle); half violin (right) in (b, d, f) or mean + SEM, with data representing animals as dots in (g). A two-sided Mann-Whitney test determined significance: ****, P < 0.0001. Scale bar, 5 µm in (a), applies also to (c) and (e). Source data are provided as a Source Data file.
Fig. 4
Fig. 4. TTL1KO leads to pruning defects in the CNS.
a Schematic of the hippocampus showing the infrapyramidal bundle (IPB, gray), the suprapyramidal main bundle (SPB, gray), the dentate gyrus (DG), as well as the CA1, CA2, CA3 regions; the violet line indicates IPB length and the brown line CA3 length, as used in quantification in (d). b, c Confocal stacks of coronal brain sections of 8-week-old TTLL1WT vs. TTLL1KO littermates immunostained for calbindin D-28k (white). The expansion of the dashed box shows IPB length at higher magnification (violet arrowheads); the violet line indicates IPB length, and the brown line CA3 length. d Quantification of IPB length normalized to CA3 length in 8-week-old TTLL1WT vs. TTLL1KO littermates (n = 6 hemispheres, 3 mice per genotype, p-value = 0.0022). e, f Confocal stacks of brain slices of TTLL1WT and TTLL1KO mice depicting Dil-labeled dendritic spines of hippocampal granule cells at (e) 3 (P21) and (f) 8 weeks (P56) of age. The right side panels illustrate spine reconstructions (dendrites, yellow; spines, red). g Quantification of dendritic spine density in TTLL1WT vs. TTLL1KO at 3 weeks (WT n = 30 dendrites, 3 mice, KO n = 30 dendrites, 3 mice, ≥8 dendrites per mouse, p-value = 0.1149) and 8 weeks (WT n = 55 dendrites, 4 mice, KO n = 48 dendrites, 4 mice, ≥9 dendrites per mouse, p-value = <0.0001). Graphs: mean + SEM and data represent hemispheres as single dots in (d); 25−75% quantiles as a box with top and bottom black lines, mean as middle black line, SEM as white lines (left); data representing dendrites as single dots (middle); half violin (right) (g). A two-sided Mann-Whitney test determined significance. **, P < 0.01; ****, P < 0.0001. Scale bars, 100 µm (b, c) and 10 µm (e, f). Source data are provided as a Source Data file.
Fig. 5
Fig. 5. Polyglutamylation of tubulinα4A instructs remodeling.
a Graph depicting normalized mRNA counts of alpha-tubulin isotypes across the postnatal motor axon remodeling phase (postnatal day (P) 5, 7, 9, 11, 14). be Quantitative immunostainings for tubulin beta-3, neurofilament heavy polypeptide, and polyglutamate on triangularis sterni muscles at P10-13 from Tuba4aKI vs. Tuba4aWT littermate controls. Confocal stacks of terminal axons leading to NMJs depicting immunostainings against (b) tubulin beta-3 (Tubb3, green) and (d) polyglutamate chains (PolyE, magenta; same NMJ as in b). c Corresponding quantifications of immunostaining intensities in Tuba4aKI terminal motor axons (right; relative to Tuba4aWT, left, which is set to 1) of Tubb3, normalized to neurofilament heavy polypeptide (WT: n = 174 axons, 10 mice; KI n = 175 axons, 10 mice, p-value = 0,01671) and of (e) polyE, normalized to tubulin beta-3 (WT: n = 174 axons, 10 mice; KI n = 175 axons, 10 mice, p-value = 0,00771). f Percentage of polyinnervated NMJs in Tuba4aWT vs. Tuba4aKI littermate controls, based on tubulin beta-3 staining, at postnatal day (P) 6-7, 8-9, 10-11 and 12-13 (P6-7 WT n = 4, KI n = 3; P8-9 WT n = 3 KI n = 3; P10-11 WT n = 3, KI n = 5; P12-13 WT n = 7, KI n = 4 mice; ≥ 60 NMJs per animal, P6-7 p-value = 0.0310, P8-9 p-value = 0.005139, P10-11 p-value = 0.035714). Graphs: mean ± SEM in (a); 25−75% quantiles shown as a box with top and bottom black lines, mean as middle black line, and SEM as white lines (left); data representing single axons as dots (middle); half violin (right) in (c, e) or mean + SEM, with data representing animals as single dots (f). A two-sided Mann-Whitney test determined significance in (c, e, f P10-11) and a two-sided Student t test in (f P6-7, P8-9): *, P < 0.05; **, P < 0.01. Scale bar, 5 µm in (b), applies also to (d). Source data are provided as a Source Data file.
Fig. 6
Fig. 6. Genetic deletion of CCP1 and CCP6 in motor neurons accelerates pruning.
ak Quantitative immunostainings for microtubule markers on triangularis sterni muscles at postnatal day (P) 9–12 from CCP1&6mnKO and CCP1&6mnWT littermate controls. Confocal stacks of terminal axons leading to NMJs depicting immunostainings for (a) tubulin beta-3 (Tubb3, green), (c) tubulin-alpha (Tuba, cyan), (e) neurofilament (NF, white), (g) polyglutamate chain staining (PolyE, magenta; same NMJ as in a), (i) monoglutamate on beta-tubulin staining (βmonoE, pink), (k) acetylated tubulin staining (Ac-Tub, red). bl Corresponding quantifications of immunostaining intensities in CCP1&6mnKO terminal motor axons (relative to CCP1&6mnWT set to 1). b Tubb3, normalized to YFP (WT n = 127 axons, 4 mice; KO n = 74 axons, 3 mice, p-value = 5,0301E-5). d Tuba, normalized to NF (WT n = 32 axons, 2 mice; KO n = 44 axons, 4 mice; p-value = 0.00546). f NF (WT n = 161 axons, 7 mice, KO n = 120 axons, 5 mice). h polyE, normalized to Tubb3 (WT n = 127 axons, 4 mice; KO n = 74 axons, 3 mice, p-value = 7,84697E-4). j βmonoE intensity, normalized to Tubb3 (WT n = 78 axons, 4 mice; KO n = 63 axons, 3 mice). l ac-tub, normalized to Tubb3 (WT n = 85 axons, 5 mice; KO n = 80 axons, 4 mice, p-value = 0.00233). m Percentage of polyinnervated neuromuscular junctions (NMJs) in CCP1&6mnWT vs. CCP1&6mnKO littermates crossbred to Thy1-YFP at P7-8, 9-10, and 11-12 (P7-8 WT n = 6, KO n = 7, p-value = 0.0221; P9-10 WT n = 3, KO n = 3; P11-12 WT n = 5, KO n = 5 mice, p-value = 0.0079; ≥125 NMJs per animal). n Confocal stack of a terminal axon leading to an NMJ depicting staining of branching points of glutamate side chains on beta- and alpha-tubulin (GT335, light blue). o Quantification of GT335 intensity in terminal motor axons, normalized to tubulin beta-3 (WT n = 83 axons, 3 mice; KO n = 57 axons, 3 mice). Graphs: 25−75% quantiles shown as a box with top and bottom black lines, mean as middle black line, and SEM as white lines (left); data representing single axons as dots (middle); half violin (right) in (b, d, f, h, j, l, o) or mean + SEM, with data representing animals as single dots (m). A two-sided Mann-Whitney test determined significance: **, P < 0.01; ***, P < 0.001; ****, P < 0.0001. Scale bar, 5 µm in (a), applies also to (c, e, g, i, k, n). Source data are provided as a Source Data file.
Fig. 7
Fig. 7. CCP1KO leads to pruning defects in the CNS.
a, b Confocal stacks of coronal brain sections of P14 WT vs. CCP1KO mice immunostained for calbindin D-28k (white). The expansion of the dashed box shows IPB length at higher magnification (violet arrowheads); the light violet line indicates IPB length, and the brown line CA3 length is measured. c Quantification of IPB length normalized to CA3 length in 2-week-old WT vs. CCP1KO (WT: n = 6 hemispheres, 3 mice; KO: n = 6 hemispheres, 3 mice; p-value = 0.0411). Graphs: mean + SEM and data represent hemispheres as single dots. A two-sided Mann-Whitney test determined significance. *, P < 0.05. Scale bar, 100 µm in (a), applies also to (b). Source data are provided as a Source Data file.
Fig. 8
Fig. 8. Modulation of polyglutamylation by deletion of spastin and CCP1.
a Schematic for acute deletion of CCP1 and spastin in a subset of motor neurons. Intraventricular injection on P3 into CCP1 flox/flox X Spast flox/flox X TdTomato reporter animals with viral vectors (AAV9-hSyn-iCre), followed by immunostaining for microtubule markers at P9. The expression of TdTomato (TdTom) served as a measure of CCP1 and Spastin deletion. Terminal motor axons were considered Cre recombined (TdTomhigh) if their TdTomato intensity belonged to the 3rd quantile range and not recombined if they belonged to the 1st quantile range (TdTomlow). b Confocal stacks of NMJs depict TdTomato (red), Tubb3 (green), and PolyE (magenta) stainings. c, d Quantification in terminal motor axons of (c) Tubb3 (tom- 50 axons, 6 mice; tom + n = 50 axons, 6 mice, p-value = 0,00126) and (d) PolyE, normalized to Tubb3 (tom- n = 50 axons, 6 mice; tom + n = 50 axons, 6 mice, p-value = 8,97637E-4). Graphs: 25−75% quantiles shown as a box with top and bottom black lines, mean as middle black line, and SEM as white lines (left); data representing single axons as dots (middle); half violin (right) in (c, d). A two-sided Mann-Whitney test determined significance: **, P < 0.01. Scale bar, 5 µm. Source data are provided as a Source Data file.
Fig. 9
Fig. 9. Modulation of polyglutamylation by blockage of neurotransmission.
a Confocal stack of wildtype (BL6) mice depicts a doubly innervated NMJ with a thicker ‘winner’ and a thinner ‘loser’ (yellow arrowheads) axon immunostained at P9 for PolyE (magenta), and α-BTX (blue; n = 1 mouse). The boxed area is shown at higher magnification on the right with single channels. b Schematic for α-BTX (conjugated to Alexa Fluor 594, orange) injections. Wildtype (BL6) and SpastKO mice were injected with α-BTX into the thoracic wall at postnatal day (P) 7. Triangularis sterni muscles were fixed and immunostained at P9 for microtubule markers. c, e Confocal stacks of (c) wildtype and (e) SpastKO NMJs depict non-injected (left) and BTX-injected motor axons (right; BTX, orange) stained for PolyE (magenta) at P9. d, f Quantification in terminal motor axons of polyE intensity normalized to Tubb3 of (d) wildtype (BTX-: n = 37 axons, 4 mice; BTX + : n = 34 axons, 4 mice; p-value = 0.04053) and (f) SpastKO mice (BTX-: n = 23 axons, 2 mice; BTX + : n = 58 axons, 3 mice; p-value 1,83216E-6). Graphs: 25−75% quantiles shown as a box with top and bottom black lines, mean as middle black line, and SEM as white lines (left); data representing single axons as dots (middle); half violin (right) in (d, f). A two-sided Mann-Whitney test determined significance: **, P < 0.01; ***, P < 0.001. Scale bar, 5 µm in (a), applies also to (c) and (e). Source data are provided as a Source Data file.

References

    1. Burute, M. & Kapitein, L. C. Cellular logistics: Unraveling the interplay between microtubule organization and intracellular transport. Annu. Rev. Cell Dev. Biol.35, 29–54 (2019). - PubMed
    1. Gudimchuk, N. B. & McIntosh, J. R. Regulation of microtubule dynamics, mechanics and function through the growing tip. Nat. Rev. Mol. Cell Biol.22, 777–795 (2021). - PubMed
    1. McKenna, E. D., Sarbanes, S. L., Cummings, S. W. & Roll-Mecak, A. The tubulin code, from molecules to health and disease. Annu. Rev. Cell Dev. Biol.39, 331–361 (2023). - PubMed
    1. Janke, C. & Magiera, M. M. The tubulin code and its role in controlling microtubule properties and functions. Nat. Rev. Mol. Cell Biol.21, 307–326 (2020). - PubMed
    1. Moutin, M. J., Bosc, C., Peris, L. & Andrieux, A. Tubulin post-translational modifications control neuronal development and functions. Dev. Neurobiol.81, 253–272 (2021). - PMC - PubMed

LinkOut - more resources