. 2025 Jun 25;16(1):5394.
doi: 10.1038/s41467-025-60442-9.

ETMR stem-like state and chemo-resistance are supported by perivascular cells at single-cell resolution

Affiliations

ETMR stem-like state and chemo-resistance are supported by perivascular cells at single-cell resolution

Flavia W de Faria et al. Nat Commun. .

Abstract

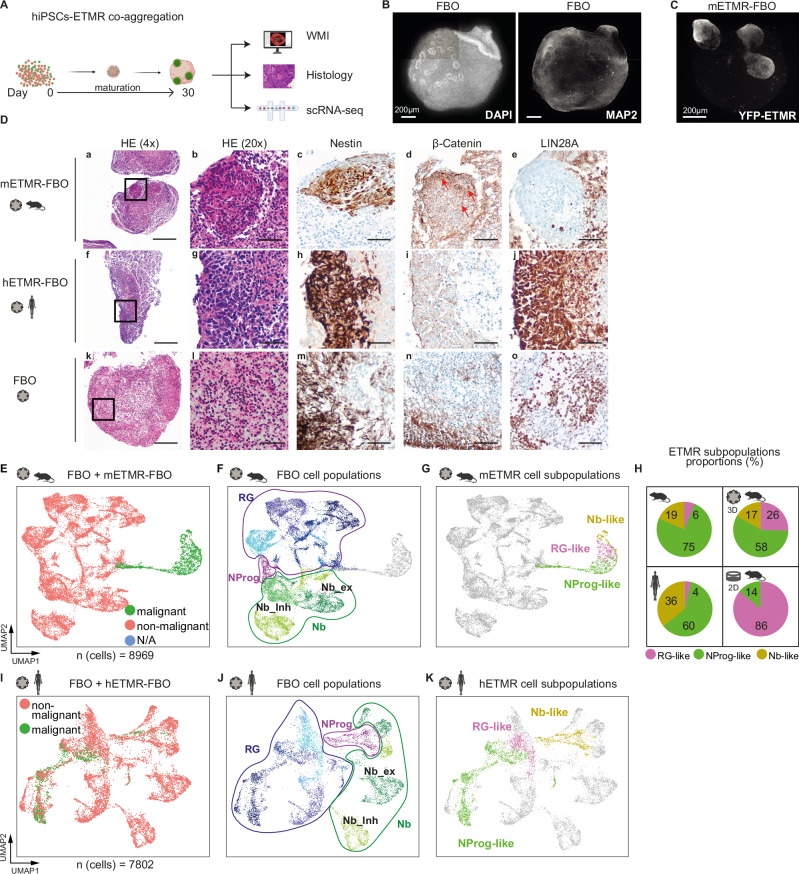
Embryonal tumor with multilayered rosettes (ETMR) is a lethal embryonal brain tumor entity. To investigate the intratumoral heterogeneity and cellular communication in the tumor microenvironment (TME), we analyze in this work single-cell RNA sequencing of about 250,000 cells of primary human and murine ETMR, in vitro cultures, and a 3D forebrain organoid model of ETMR, supporting the main findings with immunohistochemistry and spatial transcriptomics of human tumors. We characterize three distinct malignant ETMR subpopulations - RG-like, NProg-like and NB-like - positioned within a putative neurodevelopmental hierarchy. We reveal PDGFRβ+ pericytes as key communication partners in the TME, contributing to stem cell signaling through extracellular matrix-mediated interactions with tumor cells. PDGF signaling is upregulated in chemoresistant RG-like cells in vivo and plays a role in recruiting pericytes to ETMR TME by finalizing a signaling cascade which promotes the differentiation of non-malignant radial glia cells, derived from our 3D model, into pericyte-like cells. Selective PDGFR-inhibition blocked the lineage differentiation into pericytes in vitro and reduced the tumor cell population in vivo. Targeting ETMR-pericyte interactions in the TME presents a promising therapeutic approach.


Conflict of interest statement

Competing interests: The authors declare no competing Interests.

Figures

Fig. 1
Fig. 1. scRNA-seq of murine and human ETMR defined tumor cellular diversity and revealed three distinct ETMR malignant cell states during putative neuronal development.
A Schematic of the experimental design and cohorts. We integrated scRNA-sequencing (scRNA-seq) from over 250,000 cells, including murine forebrains harboring ETMR (mETMR) or not (mFB), human ETMR tumors, 2D cultures and ETMR co-cultured with forebrain organoids (ETMR-FBOs). Quantitative immunohistochemistry (IHC), immunofluorescence (IF), spatial transcriptomics of human ETMR samples and drug testing in ETMR-FBO and tumor-bearing mice were also performed. Species symbols guide related results throughout this study. Partially created with BioRender.com. B t-distributed Stochastic Neighbor Embedding (t-SNE) plot shows separate clustering of mETMR-FB (n = 2) and wildtype mFB (n = 2) samples. Colors indicate sample origin. C Cell type composition of integrated murine datasets. Left: t-SNE colored by cell; Right: bar graph by sample. D Pearson correlation plots comparing gene expression profiles between malignant and non-malignant cells in the murine dataset. Pearson’s product-moment correlation, p value < 0.0001 for RG-like vs RG, NProg-like vs NProg, and Nb-like vs Nb. E Uniform Manifold Approximation and Projection (UMAP) of human ETMRs (hETMR; n = 9 samples), colored by major cell types. F Heatmap showing representative marker gene expression from malignant and non-malignant populations of hETMR tumors. Colored by gene enrichment scores. G UMAPs show the three ETMR cellular states – RG-like, NProg-like and Nb-like - in murine (left) and human (right) datasets, colored by cell state. H ETMR disrupts early neural cellular fate distribution across species. Pie charts compare fate distributions in healthy mFB controls, mETMR-FB and hETMR conditions, colored by cell type as in (G). Non-malignant populations are shaded to match their malignant counterparts for better comparison. Source data of (C, H) are provided as a Source Data file. RG radial glia, NProg neuroprogenitor, Nb_Ex neuroblast_excitatory, Nb_Inh neuroblast_inhibitory, OPC oligoprogenitor cell, MG microglia, PC pericytes, EC endothelial cells, RBC red blood cells. Sample type symbols in (BG) created with BioRender.com.
Fig. 2
Fig. 2. Pericytes are a key player in the TME, influencing tumor ECM and supporting stem-cell signaling.
A, B Representation of the murine (A) and human ETMR (B) cellular microenvironment in tSNE/UMAP, color-coded by cell type. The remaining cells (malignant and control mFB) are collectively represented in gray. C Representative marker gene comparison depicted in dot plots of non-neuronal cell type categories found in both the murine and human datasets. Color-coded by cell category and gene expression level. The dots’ size represents the percentage of cells expressing the marker genes. D Abundance of cell–cell communications through ligand-receptor (L_R) interactions among TME cells in mETMR-FB (top) and hETMR (bottom). Bar graphs show the total number of interactions (n) per cell type. E Relative proportion of L_R-interactions from PC to the distinct ETMR subpopulations, depicted in pie charts. F, G Sunburst plots representing the interactions in the human snRNA-seq dataset involving ECM (F), stem-cell or angiogenesis signaling (G). For each plot, the cell types listed in the inner circle represent the signal source, and the cells in the outer circle represent the receiver. The schematic circle with arrows describes the signal direction. Interactions involving ETMR subpopulations and PC are color-coded by cell type; the remaining cell-cell interactions, in gray for clarity. H Schematic description of ETMR-PC co-culture experiment. Murine ETMR neurospheres were used in mono- and co-cultures with PCs, with two biological replicates each. Color-coded by cell type: ETMR (red) and PCs (blue). I CellPhoneDB analysis of L_R interactions. Bar graph representing the total number of interactions for the two conditions. J Venn diagram depicting the number of common and unique (culture condition–specific) interactions in the mono- and co-culture systems. Circles colored by culture condition: mono-culture (red) and co-culture (blue). K Co-culture-specific interactions are enriched in pluripotent stem cell (PSC) and neurodevelopmental pathway signaling. STRING network depicting the co-culture unique signaling pathways. L_R molecules are represented by colored spheres grouped by associated signaling pathways. Molecule names omitted for clarity. Souce data of (DG, I, and K) are provided as a Source Data file. Sample type symbols in (AK) created with BioRender.com.
Fig. 3
Fig. 3. PCs are enriched in ETMR hypercellular regions, which correlate with stem-like cell fates.
A, B Muliplex IF analysis of a human ETMR FFPE section (n = 1). A Representative multiplex IF images showing merged channels for smooth-muscle cells (ACTA2+), PC (PDGFRb+), EC (CD31+) and DAPI nulear staining. Insets present individual channels of selected areas (dashed boxes 1 and 2), revealing the close juxtaposition of PC to EC in vessel walls (box 2). B Amplified image of the region within box 1 (panel A), depicting RG-like cells (NEShigh/SOX2+), NProg-like cells (SOX2+/NESlow−), Nb-like cells (MAP2+) and PC (PDGFRb+). The main panel shows merged channels, while insets display selected single channels (scale bar, 10 μm). C Quantitative analysis of tumor subpopulation proximities to PC regions described in (A). PC regions were defined by the areas enclosed by PDGFRb+ signal, as illustrated by the dashed line. Arrows indicate the shortest distances of individual cells to the nearest PC region. Distances were measured in pixels (px), and the distributions of each cell type and all segmented cells are shown in a histogram. NEShigh and SOX2 + /NESlow cells were significantly closer to PC regions than MAP2+ cells (n cells = 19,477; One-way Anova, F(3, 43917) = 1256, p value < 2e-16; post-hoc test TukeyHSD, p value < 0.00000001). D Quantitative IHC of human ETMR tumors. The left panel shows representative regions of interest (ROIs) of ETMR IHC sections as hypercellular (Hyper, pink) and hypocellular (Hypo, green) regions (also Suppl. Fig. S12). The right panel depicts DAPI+ cells (blue) and CD13 + PC (red) for further quantification (n samples = 4; field of view = 669 μm × 500 μm; n fields of view = 325). Scale bar = 100 μm. Boxplot shows median (center line), first and third quartile (bounds) and minima/maxima (whiskers) of all measurements of PC density in the Hyper vs Hypo regions. Data points 1.5× more than the interquartile range away from the box were considered outliers. One-sided Wilcoxon rank sum test with continuity correction. Sample type symbol created with BioRender.com. Data source of (D) is provided as a Source Data file.
Fig. 4
Fig. 4. ETMR cellular heterogeneity was recapitulated in ETMR-forebrain organoids.
A Schematic of ETMR-FBO generation via co-aggregation of hiPSCs with murine or human ETMR cells: i) on day 0, hiPSCs were co-aggregated with ETMR cells; ii) organoids were matured under standard conditions; iii) on day 30, ETMR-harboring (ETMR-FBO) and non-harboring (FBO) organoids were used for histology, immunostaining, and scRNA-seq. Created with BioRender.com. B Representative maximum projection image of all confocal planes from whole-mount immunostained (WMI) FBOs for DAPI and MAP2 (neuronal maker) (n = 6 organoids; 1 experiment). Scale bar = 200 μm. C Representative WMI image of YFP+ murine ETMR cells integrated in FBOs (mETMR-FBO) (n = 36 organoids; 2 experiments). Scale bar = 200 μm. D (a–o) Immunohistochemistry (IHC) of mETMR-FBO, hETMR-FBO, and FBO (1x FFPE block with ~ 20 organoids/condition; 2 experiments); a, f, k) H&E staining of each condition (×4 magnification, scale bar = 250 μm). Squares indicate areas further characterized by IHC; (ae). Tumoral regions in mETMR-FBO showed high cell density, Nestin positivity, β-Catenin-accumulation (red arrows) and LIN28A negativity; (f-j), tumor areas in hETMR-FBO showed Nestin and LIN28A positivity (×20 magnification, scale bar = 50 μm). EK scRNA-seq analysis of murine and human ETMR-FBO. E Integrated UMAP clustering from one FBO and two mETMR-FBO, showing malignant (murine), non-malignant (human) and non-assigned (NA) cells. F UMAP showing main FBO cell types. Colored by cell types (RG radial glia, NProg neuroprogenitor, Nb neuroblast, Nb_ex Nb_excitatory, Nb_Inh, Nb_inhibitory). G UMAP of mETMR-FBO showing ETMR subpopulations (RG-like, NProg-like, and Nb-like), colored by cell type. H Pie charts of ETMR subpopulation proportions across datasets (primary murine/human ETMR, mETMR-FBO, and 2D ETMR culture). Same color code as in (G). IK UMAPs from integrated clustering of FBO and hETMR-FBO (n = 1 sample each), showing hETMR and FBO cells (I), FBO cell types (J), and hETMR subpopulations (K) recapitulated within FBOs. Source data of H is provided as a Source Data file. Sample type symbol in DK created with BioRender.com.
Fig. 5
Fig. 5. ETMR altered the fate determination of RG subpopulations in the FBO, supporting their differentiation into pericytes through WNT-TGFB-PDGFR signaling.
A, B ETMR altered the fate determination of non-malignant RG subpopulations in either the mETMR-FBO (A) or hETMR-FBO (B) compared to the FBO controls. RG clusters enriched in vascular development GO terms are referred to as RG-angio, while those enriched in PC marker genes are termed RG-PC. Bar graphs are color-coded by condition. C Monocle pseudotime trajectory of RG cells from the mETMR-FBO dataset illustrates differentiation path from RG-to-PC. Cells are color-coded by pseudotime. Arrows highlight the trajectory from early RG subpopulations to RG-PC. Dashed lines mark the clusters included in the trajectory analysis described in (DG). D UMAP signature plots of transitional programs involved in RG-to-PC differentiation show that RG cells in the cyNESC program first undergo a mesenchymal (MES) transition, which further progress into a PC differentiation program. E Line plots illustrate gene expression trends across pseudotime for selected genes differentially expressed along the trajectory. Genes are grouped into functional programs, indicated by boxed sections that mark their association with specific pseudotime stages. Lines represent non-linear smoothed gene expression trajectories (LOESS fit); black lines indicate the estimated central tendency, and gray shaded areas denote the 95% confidence interval based on standard error. F Heatmap shows expression scores of marker genes representing signaling pathways that are differentially upregulated in RG clusters involved in the RG-to-PC trajectory. Pathways were identified via ToppGene analysis. G Schematic of cell types and signaling pathways involved in RG lineage conversion to PC. Created with BioRender.com. H Diagram of predicted L_R interactions (from CellPhoneDB/InterCellar) involved in promoting RG-to-PC differentiation (see also Supplementary Fig. S17). Source data of (A, B) are provided as a Source Data file. Sample type symbols in (AF, H) created with BioRender.com.
Fig. 6
Fig. 6. Chemotherapy resistance in ETMR is mediated by RG-like tumor subpopulations upregulating PDGFR signaling.
A Chemotherapy treatment schedule of mETMR-FBO and hETMR-FBOs (2 experiments; ETMR-FBO = 2 biological replicates/treatment-interval; FBO control = 1). Organoids were exposed to etoposide (1 μM) or DMSO as a control. They were treated over a 4-day period and subsequently harvested for scRNA-seq at organoid culture day 30 (D30) or day 48 (D48), after a short (1 day), intermediate (6 days), or late (18 days) interval post-treatment. B Expression scores of ETMR cell type-specific gene signatures in integrated scRNA-seq dataset of mETMR- and hETMR-FBO experiments from (A), comparing D30 (DMSO control), short and intermediate intervals. We used Kruskal–Wallis statistical test for multi-group comparisons and Wilcoxon rank sum test, two-sided, for inter-group comparisons, with Benjamini–Hochberg false discovery rate (FDR) p value adjustment. The number (n) of cells for analysis is displayed. C scRNA-seq of E18.5 ETMR-harboring murine forebrains (mETMR-FB) treated daily with etoposide (5 mg/kg) or vehicle at days E14.5-E16.5 by i.p. injection in pregnant mothers with n (embryos) = 3 per condition (vehicle or etoposide). UMAP describes cellular distribution, color-coded by treatment condition. Dashed lines delineate ETMR subpopulations. D Pie chart showing the relative proportion of each ETMR subpopulation in the conditions vehicle versus etoposide-treated samples. Color-coded by ETMR subpopulations. E Heatmap depicting the average expression of marker genes representing an “apoptosis-recovery” gene signature. F Violin plots depicting Pdgfr-related differentially expressed genes between etoposide versus vehicle-treated RG-like cells, calculated using two-sided MAST statistical test; adj.p values are displayed. Source data of D are provided as a Source Data file. Sample type symbols in AF created with BioRender.com.
Fig. 7
Fig. 7. PDGFR inhibition targets pericytes and decreases tumor cell population in FBO and in vivo.
A Left: mETMR-FBOs were treated with the PDGFR-inhibitor CP-673451 (10 μM) or vehicle at every medium exchange from day 15 (D15) to 30 (D30), followed by scRNA-seq at D30 (1 experiment). Right: UMAP of integrated dataset, colored by treatment - CP-673451 (n = 3), vehicle (n = 4) and untreated FBO controls (n = 2); n = biological replicates. B Cell type annotation of the mETMR-FBO dataset. ETMR subpopulations (RG-like, NProg-like and Nb-like) form distinct clusters from non-tumor FBO cells. C, D Boxplots showing the relative proportion (%) of PC cells (C) or ETMR cells (D) by condition in the dataset described in (A). Wilcoxon rank sum test, one-sided. Boxes represent the median (middle) and interquartile ranges (upper/lower hinges); whiskers show 1.5× IQR. C The PC population decreased from 0.44% (IQR 0.16–2.04) in vehicle-treated to 0.04% (IQR 0.03–0.52) in CP-673451-treated samples (p = 0.43). D The tumor population decreased from 3.87% (IQR 2.23–12.68) in vehicle-treated to 1.29% (IQR 1.19–2.02) in CP-673451-treated samples (p = 0.2). E Representative H&E and Ki67-stained histological images of ETMR-harboring murine brains at embryonic day E18.5, after 4 days of CP-673451 or vehicle treatment. Scale bar = 1 mm. F, G Quantification of tumor area (F) and ki67 positivity (G) in ETMR-bearing mice: vehicle-treated (n = 4) vs. CP-673451-treated (n = 3 animals); Wilcoxon rank-sum test, one sided. Boxes represent the median (middle) and interquartile ranges (upper/lower hinges); whiskers show 1.5× IQR. F Tumor fraction decreased in CP-673451-treated animals (mean = 18,78%; sd = 5,36) compared to vehicle-treated ones (mean = 48,09%; sd = 4,02). G Ki67+ areas decreased in CP-673451-treated animals (mean = 10,17%; sd = 1,72) compared to vehicle-treated ones (mean =2 28,61%; sd = 2,23). Source data of C, D, F and G are provided as a Source Data file. Sample type symbols in AC, E, F created with BioRender.com.
Fig. 8
Fig. 8. Schematic of pericyte and PDGF signaling supporting stem cell maintenance and chemo-resistance in ETMR.
PDGFRβ+ pericytes and PDGF signaling support tumor survival through distinct mechanisms affecting both the tumor and the TME. In the TME: 1) ETMR promotes the transformation of neural stem cells (radial glial cells) into pericyte-like cells through a signaling cascade that shifts from WNT-high to PDGF-high expression; 2) PC communicates stem-cell signals through the ECM to maintain tumor sub-populations with self-renewal capacity (RG-like and NProg-like cells). In the tumor compartment: 1) Chemo-resistant RG-like tumor cells enhance PDGF signaling as a mechanism of survival advantage. Partially created with Biorender.com.

References

    1. Korshunov, A. et al. Focal genomic amplification at 19q13.42 comprises a powerful diagnostic marker for embryonal tumors with ependymoblastic rosettes. Acta Neuropathol.120, 253–260 (2010). - PubMed
    1. Picard, D. et al. Markers of survival and metastatic potential in childhood CNS primitive neuro-ectodermal brain tumours: an integrative genomic analysis. Lancet Oncol.13, 838–848 (2012). - PMC - PubMed
    1. Khan S. et al. Clinical phenotypes and prognostic features of embryonal tumours with multi-layered rosettes: a Rare Brain Tumor Registry study. Lancet Child Adolesc. Health5, 800–813 (2021). - PubMed
    1. Li, M. et al. Frequent amplification of a chr19q13.41 MicroRNA polycistron in aggressive primitive neuroectodermal brain tumors. Cancer Cell16, 533–546 (2009). - PMC - PubMed
    1. Gessi, M. et al. Embryonal tumors with abundant neuropil and true rosettes. Am. J. Surg. Pathol.33, 211–217 (2009). - PMC - PubMed

MeSH terms

Substances