. 2025 Jun 25;16(1):5388.
doi: 10.1038/s41467-025-60977-x.

The mitochondrial methylation potential gates mitoribosome assembly

Affiliations

The mitochondrial methylation potential gates mitoribosome assembly

Ruth I C Glasgow et al. Nat Commun. .

Abstract

S-adenosylmethionine (SAM) is the principal methyl donor in cells and is essential for mitochondrial gene expression, influencing RNA modifications, translation, and ribosome biogenesis. Using direct long-read RNA sequencing in mouse tissues and embryonic fibroblasts, we show that processing of the mitochondrial ribosomal gene cluster fails in the absence of mitochondrial SAM, leading to an accumulation of unprocessed precursors. Proteomic analysis of ribosome fractions revealed these precursors associated with processing and assembly factors, indicating stalled biogenesis. Structural analysis by cryo-electron microscopy demonstrated that SAM-dependent methylation is required for peptidyl transferase centre formation during mitoribosome assembly. Our findings identify a critical role for SAM in coordinating mitoribosomal RNA processing and large subunit maturation, linking cellular methylation potential to mitochondrial translation capacity.


Conflict of interest statement

Competing interests: The authors declare no competing interests.

Figures

Fig. 1
Fig. 1. Reduced mitochondrial methylation potential affects mitochondrial gene expression.
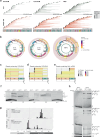
a The mitochondrial methylation potential was assessed via bisulfite pyrosequencing of 12S mt-rRNA from control (white) and Samc KO (black) MEFs or quadriceps at 8 and 12 weeks of age, targeting 4′-methylcytosine m4C909 (m4C) or 5′-methylcytosine m5C911 (m5C). Data are presented as mean values ±  standard deviation. Student’s two-tailed T-test was used. ***p < 0.001, ****p < 0.0001 (n = 3). Exact p values: m4C909: 8 week p = 0,000139, p = 0.000039, MEF p = 0,000005. m5C911: 8wk p = 0.000096, 12wk p = 0.000045, MEF p = <0.000000. b Heatmap of OXPHOS subunits as determined by mass spectrometry-based proteomics in 8 and 12-week-old quadriceps or MEF samples normalised to controls (n = 3). c Relative mitochondrial transcript steady-state levels in 8 and 12-week-old muscle or MEFs from control (white) and Samc KO (black) samples, as determined by qRT-PCR. Data are presented as mean values ± standard deviation. Student’s two-tailed T-test was used. ns = non-significant p > 0.05; *p < 0.05, **p < 0.01, ***p < 0.001.(n = 3 biologically independent samples with 3 technical replicates). Exact p-values: 8wk SkM: 12S p = 0.276355, 16S p = 0.100339, Nd1 p = 0.005228, Nd2 p = 0.009903, Nd3 p = 0.000106, Nd4 p = 0.000978, Nd5 p = 0.013336, Cytb p = 0.305520, Atp8/6 p = 0.060454, Co1 p = 0.031159, Co2 p = 0.023099, Co3 p = 0.018100. 12 week SkM: 12S p = 0.000002, 16S p = 0,000315, Nd1 p = 0.000032, Nd2 p = 0,086241, Nd3 p = 0.000114, Nd4 p = 0,000462, Nd5 p = 0,002247, Cytb p = 0.088495, Atp8/6 p = 0.001081, Co1 p = 0.000087, Co2 p = 0,002090, Co3 p = 0.008890. MEF: 12S p = 0.005025, 16S p = 0.001332, Nd1 p = 0.000149, Nd2 p = 0.030912, Nd3 p = 0.002983, Nd4 p = 0.012898, Nd5 p = 0.006421, Cytb p = 0.018639, Atp8/6 p = 0.033871, Co1 p = 0.030329, Co2 p = 0.050202, Co3 p = 0.006753. d Mitochondrial tRNA steady-state levels in Samc KO or control MEFs, as determined by Northern blot analysis (n = 5 biologically independent samples). Source data are provided as a Source Data file.
Fig. 2
Fig. 2. ONT sequencing.
a Fraction of processed and unprocessed reads from total read counts in the indicated samples. Reads were classified as unprocessed if their ends did not fall entirely within ±20 nt of the annotated gene boundaries (see Supplementary Fig. 3a). b Proportions of individual unprocessed reads, containing mRNA and/or rRNA, as a percentage of the total unprocessed pool of reads for each sample. Reads representing less than 2% were pooled in the ‘other’ category. c Difference of fraction of individual unprocessed reads as a percentage of total reads in KO and Ctrl samples. Only junctions where the absolute difference exceeded 0.5% were visualised. Reads are indicated as most 5′ to 3′ mRNA or rRNA. Source data are provided as a Source Data file.
Fig. 3
Fig. 3. Mitochondrial SAM is critical for processing of the rRNA gene cluster.
a ONT sequencing data filtered for all reads containing tRNA sequences and mapped against the mitochondrial genome (KR020497). Control (Ctrl; green) and Samc KO (red) from 8 and 12-week-old muscle (quad) and MEF samples (n = 3 biologically independent samples). b ONT sequencing data filtered for reads containing tRNA sequences present in more than 0,01% of the total RNA pool and mapped against the mitochondrial genome (KR020497). Control (inner circle; green) and Samc KO (outer circle; pink) reads are shown from 8 and 12-week-old quadriceps and MEF samples. Black dots represent presence of a tRNA sequence at the 5′ or 3′ termini of the reads. Shown are the fractions of transcripts passing through at least the centre of one tRNA, calculated relative to reads in the next mRNA or rRNA. (n = 3 biologically independent samples). ce Zoom-in of KOMEFs RNA reads passing through (b) 12S rRNA, (c) 16S rRNA, or (d) mtNd1 with no fraction cut-off. Gene borders are indicated by dotted lines. (n = 3 biologically independent samples). f Northern blot analysis of rRNA mitochondrial transcripts and flanking tRNAs in control and Samc KO MEFs as indicated (n = 5 biologically independent samples). Nucleotide length provided in grey (nts). Black arrowheads indicate unprocessed transcripts (1) mtF-12S-mtV16S-mtL1-mtNd1 (2) mtF-12S-mtV-16S, (3) mtV-16S. g number and position of reads containing mtF (tRNAPhe) in KOMEFs is shown. Transcription start sites for the heavy strand promoter are indicated in bold. (n = 3 biologically independent samples). Number of reads and percentage of total reads is indicated. h Northern blot analysis of selected mitochondrial transcripts in control or Samc KO MEFs after treatment with 20 mM IMT1B, a mitochondrial transcription inhibitor, using probes against mtF (top panel), mtV (middle panel) or 12S (bottom panel). Nucleotide length provided in grey (nts). (*indicates tRNAs for which the gel resolution does not allow us to distinguish whether they are present or absent.) 18S was used as loading control. Treatment times were 8 and 16 h, chase timepoints were at 4, 8, 12 and 24 hours. 0 = dimethyl sulfoxide (DMSO) vehicle control without IMT1B). Representative experiment of three independent experiments. Source data are provided as a Source Data file.
Fig. 4
Fig. 4. Mitochondrial ribosome assembly depends on SAM.
a De novo translation in isolated mitochondria from male and female 8 week and 12-week-old muscle or MEFs samples as indicated. Expected mitochondrial proteins are shown. Coomassie stain of the gel indicates loading. b Western blot analysis of ribosome gradient fractions from Samc KO and control MEFs, probed with antibodies against the small (uS15m) and large (mL37) mitochondrial ribosome subunits. The small (28S), large (39S) and monosome (55S) fractions are indicated. A representative experiment is shown of three independent experiments performed with independently prepared samples. Nearest molecular weight indicator provided in grey (kDa). c Proteomic levels of mitoribosome subunits from 8 to 12-week-old muscle or MEF Samc KO samples normalised to control samples. (n = 3). d Western blot analysis of mitochondrial ribosome subunits in 25 μg of mitochondrial lysate from 8 to 12-week-old muscle or MEF samples. Nearest molecular weight indicator provided in grey (kDa). Source data are provided as a Source Data file.
Fig. 5
Fig. 5. The unprocessed mitochondrial rRNA cluster engage in early ribosome assembly.
Distribution of subunit levels of the (a) small or (b) large mitochondrial ribosome in fractions representing the mtSSU or monosome after SILAC labelling of Samc KO and control MEFs (n = 2). Right panel shows changes of individual subunits that are either increased (red) or decreased (blue) in the monosome fraction. Right panel Log fold change, and distribution of (a) mtSSU (b) mtLSU factors in the respective fractions. c Enrichment levels of mitochondrial RNA binding proteins and ribosome assembly proteins in ribosome gradient fractions in Samc KO and control MEFs after SILAC labelling (n = 2). d Northen blot analysis of ribosome gradient fractions from Samc KO and control MEFs (n = 1). Nucleotide length provided in grey (nts). Source data are provided as a Source Data file.
Fig. 6
Fig. 6. Cryo-EM structures of mouse mitochondrial LSU assembly.
a Overview of identified mtLSU states (A-D). 16S rRNA helices in white, CP-tRNA in grey, mature structures in yellow. Large ribosomal subunit protein uL16m (red). Biogenesis factors shown are highlighted as followed: rRNA methyltransferase 3, MRM3 dimer (cyan); DEAD box RNA helicase 28, DDX28 (green); GTP-binding protein 10, GTPBP10 (magenta); mitochondrial assembly of ribosomal large subunit protein 1, MALSU1 module (orange, salmon, pink); transcription termination factor 4, MTERF4 (dark green); 5-methylcytosine rRNA methyltransferase, NSUN4 (cyan); GTP-binding protein 7 GTPBP7 (turquoise); rRNA methyltransferase 2, MRM2 (dark orange). b Close up of the CP showing, mtF modelled into the density map and superposed with mtV (PDB ID 7QI4). Zoom-in panels show a lack of 3′ CCA (left), lack of rRNA methylations at positions 9 and 10, comparison of anticodon loop and part of the stem of mtF and mtV against the density map.
Fig. 7
Fig. 7. Formation of the PTC is inhibited in Samc KO MEFs.
a Close-up view of PTC maturation states. Panels show mtLSU assembly factors bound to part of rRNA helices and loops, contributing to the PTC, namely, h67-71 (pink), h80/P loop (gold), PTC loops (purple) and h92/A loop (blue). Lower panels show comparable states from published work while upper panels depict states A1-4, states B1, B2, C1 and D1 to depict the key stages of PTC maturation observed in current work. b 2D representation of domain V in mature mtLSU, human mtLSU intermediate (PDB ID 7O9M) and state D1. Interactions made by methyl transferases MRM2 and NSUN4 are highlighted. Residues methylated in mature mtLSU are highlighted (methylated as light green; unmethylated as grey). Dashed lines represent predicted stabilising interactions between methylated residues. Residue numbers are shown according to mouse genome numbering and the corresponding human numbering is indicated in brackets.

References

    1. Ducker, G. S. & Rabinowitz, J. D. One-carbon metabolism in health and disease. Cell Metab.25, 27–42 (2017). - PMC - PubMed
    1. Monné, M., Marobbio, C. M. T., Agrimi, G., Palmieri, L. & Palmieri, F. Mitochondrial transport and metabolism of the major methyl donor and versatile cofactor S‐adenosylmethionine, and related diseases: a review†. IUBMB Life74, 573–591 (2022). - PubMed
    1. Suzuki, T. et al. Complete chemical structures of human mitochondrial tRNAs. Nat. Commun.11, 4269 (2020). - PMC - PubMed
    1. Sanchez, M. I. G. L., Cipullo, M., Gopalakrishna, S., Khawaja, A. & Rorbach, J. Methylation of ribosomal RNA: a mitochondrial perspective. Front. Genet.11, 761 (2020). - PMC - PubMed
    1. Rosenberger, F. A. et al. The one-carbon pool controls mitochondrial energy metabolism via complex I and iron-sulfur clusters. Sci. Adv.7, eabf0717 (2021). - PMC - PubMed

LinkOut - more resources