. 2025 Jun 25;16(1):5393.
doi: 10.1038/s41467-025-61029-0.

PADI4-mediated citrullination of histone H3 stimulates HIV-1 transcription

Affiliations

PADI4-mediated citrullination of histone H3 stimulates HIV-1 transcription

Luca Love et al. Nat Commun. .

Abstract

HIV-1 infection establishes a reservoir of long-lived cells with integrated proviral DNA that can persist despite antiretroviral therapy (ART). Certain reservoir cells can be reactivated to reinitiate infection. The mechanisms governing proviral latency and transcriptional regulation of the provirus are complex. Here, we identify a role for histone H3 citrullination, a post-translational modification catalyzed by protein-arginine deiminase type-4 (PADI4), in HIV-1 transcription and latency. PADI4 inhibition by the small molecule inhibitor GSK484 reduces HIV-1 transcription after T cell activation in ex vivo cultures of CD4+ T cells from people living with HIV-1 in a cross-sectional study. The effect is more pronounced in individuals with active viremia compared to individuals under effective ART. Cell models of HIV-1 latency show that citrullination of histone H3 occurs at the HIV-1 promoter upon T cell stimulation, which facilitates proviral transcription. HIV-1 integrates into genomic regions marked by H3 citrullination and these proviruses are less prone to latency compared to those in non-citrullinated chromatin. Inhibiting PADI4 leads to compaction of the HIV-1 promoter chromatin and an increase of heterochromatin protein 1α (HP1α)-covered heterochromatin, in a mechanism partly dependent on the HUSH complex. Our data reveal a novel mechanism to explain HIV-1 latency and transcriptional regulation.


Conflict of interest statement

Competing interests: The authors declare no competing interests.

Figures

Fig. 1
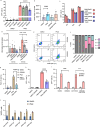
Fig. 1. PADI4 stimulates HIV-1 transcription after cell stimulation in cells from viremic people with HIV-1.
a Extracellular HIV-1 RNA with PMAi and GSK484 treatments from entire cohort (n = 26, study participant characteristics in Table S1). b Intracellular cell-associated HIV-1 RNA in the cohort stratified into in viremic (n = 9) and long-term ART-suppressed (n = 14) groups. c Intact HIV-1 proviral reservoir from the viremic (n = 9) and long-term ART-suppressed (n = 10) groups measured by IPDA. HIV-1 5´LTR RNA (d) and Tat-Rev (e) quantified in viremic (n = 11) and long-term ART-suppressed groups (n = 15). f PADI4 expression in the viremic (n = 11) and long-term ART-suppressed (n = 14) normalized to RPP30. The number of independent study participants included in each panel is denoted by n. All statistical tests shown are two-sided Wilcoxon matched-pairs signed rank test, exact p-values are indicated. Source data are provided as a Source Data file.
Fig. 2
Fig. 2. PADI4 facilitates HIV-1 transcription after cell stimulation in cell models.
a J-Lat 5A8 cells treated with PADI inhibitors and PMAi activation. GFP measured by flow cytometry (n = 11 DMSO, n = 7 Cl-Amidine, n = 4 CAY10723, n = 8 GSK484). b PADI4 expression in 5A8 measured by ddPCR under PMAi and GSK484 treatment (n = 4). c Time course of 5A8 under PMAi and GSK484 treatment and flow cytometry quantification of GFP. Cells were washed and resuspended in new media without drugs after 1 h (n = 3). d H3cit (R2, R8, R17 residues) quantification by immunoblot in 5A8 with PMAi and GSK484 treatment at two early timepoints (n = 3). e T cell activation phenotype for 5A8 as measured by flow cytometry. CD69 appears early during T cell activation, CD25 appears late during late T cell activation. f T cell activation of 5A8 after 24 h with different PADI4 inhibitors and PMAi activated cells (n = 3). g U1 cells treated with PMA and GSK484 for 24 h and quantified with flow cytometry (n = 3). h Polyclonal K562-Lat treated with PMAi and GSK484 for 24 h and quantified with flow cytometry (n = 4). i Polyclonal K562-Lat treated with PMAi, GSK484, and CAY10723 for 24 h and quantified with flow cytometry (n = 3). j HIV-1-GFP infected K562 cells with CRISPRi targeting PADI4 or negative control treated with PMAi (n = 3). Data are shown as mean ± SEM. The number of independent experiments is denoted by n. Exact p-values were calculated with two-sided unpaired Student's t tests. Source data are provided as a Source Data file.
Fig. 3
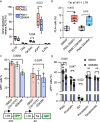
Fig. 3. Citrullinated histone H3 at the HIV-1 provirus stimulated latency reversal.
a H3cit signal at a HIV 5´ LTR locus (HXB2 coordinates: 522-643) in 5A8 cells, measured by ChIP-qPCR (n = 6 for H3, H3cit, IgG; n = 3 for H3cit8, H3cit17). Exact p-values were calculated with two-sided unpaired Student's t tests, with correction for multiple testing by two-stage step-up (Benjamini, Krieger and Yekutieli). b H3 signal at the HIV 5´ LTR locus in 5A8 cells, measured by ChIP-qPCR (n = 3). c Chromatin compaction at the HIV 5´ LTR (n = 5). d Quantification of H3cit at the HIV-1 LTR in 1C10 cells under PMAi and GSK484 treatment using PLA-ZFP assay in 1C10 cells (n = 6). The box plots indicate median (middle line), 25th, 75th percentile (box), as well as minimum and maximum values (whiskers). e Quantification of Histone H3 at HIV-1 LTR in 1C10 cells under PMAi treatment using PLA-ZFP assay (n = 6). f Quantification of different H3cit residues with PLA-ZFP in 1C10 relative to H3 (n = 6 for H3cit2,8,17, n = 3 for the other antibodies). g CUT&Tag seq view of total H3cit after 24 h treatment over the HIV-1 LTR promoter. Gray line indicates TSS (HXB2 coordinate: 454). h Genome browser view of the H3cit signal over the TNFα promoter region. Gray line indicates the TSS. Data are shown as mean ± SEM. The number of independent experiments is denoted by n. Exact p-values were calculated with two-sided unpaired Student's t tests. Source data are provided as a Source Data file.
Fig. 4
Fig. 4. Genome-wide H3cit levels are stable at promoters in 5A8 with HIV-1 preferentially integrating into H3cit chromatin.
a CUT&Tag peak width profile. b Relative enrichment of peaks in genic and non-genic regions. c Metagene plot for DMSO-treated 5A8 samples. d ChromHMM analysis showing similarity between chromatin marks. e Quantification of H3cit mapped onto known proviral integration sites with corresponding proviral activation, H3cit values over 467 latent, 714 productive, 68 reactivatable, 843 non I.S randomly selected genomic positions are plotted. The box plots indicate median (middle line), 25th, 75th percentile (box), as well as minimum and maximum values (whiskers). f Metagene plot with a gene set (146 genes) regulated by T cell activation (“GSE13738 Resting vs TCR activated CD4+ T cell”). The shaded area shows the standard error of the data. Source data are provided as a Source Data file.
Fig. 5
Fig. 5. De novo H3cit has a general effect on HIV-1 transcription, but not through Tat or acetylation.
a RT-qPCR quantification of short initiated (5´-LTR), early elongated unspliced (Gag), multiply spliced (Tat-Rev), and late elongated (GFP) transcripts in 5A8 treated with PMAi and GSK484. Exact p-values were calculated with two-sided paired Student's t tests (n = 5). b Levels of Tat at the HIV-1 promoter in 1C10 cells with PMAi and GSK484 using PLA-ZFP assay. The box plots indicate median (middle line), 25th, 75th percentile (box), as well as minimum and maximum values (whiskers). Exact p-values were calculated with two-sided paired Student's t tests (n = 5). c HIV-1 transcription in Tat negative J-Lat A72 and Tat positive A2 cells treated with PMAi and PADI inhibitors, measured by flow cytometry (n = 3). Exact p-values were calculated with two-sided paired Student's t tests. d 5A8 cells treated with PMAi and other latency reversal agents and GSK484 (n = 9 for PMAi, prostratin; n = 4 for JQ1, romidepsin, panabinostat). Exact p-values were calculated with two-sided paired Student's t tests. Data are shown as mean ± SEM. The number of independent experiments is denoted by n. Source data are provided as a Source Data file.
Fig. 6
Fig. 6. Heterochromatin forms over the HIV-1 provirus in the presence of GSK484.
a H3K9me3 at the HIV-1 locus in 1C10 (ZFP) and 2C10 (ZFP-KRAB) cells measured by ChIP-qPCR. Exact p-values were calculated with two-sided ratio paired t-tests (n = 5 for 1C10, n = 3 for 2C10). b 1C10 and 2C10 cell HIV-1 transcription with PMAi and GSK484 treatment (n = 6). Exact p-values were calculated with two-sided unpaired t-tests. c Tat proximity to HIV-1 promoter in 1C10 and 2C10 cells with PMAi treatment (n = 6 1C10, n = 12 2C10). d H3K9me3 and HP1α levels at the LTR locus in 1C10 measured by ChIP-qPCR (n = 3). e HP1α proximity to the HIV-1 promoter in 1C10 and 2C10 cells with PMAi and PMAi and GSK484 treatment (n = 6). f GFP quantification by flow cytometry of 5A8 TASOR RNAi knockdown and 5A8 VPX overexpression cells (n = 3). Data is shown as mean ± SEM. The number of independent experiments is denoted by n. Exact p-values were calculated with two-sided paired Student's t tests unless otherwise indicated. Source data are provided as a Source Data file.

References

    1. Yukl, S. A. et al. HIV latency in isolated patient CD4(+) T cells may be due to blocks in HIV transcriptional elongation, completion, and splicing. Sci. Transl. Med.10, eaap9927 (2018). - PMC - PubMed
    1. Moron-Lopez, S. et al. Characterization of the HIV-1 transcription profile after romidepsin administration in ART-suppressed individuals. AIDS33, 425–431 (2019). - PMC - PubMed
    1. Dubé, M. et al. Spontaneous HIV expression during suppressive ART is associated with the magnitude and function of HIV-specific CD4+ and CD8+ T cells. Cell Host Microbe31, 1507–1522.e5 (2023). - PMC - PubMed
    1. Einkauf, K. B. et al. Intact HIV-1 proviruses accumulate at distinct chromosomal positions during prolonged antiretroviral therapy. J. Clin. Investig.129, 988–998 (2019). - PMC - PubMed
    1. Jiang, C. et al. Distinct viral reservoirs in individuals with spontaneous control of HIV-1. Nature585, 261–267 (2020). - PMC - PubMed

MeSH terms