. 2025 Jun 25;16(1):5377.
doi: 10.1038/s41467-025-60061-4.

Metabolic reprogramming of the neovascular niche promotes regenerative angiogenesis in proliferative retinopathy

Affiliations

Metabolic reprogramming of the neovascular niche promotes regenerative angiogenesis in proliferative retinopathy

Gael Cagnone et al. Nat Commun. .

Abstract

Healthy blood vessels supply neurons to preserve metabolic function. In blinding proliferative retinopathies (PRs), pathological neovascular tufts often emerge in lieu of needed physiological revascularization. Here we show that metabolic shifts in the neovascular niche define angiogenic fate. Fatty acid oxidation (FAO) metabolites accumulated in human and murine retinopathy samples. Neovascular tufts with a distinct single-cell transcriptional signature highly expressed FAO enzymes. The deletion of Sirt3, an FAO regulator, shifted the neovascular niche metabolism from FAO to glycolysis and suppressed tuft formation. This metabolic transition increased Vegf expression in astrocytes and reprogrammed pathological neovessels to a physiological phenotype, hastening vascular regeneration of the ischemic retina and improving vision. Hence, strategies to change the metabolic environment of vessels could promote a regenerative phenotype in vascular diseases.


Conflict of interest statement

Competing interests: The authors have no conflicts of interest to declare relevant to this article’s content. F.R. is an advisory board member for Bayer AG (Germany) and F. Hoffmann-La Roche AG (Switzerland). P.S. is the founder and Chief Scientific Officer of SemaThera Inc. (Montreal, Canada) and Chief Scientist of UNITY Biotechnology (California, US) and holds equity in both companies.

Figures

Fig. 1
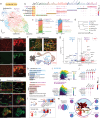
Fig. 1. Fatty-acid oxidation is a hallmark of human proliferative diabetic retinopathy.
a Heatmap of the top 25 most significantly dysregulated metabolites (two-tailed Student’s t-test) from vitreous biopsies of subjects with epiretinal membranes (Control, n = 4) and proliferative diabetic retinopathy (n = 7) by LC/MS/MS. b Metabolite set enrichment analysis of dysregulated metabolites for metabolic pathways and intracellular localisations in proliferative diabetic retinopathy. See also Supplementary Fig. 1 and Supplementary Table 1.
Fig. 2
Fig. 2. Fatty-acid oxidation is enriched in the neovascular unit in mouse proliferative retinopathy.
a Schematic representation of the oxygen-induced retinopathy (OIR) mouse model of proliferative retinopathy. b Heatmap of fatty acylcarnitine metabolites measured in human vitreous and mouse retinas of control (human n = 4, mouse n = 4) and proliferative retinopathy samples (human n = 7, mouse n = 4). c UMAP of single-cell RNAseq from normoxic (n = 6, 21305 cells) and OIR (n = 8, 17814 cells) retinas taken during the neovascularisation period (P14-P17) representing the 11 retinal cell types identified by graph-based clustering of normalized RNA count (GEO accession number GSE150703). d Ridge plot of GSVA score for REACTOME mitochondrial beta-oxidation of saturated fatty acids pathway for OIR cell types at P14 and P17. e Dot plot illustrating the expression levels of genes from the REACTOME pathway related to mitochondrial beta-oxidation of saturated fatty acids across OIR cell types at P14 and P17. f Graphical representation of the vascular unit during the neovascular phase of OIR.
Fig. 3
Fig. 3. Single-cell RNAseq identifies a unique transcriptional signature for neovascular tufts.
a UMAP of endothelial-enriched retinal single-cell RNAseq from normoxic (n = 4, 2094 cells) and OIR (n = 5, 1875 cells) retinas during the neovascular phase (P14-P17). b Dot plot of the top 10 marker genes for each of 6 endothelial subtypes identified on UMAP. c Representation of the percentage of cells within each endothelial subtype, calculated from the total number of endothelial cells for each condition and at each time point. d Hierarchical dendrogram of endothelial subtypes using k-mean Euclidean distances constructed on high variable genes (HVGs). e Immunofluorescence of retinal flat-mounts for AQP1 (green) counterstained with Lectin (red) from normoxia and OIR P17 mice (n = 3 retina each). Scale: 150 μm. f Immunofluorescence of P17 OIR retinal flat-mounts (n = 5 retina) for ESM1 (green) and Lectin (red). Scale: 10 μm. Graphical representation of physiological (tip cells) and pathological (Tuft) angiogenesis during neovascularisation in OIR. g Volcano plot of differentially expressed genes between tuft and tip endothelial cells from P17 OIR retinas (P-value < 0.05, absolute log2 Fold Change (FC) > 0.5, non-parametric two-sided Wilcoxon rank-sum test, percent of expression > 10%, see Source data). h KEGG pathway analysis of up-regulated genes in tip or tuft ECs from panel g (combined Fisher exact test P-value and Benjamini-Hochberg corrected z-score from EnrichR). i Ridge plot of normalized GSVA score for glycolysis (Hallmark) and mitochondrial beta-oxidation of saturated fatty acids (Reactome) pathways in OIR endothelial subtypes at P17. j Dot plot of the most expressed glycolytic and FAO genes from the metabolic pathways in previous panel. k In situ hybridization by RNAscope of P17 OIR retinal cryosection (n = 3 retina) for Aqp1 (red) and Hadha (blue) counterstained with Lectin (green). Scales: 25 μm (top and left middle panels), 10 μm (bottom and right middle panels). l Heat map of GSVA scores for metabolic pathways between EC subtypes (top) and among cell types of the vascular niche in OIR versus normoxic condition (bottom). m Graphical model of the metabolic reliance on FAO and glycolysis of cells of the neovascular niche.
Fig. 4
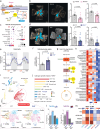
Fig. 4. Targeting FAO curbs pathological neovascular tufts.
a Graphical representation of Sirtuin-3 regulation of mitochondrial FAO. b Lectin-stained retinal flat-mount of P17 OIR treated with vehicle (n = 14 retinas) or etomoxir (n = 13 retinas). Littermate pups were injected intraperitoneally twice daily with etomoxir (27 mg/kg per day) or vehicle (0.9% saline) from P12 to P17. Scale: 500 μm. c Dot plot of retinal Sirt3 expression in OIR (P14 and P17) and EC subtypes (P17), showing only significant increase in astrocytes (12.5%, p = 0.008). d Lectin-stained retinal flat-mount of WT and Sirt3−/− mice (n = 28 retinas each) exposed to the OIR model (P17). Scale: 500 μm. e Metabolic cages were used to measure the O2 consumption (vO2) and CO2 production (vCO2) from 6-month-old WT and Sirt3−/− mice (n = 3 each). Respiratory Exchange Ratio (RER) ≥ 1 indicates carbohydrates as the predominant fuel source. f in vivo glucose uptake in WT and Sirt3−/− retinas (n = 8 each) following OIR. Bar graph shows the mean ( ± SEM) retinal radioactivity counts of 2-[3H] deoxyglucose (DG) tracer relative to WT. DPM: Disintegration per minute. g Graphical representation of fatty acyl-CoA degradation enzymes and their deacetylation by SIRT3. h Heatmap of fatty acylcarnitine metabolites in OIR P14 WT (n = 4 mice) and Sirt3−/− (n = 3 mice) retina from acylcarnitine-targeted metabolomics analysis. i UMAP and j lollipop plot of cell type prioritization score (AUGUR) from single-cell RNAseq of WT (n = 5; 4047 cells) and Sirt3−/− (n = 5; 3639 cells) retinas during the neovascularisation phase of OIR (P14-P17 combined). AUC = area under the curve. k UMAP of endothelial subclusters from WT (n = 5; 1875 cells) and Sirt3−/− (n = 5; 1949 cells) retinas (P14-P17 combined). l Percent of tip (WT = 321 cells, Sirt3−/−=327 cells) and tuft ECs (WT = 16 cells, Sirt3−/−=15 cells) out of the total number of ECs per genotype and time point. m Heatmap representing the log2 fold change of normalized GSVA score for metabolic and angiogenic pathways between WT and Sirt3−/− tip and tuft ECs, and neovascular-related cell types (P14-P17 combined). Bar graph of mean (±SEM) VO (blue) and NV (yellow) areas relative to the total retinal area (b,d). Statistical significance was established using two-tailed Student’s t-tests (b, d, f).
Fig. 5
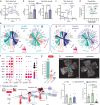
Fig. 5. Sirt3 depletion alters the metabolic and angiogenic landscape of the neovascular niche.
ad Human retinal astrocytes (35000 cells/well) under hypoxia were treated with scrambled siRNA (scrRNA) or siRNA against Sirt3 (siSIRT3) and characterized using a Seahorse metabolic analyzer. a Glycolysis stress tests measured changes in extracellular acidification rates (ECAR, mean ± SEM) to calculate b glycolysis and glycolytic capacity between control (scrRNA, n = 5 wells) and Sirt3-depleted astrocytes (siSIRT3, n = 5 wells). c Mitochondrial stress tests measured changes in oxygen consumption rates (OCR, mean ± SEM) between control (scrRNA, n = 13 wells) and Sirt3-depleted astrocytes (siSIRT3, n = 9 wells). d Energy map of ATP-linked respiration and the glycolytic capacity of scrRNA and siSIRT3 astrocytes (mean ± SEM) from ac. e Circos Plot from NicheNet analysis showing the differential communication between WT and Sirt3-/- neovascular ligands and tip and tuft EC receptors in OIR retinas based on scRNAseq data (P14-P17 combined). Selected ligands were differentially expressed between WT and Sirt3-/- neovascular cells (log2FC > 0.25, % expression > 40%). Selected receptors were differentially expressed between WT and Sirt3-/- tip (left) or tuft (right) ECs (log2FC > 0.25, % expression > 10%). f Dot plot representing the differential expression of selected ligands from WT and Sirt3-/- retinal neovascular cells based on NicheNet analysis. g Bar graph depicting log2 FC of Vegfa expression between Sirt3-/- versus WT cell types of the neovascular unit based on scRNAseq data (P14/P17 combined). h Lectin-stained retinal flat-mount of P17 Sirt3lox/lox mice treated with intravitreal injection of PBS (n = 7 retinas), pAAV.GFAP.GFP (n = 6 retinas) or pAAV.GFAP.Cre (n = 13 retinas) and exposed to the OIR model. Littermate Sirt3lox/lox pups were injected intravitreously at P7, one eye with pAAV.GFAP.cre and the other eye with either PBS or pAAV.GFAP.GFP. Bar graph of VO (blue) and NV (yellow) areas relative to the total retinal area (mean ± SEM). Scale: 500 μm. i Graphical representation of the neovascular niche in proliferative retinopathy. Statistical significance was established using two-tailed Student’s t-test (b) and one-way ANOVA (h) with Tukey post hoc analysis. ns: not significant.
Fig. 6
Fig. 6. Sirt3 deletion reprograms early neovascular tufts for regenerative angiogenesis.
a Bar plot representing the ratio of tip to tuft ECs (left) and inversely (right) during the neovascularisation period (P14-P17) in WT and Sirt3−/− OIR retinas. b UMAP of single-cell RNAseq from WT and Sirt3−/− neovascular cells (tip cells and tuft ECs) during the neovascularisation phase (P14-P17), showing the connectivity between cells through a trajectory analysis performed with Monocle 3. c Ridge plot of Tip and Tuft ECs from OIR WT and Sirt3−/− retinas at P14 and P17 representing the normalized GSVA score for the Physiological angiogenesis gene set as previously defined from the Tip cell vs Tuft ECs signature (Fig. 3h). d Dot plot of gene expression in tip and tuft ECs from P14 OIR WT and Sirt3−/− retinas for Tip and Tuft ECs-related pathways as previously defined from the tip cell vs tuft ECs signature (Fig. 3g). e Representative images of tip cells forming motile filopodia in WT OIR and Sirt3−/− OIR retinas at P14; staining with lectin. Quantification of the average number (±SEM) of filopodia per tip cells in WT (n = 25 tip cells) and Sirt3−/− (n = 10 tip cells) retinas exposed to OIR. Scale: 10 μm. f Lectin-stained retinal flat-mount of WT and Sirt3−/− mice exposed to the OIR model. The VO areas (blue) are calculated relative to the total retinal area. Scale: 500 μm. Bar graphs show the average percentage (±SEM) of retinal revascularization of max VO relative to P12 WT. We compared Sirt3−/− (P12 n = 26 retinas, P14 n = 18 retinas, P17 n = 30 retinas) to WT (P12 n = 26 retinas, P14 n = 24 retinas, P17 n = 28 retinas) retinas at each timepoints. g Graph of PhNR at 10 cd.s/m2 from P21 OIR WT (n = 8) and Sirt3−/− (n = 14) retinas. Bar graphs show the average amplitudes (±SEM) in WT and Sirt3−/− for global b-wave, PhNR to baseline and global PhNR. Statistical significance was determined using two-tailed Student’s t-tests (eg).

References

    1. Sapieha, P. et al. Retinopathy of prematurity: understanding ischemic retinal vasculopathies at an extreme of life. J. Clin. Invest.120, 3022–3032 (2010). - PMC - PubMed
    1. Manavski, Y. et al. Clonal expansion of endothelial cells contributes to ischemia-induced neovascularization. Circ. Res.122, 670–677 (2018). - PubMed
    1. Duh, E. J., Sun, J. K. & Stitt, A. W. Diabetic retinopathy: current understanding, mechanisms, and treatment strategies. JCI Insight2, e93751 (2017). - PMC - PubMed
    1. Selvam, S., Kumar, T. & Fruttiger, M. Retinal vasculature development in health and disease. Prog. Retin. Eye Res.63, 1–19 (2018). - PubMed
    1. Joyal, J. S., Gantner, M. L. & Smith, L. E. H. Retinal energy demands control vascular supply of the retina in development and disease: The role of neuronal lipid and glucose metabolism. Prog. Retin Eye Res.64, 131–156 (2018). - PMC - PubMed

MeSH terms

LinkOut - more resources