. 2025 Jun 25;16(1):5392.
doi: 10.1038/s41467-025-60910-2.

Obesity drives depot-specific vascular remodeling in male white adipose tissue

Affiliations

Obesity drives depot-specific vascular remodeling in male white adipose tissue

Sana S Hasan et al. Nat Commun. .

Abstract

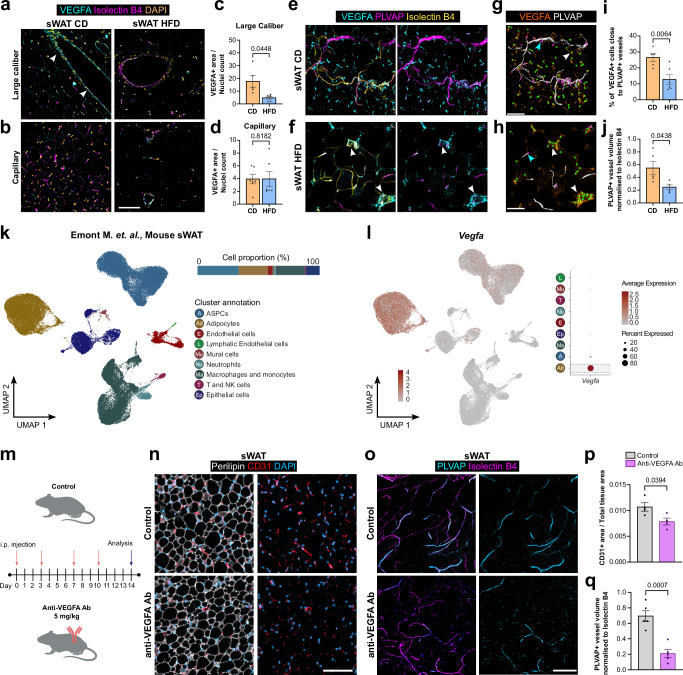
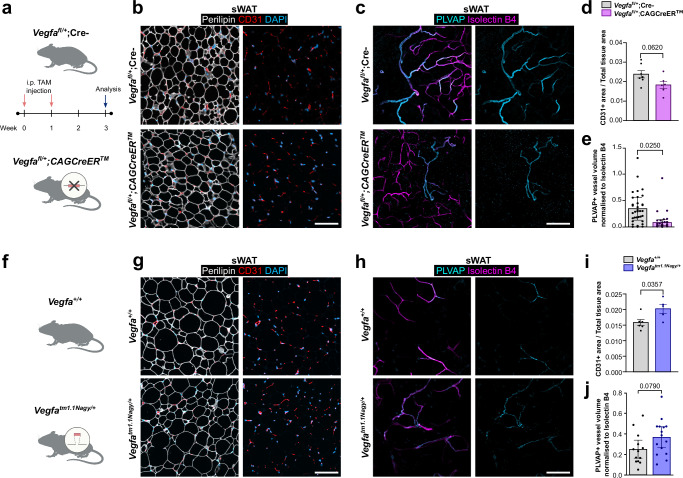
Obesity-driven pathological expansion of white adipose tissue (WAT) is a key driver of endothelial dysfunction. However, early vascular alterations associated with over-nutrition also serve to exacerbate WAT dysfunction. Here, we conduct a single-cell transcriptomic analysis of WAT endothelium to delineate endothelial heterogeneity and elucidate vascular alterations and its consequence in a male murine model of obesity. We demarcate depot-specific differences in subcutaneous (sWAT) and visceral WAT (vWAT) endothelium through in sillico analysis and further corroboration of our findings. Moreover, we identify a sWAT-specific fenestrated endothelial cell (EC) subtype, which declines in obese conditions. Utilizing systemic anti-VEGFA blockade and genetic Vegfa manipulation, we demonstrate that VEGFA is necessary for maintaining fenestration in sWAT. Additionally, we detect this fenestrated EC subtype in male human WAT, which undergoes reduction in individuals with obesity. Collectively, this atlas serves as a valuable tool for future studies to decipher the functional significance of different WAT EC subtypes.


Conflict of interest statement

Competing interests: C.K.—Roche: Employment, patents/royalties, stock ownership. The remaining authors declare no competing interest.

Figures

Fig. 1
Fig. 1. Single cell transcriptome of adipose tissue-derived endothelial cells.
a Representative confocal images showing CD31+ (orange) blood vessels and DAPI+ (cyan) nuclei in subcutaneous white adipose tissue (sWAT) or visceral WAT (vWAT) sections from mice fed either a control diet (CD) or high fat diet (HFD) for 8 weeks. b Quantification of blood vessel (CD31+) area in sWAT (CD n = 5, HFD n = 6 mice). c Quantification of blood vessel (CD31+) area in vWAT (CD n = 5, HFD n = 6 mice). d Comparison of vessel density in lean sWAT vs vWAT (sWAT n = 5, vWAT n = 5 mice). e Uniform manifold approximation and projection (UMAP) clustering of cells obtained from sWAT and vWAT from CD and HFD fed mice (dotted line represents clusters not discussed further). f Dot plot depicting top enriched marker genes in annotated clusters. The color intensity of each dot represents the level of marker expression, whereas the dot size reflects the percentage of endothelial cells (ECs) expressing the marker within the EC subcluster. g Demultiplexed UMAP of ECs in different depots in lean (CD) and obese mice (HFD). h Differential clustering of ECs in different depots and conditions. i Percentage of cells belonging to each annotated cluster under different condition and depots (CD n = 3, HFD n = 3 mice). Scale bar 200 µm. Data represents ± SEM, two-sided Welch’s t-test (bd); two-way ANOVA with Tukey’s multiple comparison test (i). Source data are provided as a Source Data file.
Fig. 2
Fig. 2. Obesity associated vascular morphogenesis and remodeling in vWAT.
a Bioplanet annotated pathways upregulated in Cap I endothelial cells (ECs). b Gene ontology (GO) analysis showing enriched biological processes in Cap I ECs. c TTRUST transcription factor (TF) analysis predicting upstream regulators in Cap I ECs. d Bioplanet annotated pathways upregulated in Cap II ECs. e GO term analysis showing enriched biological processes in Cap II ECs. f TTRUST TF analysis predicting upstream regulators in Cap II ECs. g Bioplanet predicted pathways upregulated in Cap II when directly compared to Cap I in visceral white adipose tissue (vWAT) ECs. h GO terms enriched in Cap II ECs when compared to Cap I vWAT ECs. i TTRUST TF analysis depicting differentially enriched regulators in Cap II vWAT ECs when compared to Cap I vWAT ECs. j Upregulated pathways k enriched GO terms and l predicted TFs in venous ECs in obese (high fat diet, HFD) vs lean (control diet, CD) vWAT. m Upregulated pathways n enriched GO terms and o predicted TFs in arterial ECs in obese (HFD) vs lean (CD) vWAT. Fisher’s exact test (a-o). All schematics created in BioRender. Hasan, S. (2025) https://BioRender.com/ossmape. Source data are provided as a Source Data file.
Fig. 3
Fig. 3. Obesity driven vascular alterations in sWAT.
a Dot plot depicting enriched marker genes in Cap III endothelial cells (ECs). b Quantitative real-time PCR detection of collagen genes in subcutaneous white adipose tissue (sWAT) ECs isolated from lean (control diet, CD n = 11 mice) and obese (high fat diet, HFD n = 11 mice) animals. c Bioplanet annotated upregulated pathways in Cap III ECs. d Gene ontology (GO) terms enriched in Cap III ECs. e TTRUST transcription factor (TF) analysis of upstream regulators in Cap III ECs. f Upregulated pathways g enriched GO terms and h predicted TFs in venous ECs in obese (high fat diet, HFD) vs lean (control diet, CD) sWAT. i Upregulated pathways j enriched GO terms and k predicted TFs in arterial ECs in obese (HFD) vs lean (CD) sWAT. Data represents ± SEM and two-sided Mann-Whitney test (b), Fisher’s exact test (ck). All schematics created in BioRender. Hasan, S. (2025) https://BioRender.com/0eux7g4. Source data are provided as a Source Data file.
Fig. 4
Fig. 4. Fenestrated endothelium in sWAT.
a Dot plot depicting enriched marker genes in fenestrated endothelial cells (ECs). b Quantitative real-time PCR detection of marker genes of fenestration in subcutaneous white adipose tissue (sWAT) ECs isolated from lean (control diet, CD n = 11 mice) and obese (high fat diet, HFD n = 11 mice) animals. c Representative orthogonal projections from whole mount staining for PLVAP (magenta) performed on sWAT from Esm1:Cre-ERT2 x mTmG reporter mice. Upon tamoxifen treatment, the reporter switches from tdtomato (yellow) to GFP (cyan). GFP+ blood vessels are also PLVAP+ (arrowheads). d Scanning electron micrograph showing fenestrae (see insets) in sWAT ECs in vitro. e Bioplanet annotated upregulated pathways in fenestrated ECs. f Gene ontology (GO) terms enriched in fenestrated ECs. g TTRUST transcription factor analysis (TF) of upstream regulators in fenestrated ECs. h Ingenuity pathway analysis (IPA) on differentially expressed marker genes in this cluster. Asterisk denotes VEGFA signaling. Orange and blue graphics represent predicted activation and inhibition, respectively. Straight lines and dotted lines represent direct or indirect interaction, respectively. ik Violin plot depicting Vegf receptor levels in sWAT ECs in lean (CD) and obese (HFD) mice. l Quantitative real-time PCR detection of Vegf receptors and m Vegfa in sWAT ECs isolated from lean (CD n = 11 mice) and obese (HFD n = 11 mice) animals. Scale bar 100 µm. Data represents ± SEM, two-sided Welch’s t-test (b, l), Fisher’s exact test (eg), two-sided Mann-Whitney test (m). Schematics created in BioRender. Hasan, S. (2025) https://BioRender.com/7rbmeru. Source data are provided as a Source Data file.
Fig. 5
Fig. 5. VEGFA expression in adipose tissue and effect of systemic VEGFA blockage on fenestrated endothelium.
a Representative confocal images of VEGFA (cyan) and Isolectin B4 (magenta) staining in subcutaneous white adipose tissue (sWAT) sections around large vessels (arrowheads) or b capillary beds in lean (control diet, CD) and obese (high fat diet, HFD) mice. c Quantification of VEGFA+ area around large vessels (CD n = 5, HFD = 6 mice) or d capillary beds (CD n = 6, HFD = 6 mice). e Representative orthogonal projections from whole mount staining for VEGFA (cyan), PLVAP (magenta), and isolectin B4 (yellow) in sWAT in lean and f obese mice. g Volumetric reconstruction of PLVAP+ blood vessels showing relative distance of VEGFA+ cells to rendered blood vessel in lean and h obese mice. VEGFA+ cells close to (<10 µm, magenta spheres, blue arrowhead) or away from (>10 µm, green spheres, white arrowhead) traced blood vessel are depicted. i Quantification of VEGFA+ cells close to PLVAP+ blood vessels in lean (n = 5 mice) and obese (n = 6 mice) animals. j Quantification of PLVAP+ blood vessel in lean (n = 5 mice) and obese (n = 5 mice) animals. k Uniform manifold approximation and projection (UMAP) of clusters formed by 91,097 cells of murine sWAT generated by Emont M. et al., (single nucleus RNA sequencing) depicting cell proportion and annotation. l Feature plot and dot plot showing expression of Vegfa in murine dataset. m Schematic representation of control or anti-VEGFA antibody (Ab) treatment regimen. n Representative confocal images showing CD31+ (red) blood vessels, Perilipin+ (white) adipocyte and DAPI+ (cyan) nuclei in sWAT sections from mice injected with control or anti-VEGFA Ab. o Representative orthogonal projections from whole mount staining for PLVAP (cyan) and isolectin B4 (magenta) in sWAT from mice injected with control or anti-VEGFA Ab. p Quantification of blood vessel (CD31 + ) area in (n) (n = 4 mice each). q Quantification of PLVAP+ blood vessel volume in (o) (n = 5 mice each). Scale bars 100 µm. Data represents ± SEM, two-sided Mann-Whitney test (d) and two-sided Welch’s t-test (c, i, j, p, q). Schematics created in BioRender. Hasan, S. (2025) https://BioRender.com/k8kxui3. Source data are provided as a Source Data file.
Fig. 6
Fig. 6. Effect of genetic loss and gain of Vegfa function on fenestrated endothelium.
a Schematic representation of tamoxifen (TAM) treatment for Vegfa loss-of-function mice. b Representative confocal images showing CD31+ (red) blood vessels, Perilipin+ (white) adipocyte and DAPI+ (cyan) nuclei in subcutaneous white adipose tissue (sWAT) sections from Vegfafl/+ mice lacking Cre (n = 7 mice) and Vegfafl/+;CAGCreERTM mice (n = 6 mice). c Representative orthogonal projections from whole mount staining for PLVAP (cyan) and isolectin B4 (magenta) in sWAT from Vegfafl/+ mice lacking Cre (n = 6 mice) and Vegfafl/+;CAGCreERTM mice (n = 6 mice). d Quantification of blood vessel (CD31+) area in (b). e Quantification of PLVAP+ blood vessel normalized to isolectin B4 in (c). Each dot represents one imaged area (control-34 maximum intensity projections analyzed from 6 mice, Vegfa loss-of-function-36 maximum intensity projections analysed from 6 mice). f Schematic representation of Vegfa gain-of-function mice. g Representative confocal images showing CD31+ (red) blood vessels, Perilipin+ (white) adipocyte and DAPI+ (cyan) nuclei in sWAT sections from Vegfa+/+ mice (n = 6 mice) and Vegfatm1.1Nagy/+ mice (n = 5 mice). h Representative orthogonal projections from whole mount staining for PLVAP (cyan) and isolectin B4 (magenta) in sWAT from Vegfa+/+ mice (n = 4 mice) and Vegfatm1.1Nagy/+ mice (n = 4 mice). i Quantification of blood vessel (CD31+) area in (g). j Quantification of PLVAP+ blood vessel normalized to isolectin B4 in (h). Each dot represents one imaged area (control-13 maximum intensity projections analyzed from 4 mice, Vegfa gain-of-function-15 maximum intensity projections analysed from 4 mice). Scale bars 100 µm. Data represents ± SEM, two-sided Welch’s t-test (d, i), linear regression with cluster-robust standard errors (e, j). Schematics created in BioRender. Hasan, S. (2025) https://BioRender.com/e743pdb. Source data are provided as a Source Data file.
Fig. 7
Fig. 7. Fenestrated endothelium in human sWAT.
a Representative confocal images showing ITM2A+ (yellow) endothelial cells (ECs) and CD31+ (red) blood vessels in human subcutaneous white adipose tissue (sWAT) from lean human or patients with obesity. b Representative confocal images showing ITM2A+ (yellow) ECs and CD31+ (red) blood vessels in human visceral white adipose tissue (vWAT) from lean human or patients with obesity. c Quantification of ITM2A+ area normalized to CD31+ area for sWAT (lean donors n = 5, patient with obesity n = 5). d Quantification of ITM2A+ area normalized to CD31+ area for vWAT (lean donors n = 4, patient with obesity n = 5. Schematics created in BioRender. Hasan, S. (2025) https://BioRender.com/4t8j1lu. e Graphical summary of obesity-associated vascular alterations in sWAT and vWAT ECs. Graphical summary created in BioRender. Hasan, S. (2025) https://BioRender.com/5ghaxuk. Scale bars 100 µm. Data represents ± SEM, two-sided Welch’s t-test. Source data are provided as a Source Data file.

References

    1. Jehan, S. et al. Energy imbalance: obesity, associated comorbidities, prevention, management and public health implications. Adv. Obes. Weight Manag. Control10, 146–161 (2020). - PMC - PubMed
    1. Cohen, P. & Spiegelman, B. M. Cell biology of fat storage. Mol. Biol. Cell27, 2523–2527 (2016). - PMC - PubMed
    1. Crewe, C., An, Y. A. & Scherer, P. E. The ominous triad of adipose tissue dysfunction: inflammation, fibrosis, and impaired angiogenesis. J. Clin. Investig.127, 74–82 (2017). - PMC - PubMed
    1. White, U. A. & Tchoukalova, Y. D. Sex dimorphism and depot differences in adipose tissue function. Biochim. Biophys. Acta1842, 377–392 (2014). - PMC - PubMed
    1. Norreen-Thorsen, M. et al. A human adipose tissue cell-type transcriptome atlas. Cell Rep.40, 111046 (2022). - PubMed

MeSH terms

Substances

LinkOut - more resources