. 2025 Jun 25:10.1038/s41551-025-01416-6.
doi: 10.1038/s41551-025-01416-6. Online ahead of print.

Self-organization of sinusoidal vessels in pluripotent stem cell-derived human liver bud organoids

Affiliations

Self-organization of sinusoidal vessels in pluripotent stem cell-derived human liver bud organoids

Norikazu Saiki et al. Nat Biomed Eng. .

Abstract

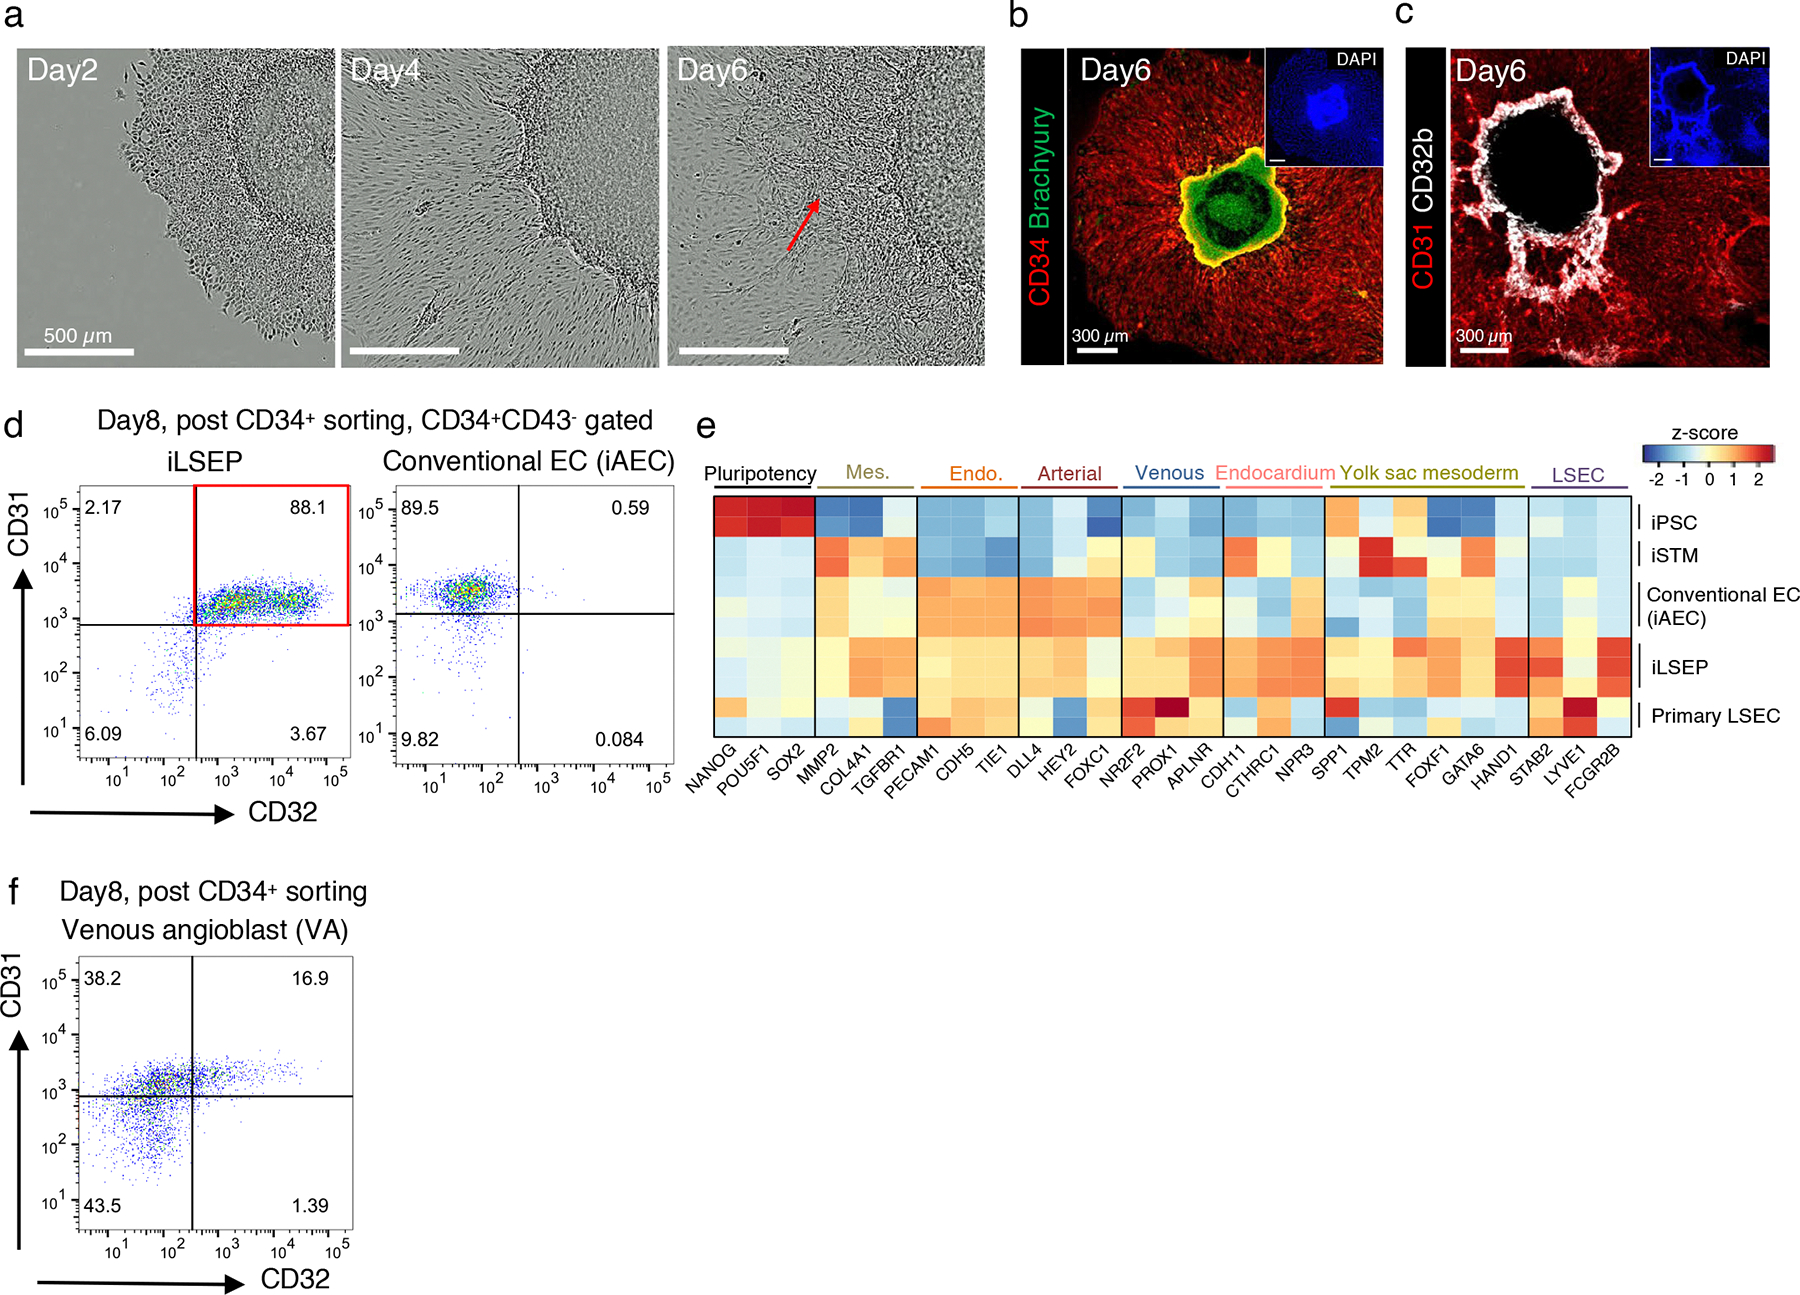
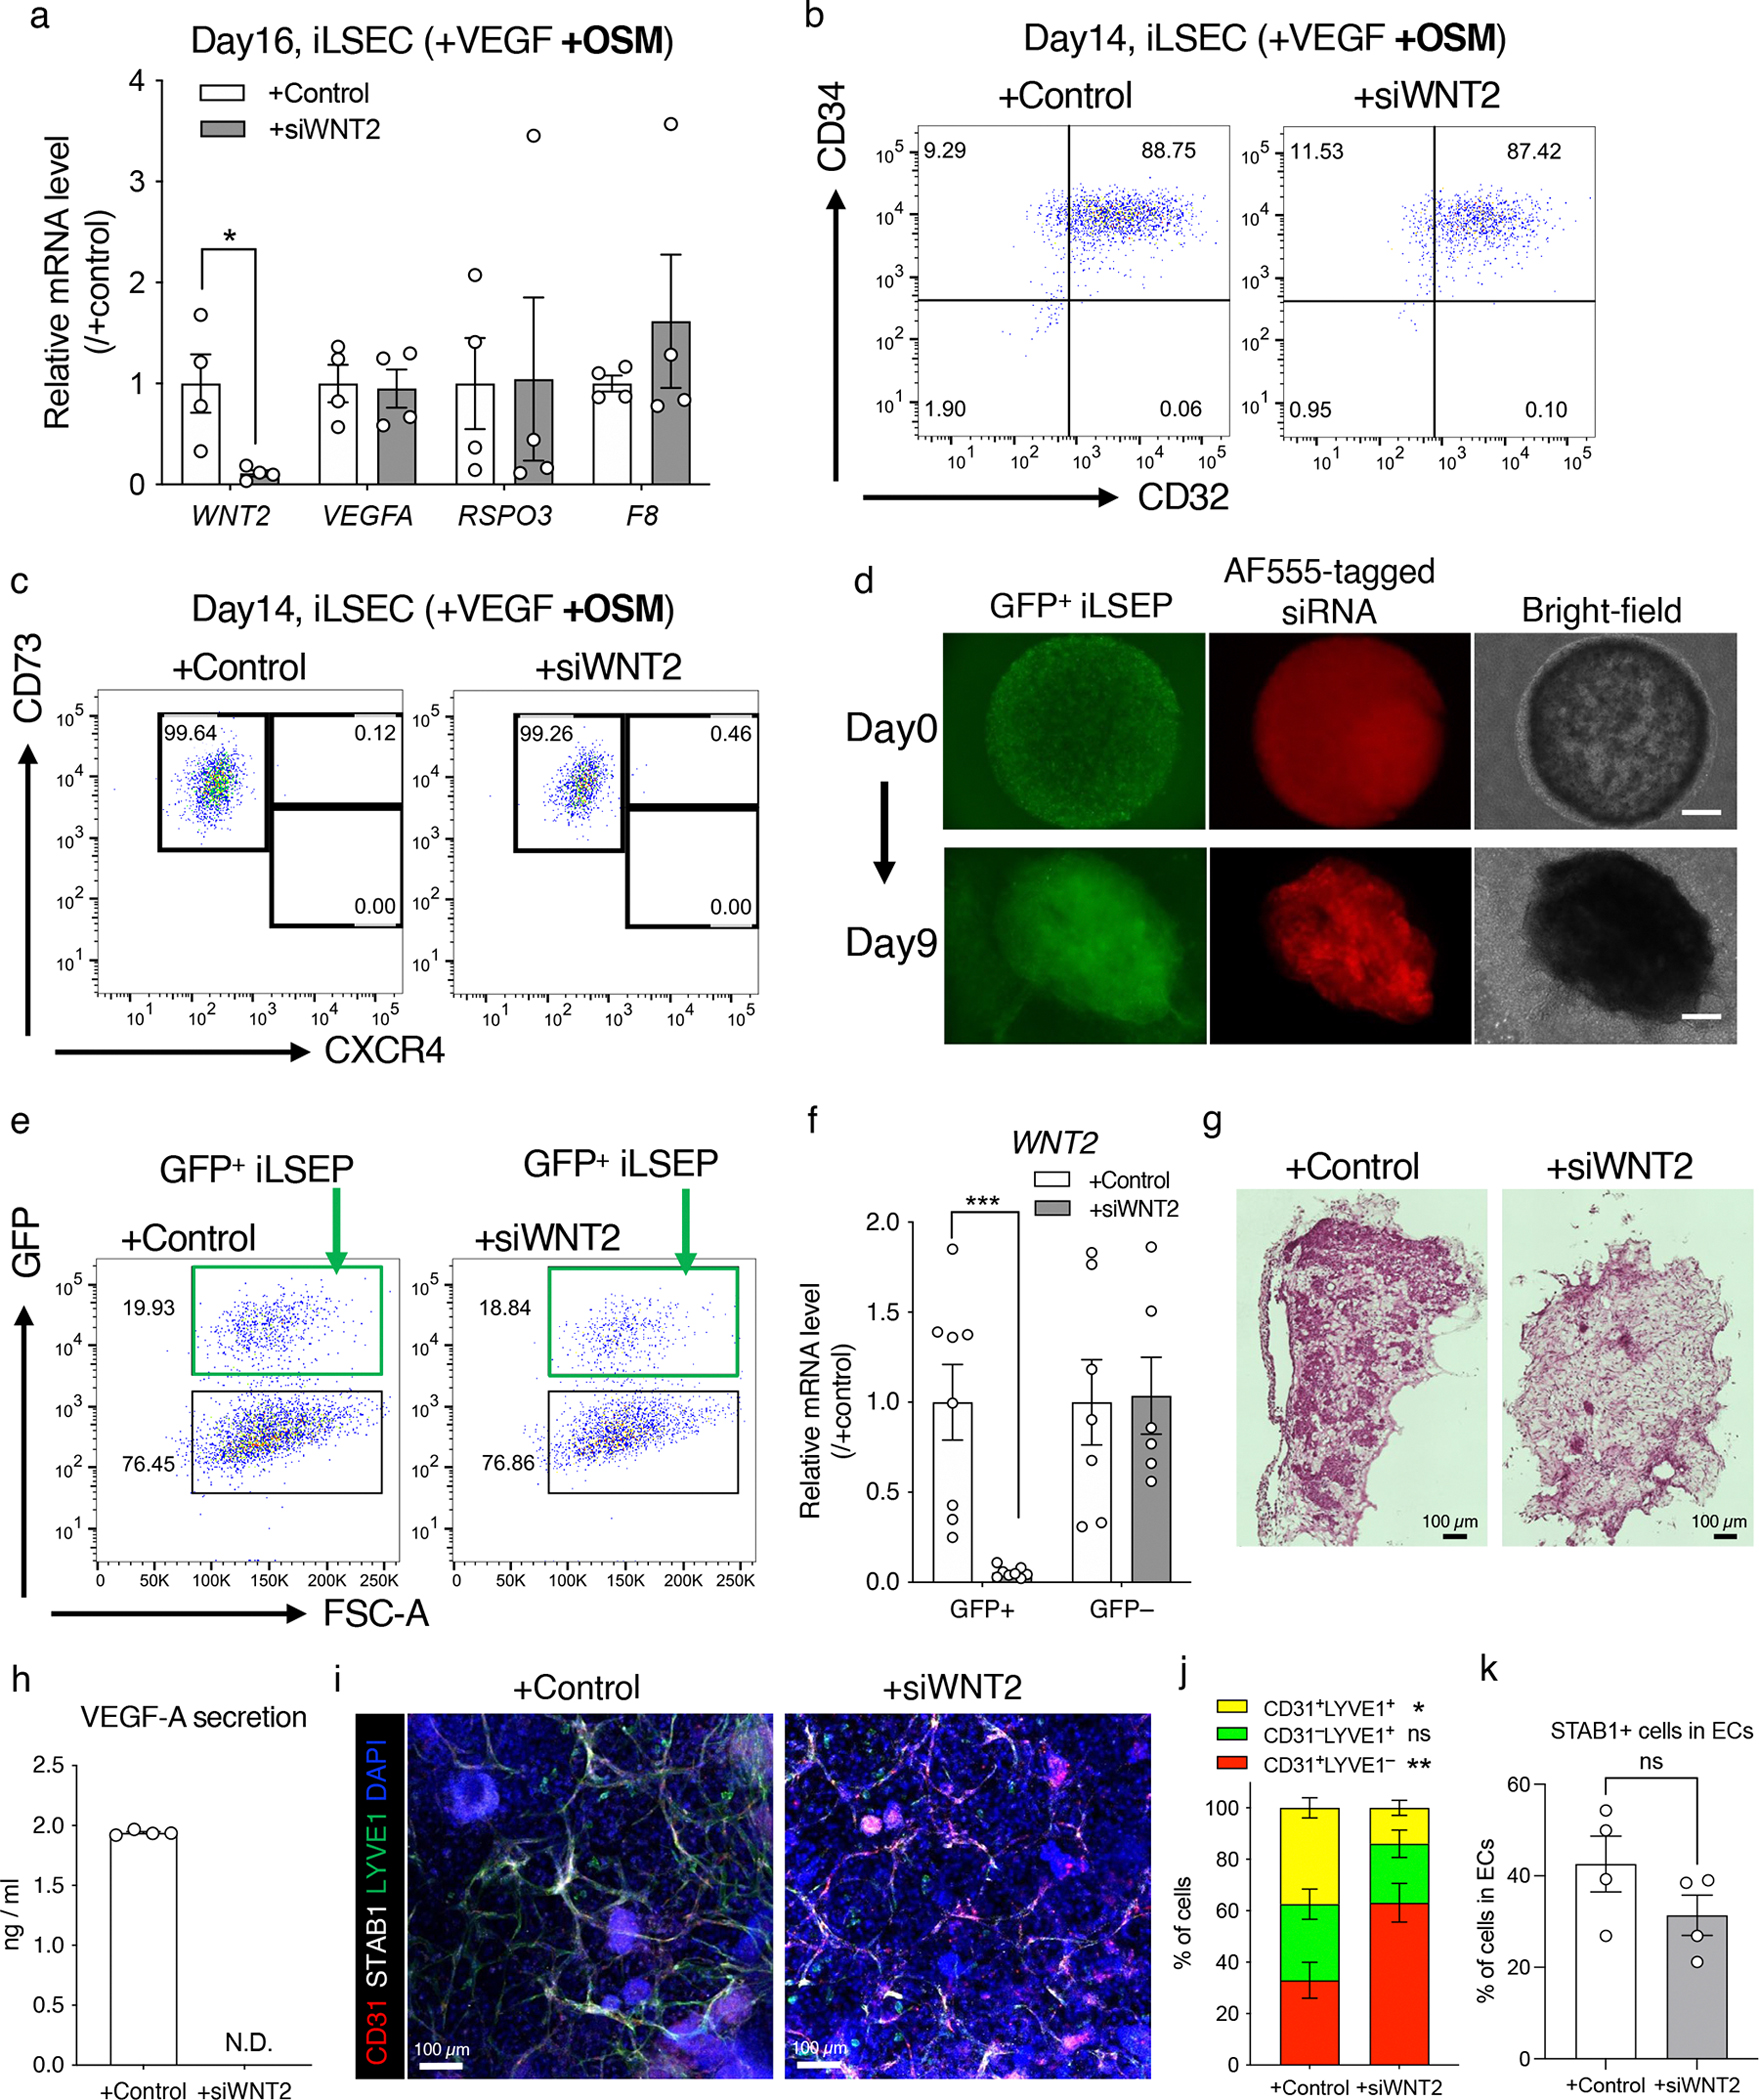
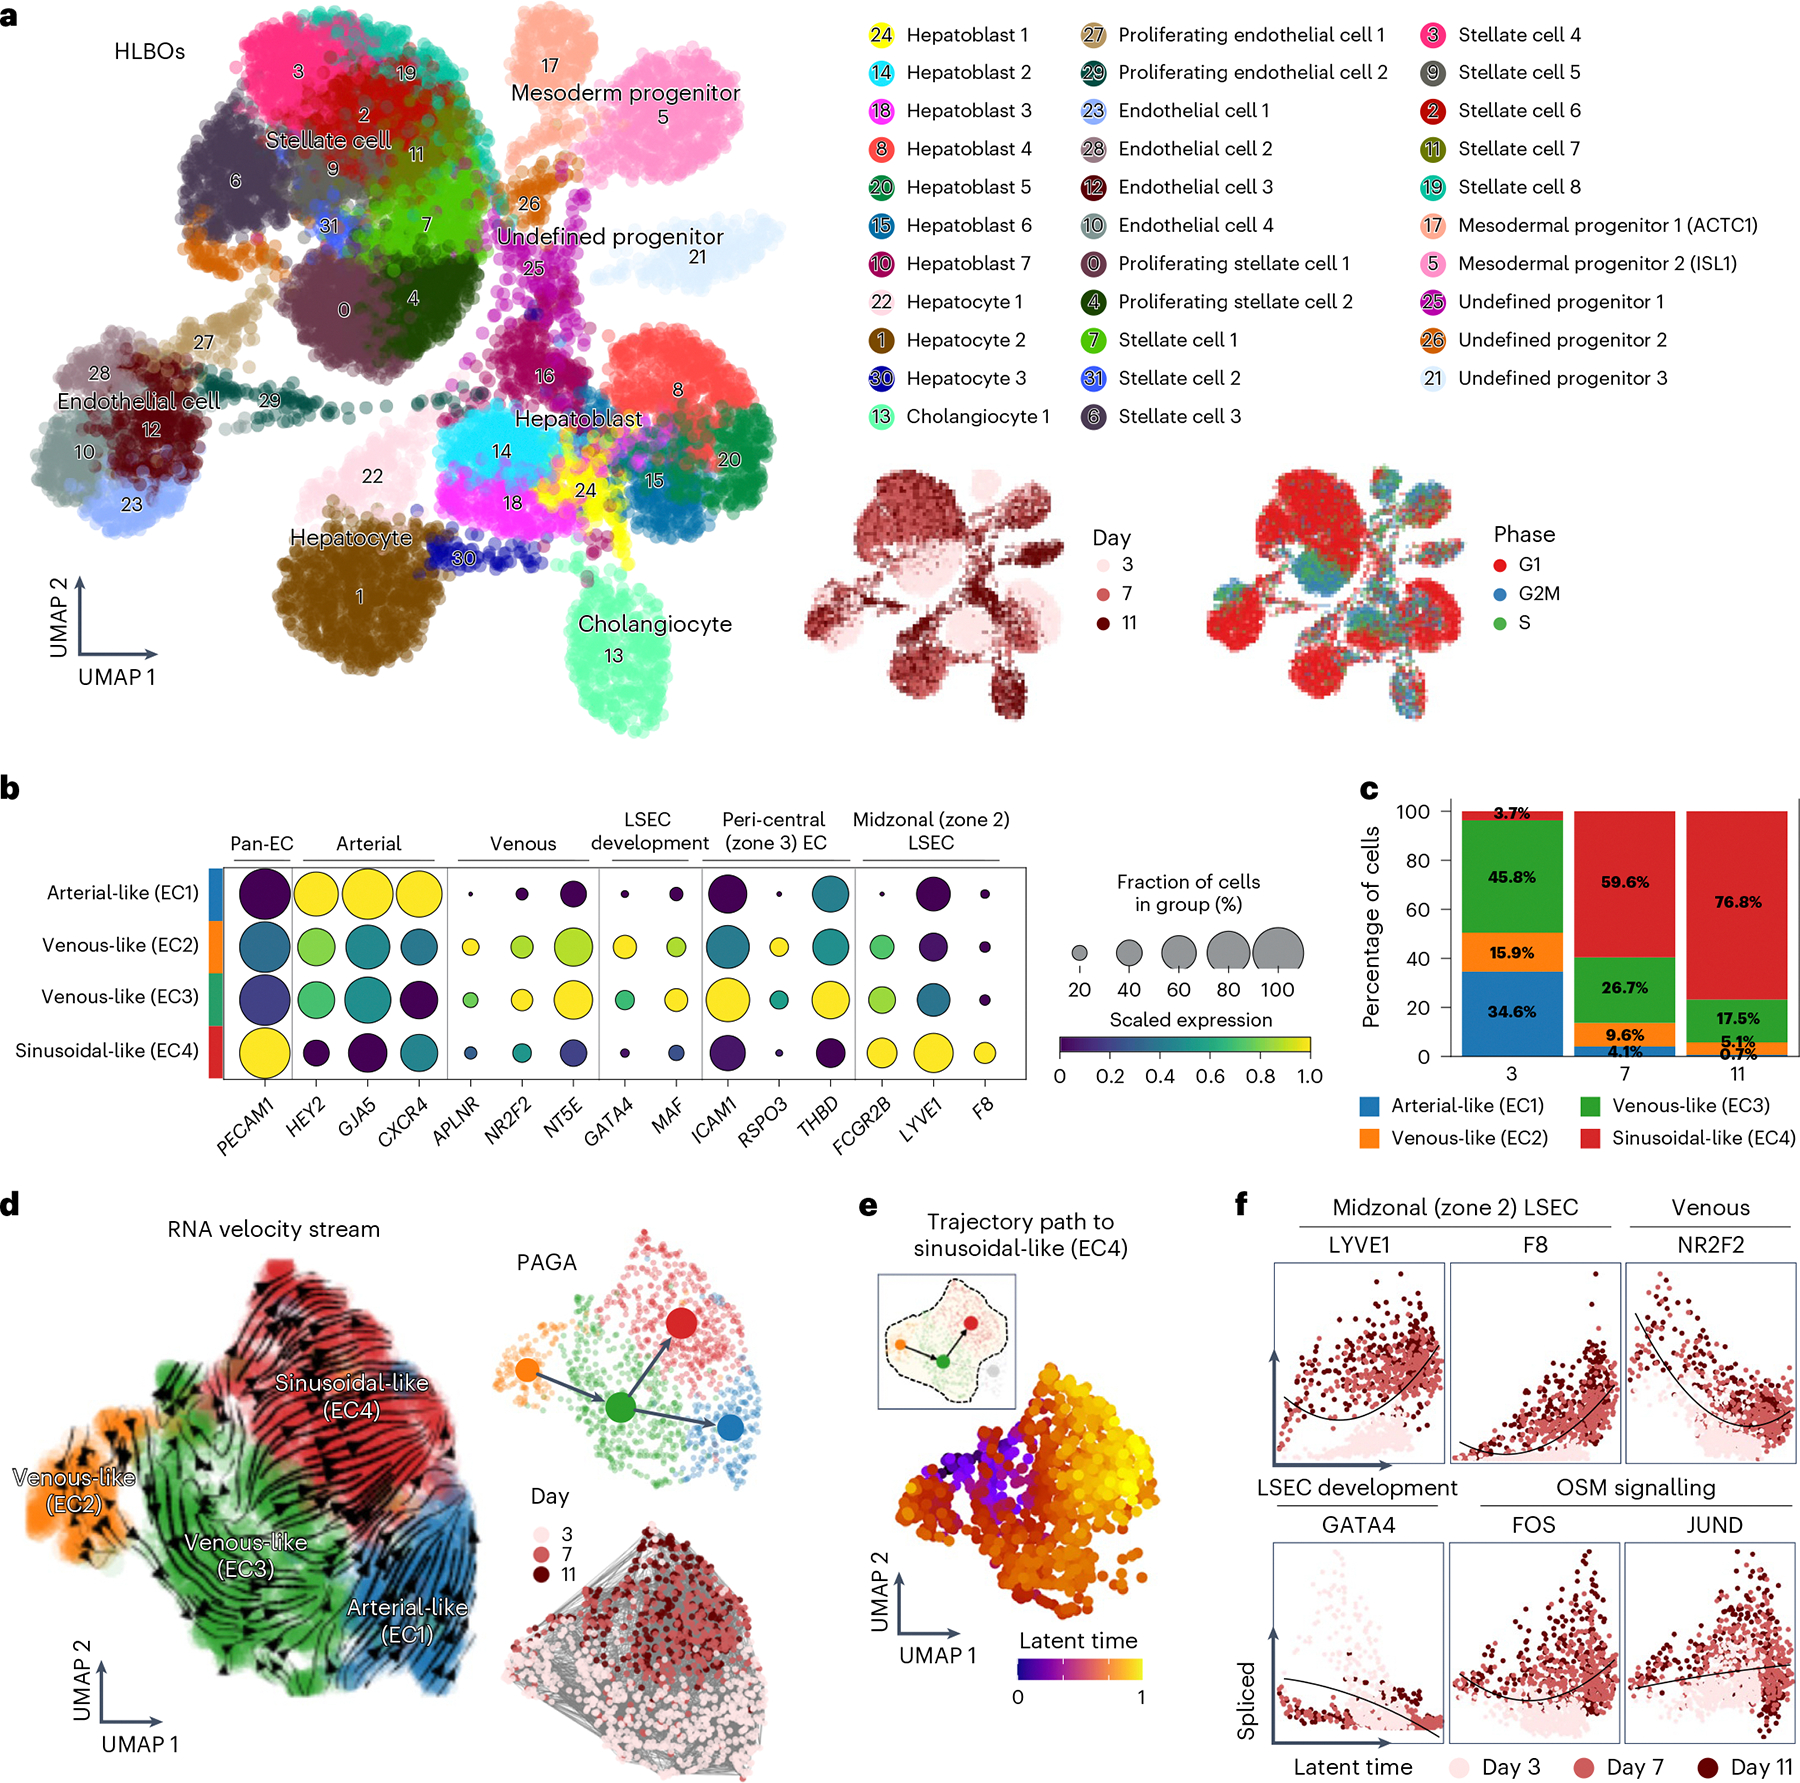
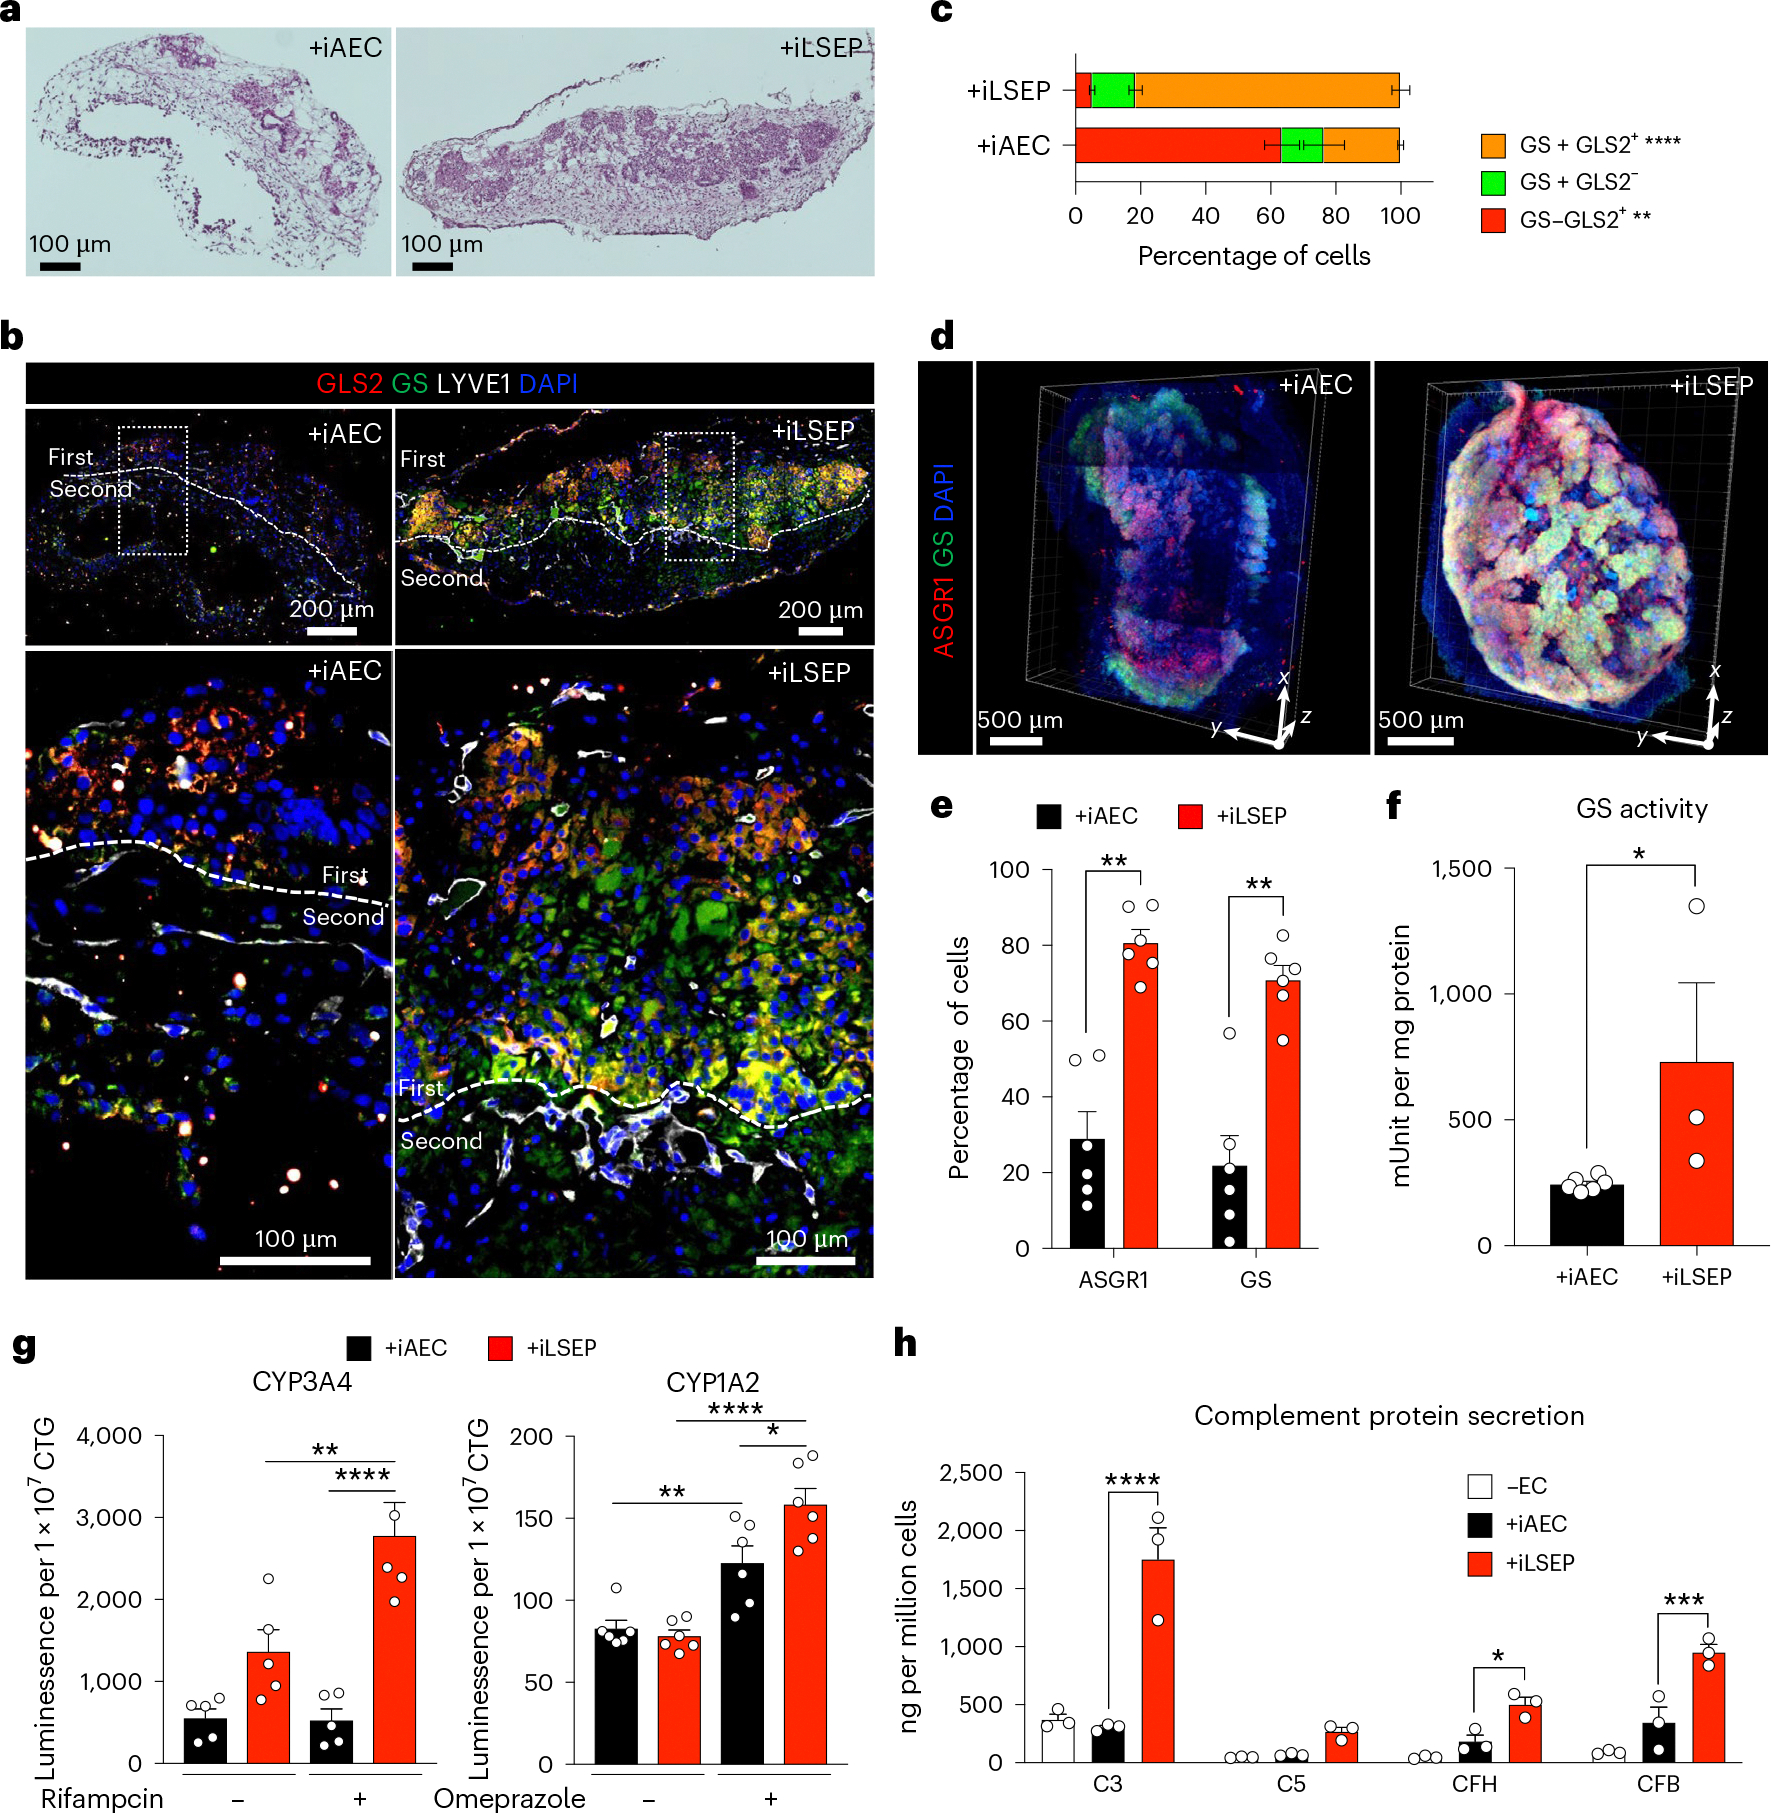
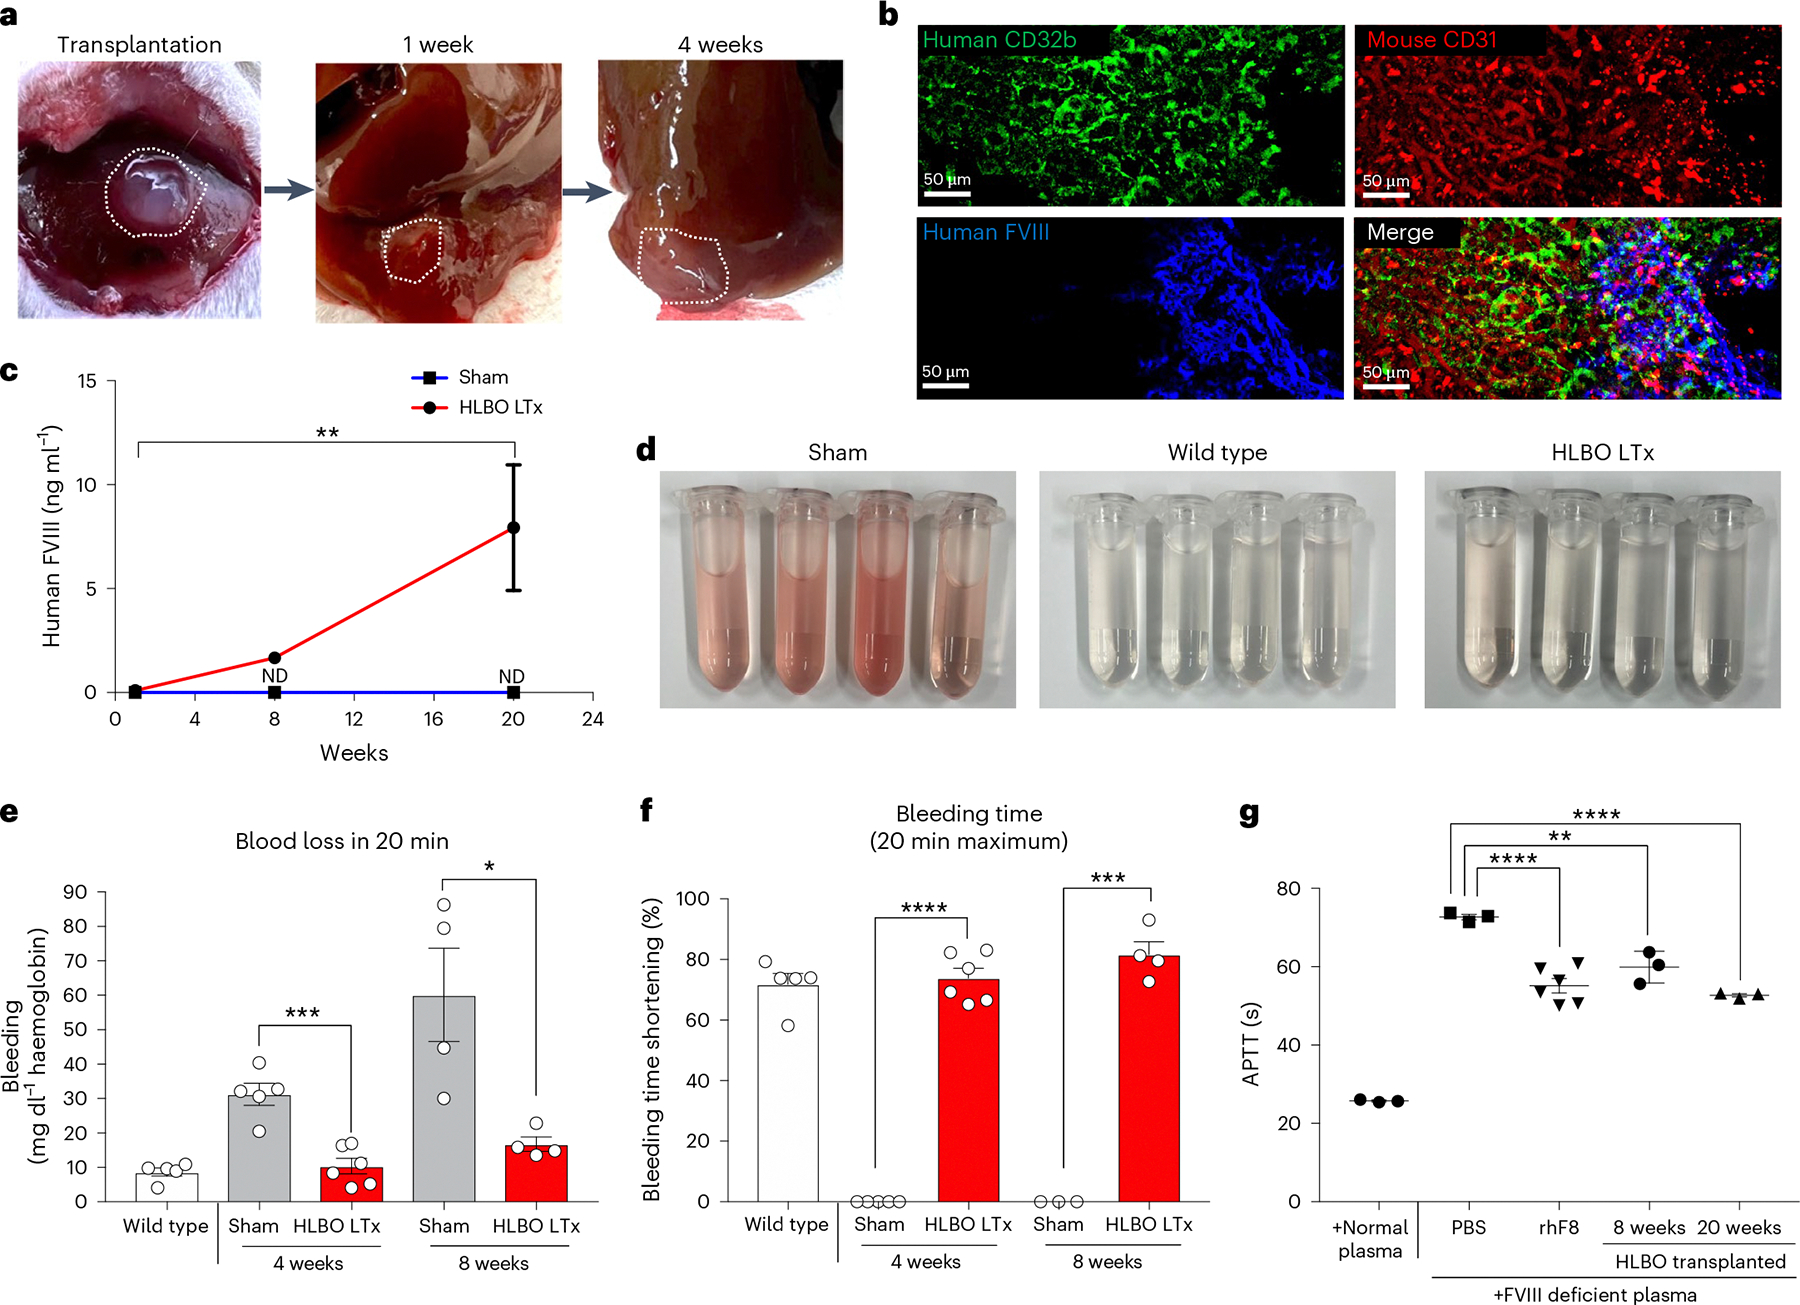
The induction of tissue-specific vessels in in vitro living tissue systems remains challenging. Here, we directly differentiated human pluripotent stem cells into CD32b+ putative liver sinusoidal progenitors by dictating developmental pathways. By devising an inverted multilayered air-liquid interface culture, hepatic endoderm, septum mesenchyme, arterial and sinusoidal quadruple progenitors self-organize to generate and sustain hepatocyte-like cells neighboured by divergent endothelial subsets composed of CD32blowCD31high, LYVE1+STAB1+CD32bhighCD31lowTHBD-vWF- and LYVE1-THBD+vWF+ cells. WNT2 mediates sinusoidal-to-hepatic intercellular crosstalk potentiating hepatocyte differentiation and branched endothelial network formation. Intravital imaging reveals the iPS-cell-derived putative liver sinusoidal endothelial progenitor develops fully perfused human vessels with functional sinusoid-like features. Organoid-derived hepatocyte- and sinusoid-derived coagulation factors enable correction of in vitro clotting time with Factor V-, VIII-, IX- and XI-deficient plasma, and rescues the severe bleeding phenotype in haemophilia A mice on transplantation. Advanced organoid vascularization technology allows for interrogating key insights governing organ-specific vessel development, paving the way for coagulation disorder therapeutics.


Conflict of interest statement

Competing interests: N.S. and T.T. are the inventors of the patent applications WO2020203713A1 and WO2022230919A1. N.S., E.K. and T.T. are the inventors of the patent application WO2020175594A1. T.T. received research funding from Takeda Pharmaceutical Company, Ltd. Y.N., E.K., T.K. and M.F. are employees of Takeda Pharmaceutical Company, Ltd. The other authors declare no competing interests.

Figures

Extended Data Fig. 1 |
Extended Data Fig. 1 |. Directed differentiation and characterization of iLSEP.
a) Time-lapse morphological representation of differentiation of iLSEP in micropatterned colony. Red arrows indicate expanding CD34+ endothelial regions (together with Extended Data Fig. 1b). b) Immunofluorescent staining for CD34 and Brachyury at day6. c) Immunofluorescent staining for CD31 and CD32b at day6. d) Scatter dot-plot of the flow cytometry analysis of CD31/CD32 expression in CD34+CD43 iLSEP and iAEC after CD34+ purification at day 8. CD43 is a marker to exclude fractions of the hematopoietic population. e) Heatmap of iPSC, iSTM, conventional EC (iAEC), iLSEP, and primary LSEC showing lineage marker gene set. Mes.: Mesenchyme; Endo.: pan-endothelium; LSEC: liver sinusoidal endothelial cell. f) Scatter dot-plot of the flow cytometry analysis of CD31/CD32 expression in CD34+CD43 VA at day8.
Extended Data Fig. 2 |
Extended Data Fig. 2 |. Induction of LSEPs into LSECs by OSM, guided by single-cell analysis of endothelial development.
a) Integrated uniform manifold approximation and projection (UMAP) plot of ECs in fetal and adult organs showing yolk sac EC (4 post conception weeks (PCW)), endocardium in fetal heart (4 PCW), fetal liver EC (Early; 7 PCW, Mid; 8–12 PCW and Late; 13−17 PCW), and LSEC zone 2 and 3 in adult liver. The black arrow curve represents the direction of the trajectory based on pseudo-temporal analysis (together with Extended Data Fig. 2b). b) The pseudo-time trajectory of endothelial development to LSEC in adult liver. c) Pseudo-kinetic plots of the expression of markers in different organ groups. d) The aggregate expression level of all genes in gene module, a cluster of genes showing shared expression dynamics among the populations in trajectory, of fetal (early, mid, and late) liver and late fetal + adult liver projected on UMAP. e) Top significantly enriched pathways on dynamics of fetal liver module and late fetal + adult liver module. f) The schema of hiPS cell-derived LSEC differentiation via LSEP. g) Scatter dot-plot of the flow cytometry analysis of CD31/CD32 expression in CD34+CD43 iAEC and iLSEP at day14 under +VEGF and +VEGF + OSM conditions. h) Scatter dot-plots of the flow cytometry analysis of LYVE1/CD32 expression (left). Quantification of CD32+LYVE1+ cell fractions in CD34+CD43 cells (right). Data represent the mean ± SEM (n = 6, iAEC; n = 12; iLSEP; all n are biological replicates; ****, p < 0.0001; ns, not significant; one-way ANOVA with Tukey’s multiple comparisons test). i) The feature plots showing the expression of arterial (CXCR4) and venous (NT5E coding CD73 protein) EC markers in integrated single-cell gene expression data. Gray color indicates no expression. j) Scatter dot-plots of the flow cytometry analysis of CD73/CXCR4 expression. k) Immunofluorescent staining for CD32b/CD31 (upper) and CD32b/FVIII (lower) at day 12 (iSTM, iAEC and iLSEP) and day 16 (iLSEC). l) Scatter dot-plot of the flow cytometry analysis of LYVE1/CD32 expression in VA-derived LSEC (VA-LSEC) at day14. m) Comparison of FVIII protein expression quantified from images of immunofluorescent staining for FVIII/CD32b. Data represent the mean ± SEM (n = 6, VA-LSEC and iLSEC; n = 3, Primary LSEC; all n are biological replicates; **, p < 0.01; ****, p < 0.0001; one-way ANOVA with Dunnett’s multiple comparisons test compared to iLSEC, day14). n) Comparison of secreted FVIII antigen concentration in culture supernatants among iPS-derived STM, endothelial cells, and primary LSEC. Data represent the mean ± SEM (n = 12, iLSEC; n = 8, iAEC and iSTM; n = 9, iLSEP; n = 3, Primary LSEC; n = 4, VA-LSEC; all n are biological replicates; ****, p < 0.0001; one-way ANOVA with Dunnett’s multiple comparisons test compared to iLSEC, day15). o) Scanning electron microscopy (SEM) of iLSEC ( + VEGF and +VEGF, +OSM) and iAEC. Arrowheads indicate the clusters of fenestrae on the cell surface. The right panel is an enlarged image of the dashed square region of iLSEC ( + VEGF, +OSM).
Extended Data Fig. 3 |
Extended Data Fig. 3 |. Characterization of endothelial lineages in self-organizing liver bud organoids.
a) Bright-field image of organoids at different time points after mixing cells (day 1, 5, and 11). Scale bar indicates 500 μm. b) Whole-mount single fluorescent channel images of HLBOs including GFP+ iLSEP and mCherry+ iAEC with immunofluorescent staining for FVIII at day 11. Scale bar indicates 200 μm. c) High-magnification whole mount image of HLBO including GFP+ iLSEP with immunofluorescent staining for CD32b and FVIII at day 11. Scale bar indicates 30 μm. d) Scatter dot-plots of the flow cytometry analysis of CD34+ endothelial cells and EPCAM+ (CD326+) epithelial cells in HLBOs at day11. The right panels display CD32 expression in endothelial cells gated by CD34. e) Scatter dot-plots of the flow cytometry analysis of CD31, CD32, and CD36 expression of HLBOs at day11. The panel of CD32 and CD36 was gated by CD31high for both HLBOs, and CD32highCD31low and CD32lowCD31low only for +iLSEP HLBO. f) Cross-sectioning image of HLBOs with immunofluorescent staining for LYVE1/CD32b/STAB1 at day 11. Right panels are enlarged single fluorescent channel images of the dashed square region. g) Transmission immunoelectron microscopy of ultra-thin frozen sections of +iLSEP HLBO labeled with anti-LYVE1 antibody. Right panel is enlarged image of the red dashed square region of left panel. Yellow asterisks indicate pore structures between LYVE1+ endothelial cells. Scale bar indicates 5 μm (left) and 1 μm (right). h) Intravital fluorescence microscopy imaging of the +iLSEP HLBO transplanted mice. The organoid-derived human vessels were observed by GFP+ iLSEP. Host mice vessels and blood flow are visualized using a mice-specific anti-CD31 antibody (mCD31) and 2,000 kDa tetramethylrhodamine-dextran, respectively. Right panels are enlarged image of the dashed square region. White arrow marks the point of connection between the human and mouse blood vessels. i) Alexa Fluor 647 (AF647)-conjugated AcLDL uptake in human blood vessels with blood flow (2,000 kDa tetramethylrhodamine-dextran). Right panels are single fluorescent channel images. Yellow arrowheads indicate regions of AF647-AcLDL merged human blood vessels. Scale bar indicates 50 μm.
Extended Data Fig. 4 |
Extended Data Fig. 4 |. scRNA-seq profiling of HLBOs and primary human liver.
a) Heatmap showing marker gene expression for cell subtype layer group in the HLBO+iLSEP dataset. b) Proportion of cell cycle phase per cell class in each time series. c) Sankey diagram for hierarchical overview of cell composition in HLBO+iLSEP. The hierarchical structure consists of three annotation levels: cell class (Layer 1), which is the upper domain grouping cell types, cell type (Layer 2), and subtype (Layer 3), and the numbers in parentheses indicate the total number of annotations in each layer. d) UMAP of integrated primary liver dataset including fetal and adult stage colored by cell type. e) UMAPs showing common cell type marker expression between primary liver and HLBO+iLSEP.
Extended Data Fig. 5 |
Extended Data Fig. 5 |. Comparative analysis of HLBO with published human organoid datasets.
a) UMAPs for human pluripotent stem cell-derived liver organoid cell atlas colored by cell type and organoid source. b) UMAPs display the maximum spearman correlation of (left) adult liver and (right) fetal liver dataset. The right UMAP highlights HLBO+iLSEP cells. c-f) Ridge plots displaying spearman correlations for each organoid dataset against c) adult or fetal hepatocytes, d) adult or fetal cholangiocytes, e) both adult and fetal stellate cells, and f) adult or fetal endothelial cells. Organoid groups that did not contain enough cells to show data distribution are not plotted.
Extended Data Fig. 6 |
Extended Data Fig. 6 |. Single-cell characterization of endothelial cell in liver organoids.
a) UMAPs showing LSEC (zone 2 and 3) marker gene expression (together with Extended Data Fig. 2c), whereas organoids are color-coded by data resource. b) Violin plots showing differentiation signature expression by endothelial subset. c) UMAP showing extracted subpopulation of arterial-like endothelial cell (EC1) (left) and Scatter plots showing latent time versus spliced gene expression of arterial markers (right). Black line on scatter plot is linear regression fit line to data points to represent trends of change.
Extended Data Fig. 7 |
Extended Data Fig. 7 |. Analysis of hepatic functionalization and architecture in HLBOs.
a) qRT-PCR analysis of AFP and ALB. Data represent the mean ± SEM (n = 3 biological replicates; **, p < 0.01; ****, p < 0.0001; multiple two-sided t-test with Holm-Sidak correction). b) Measurement of albumin in organoid supernatants at day 11. Data represent the mean ± SEM (n = 3 biological replicates; **, p < 0.01; ****, p < 0.0001; one-way ANOVA with Dunnett’s multiple comparisons test compared to +iLSEP HLBO). c) Cross-sectioning image of HLBO without EC (−EC) with H&E staining (left). Distribution of hepatocytes with different zonal marker protein identified by immunofluorescent staining for GS (peri-central) and GLS2 (pan-lobular) in HLBOs (right). d) Cross-sectioning images showing distribution of hepatocytes identified by immunofluorescent staining for ASGR1 and GFP+ iAECs or iLSEPs embedded in a second cell layer. Lower panels are enlarged images of the white dashed square region. The yellow dashed lines indicate the boundaries of the gel layer in organoid generation as illustrated in Fig. 1a. Each section is a serial specimen of the stained images in Fig. 3a, b. e) Localization of ASGR1+ hepatocyte and CD32b+ LSEC determined by whole-mount immunofluorescent staining of HLBOs. f) Measurement of glutamine / glutamate ratio in HLBO supernatants at day11. Data represent the mean ± SEM (n = 3 biological replicates; *, p < 0.05; two-sided Welch’s t-test). g) Determination of ammonia uptake from the medium in HLBOs at day 11. Ammonia change in 24 h was quantified by the difference between the HLBO supernatant and the culture medium. Data represent the mean ± SEM (n = 7 biological replicates; **, p < 0.01; two-sided Welch’s t-test). h-i) Whole-mount immunostaining images of HLBO with/without CYP inducers stained for CYP3A4/PXR/LYVE1 and CYP1A2/GS/LYVE1. Right panels are fluorescence channel split images of LYVE1 combined with each hepatocyte markers in +iLSEP HLBO. j) Representative enrichment plots in scRNA-seq analysis compared between hepatocyte in +iLSEP HLBO and those in other liver organoids (9 publicly available organoids) of integrated dataset. Shown pathways are significantly enriched in +iLSEP HLBO (NES > 0; FDR-adjusted p < 0.05; one-sided permutation test).
Extended Data Fig. 8 |
Extended Data Fig. 8 |. Inter-cellular lineage interaction by ligand-receptor analysis.
a) The heatmap visualizing the relative importance of each cell type of late fetal liver (13–17 PCW) based on the centrality score of WNT signaling pathway. b) The chord diagram describing significant ligand-receptor pairs involving WNT signaling within fetal liver (p < 0.05; one-sided permutation test without adjustment). c) The heatmap and bar plot summarizing outgoing or incoming signaling strength across cell types. Color scale of the heatmap represents the relative signaling strength of each pathway. Top bar plot shows total strength of all pathways displayed in the heatmap for each cell type. d) The chord diagram describing significant ligand-receptor pairs involved all signals sending to iLSEP (p < 0.05; one-sided permutation test without adjustment). The ligand and receptor names that overlap with intercellular communication in fetal liver are highlighted. e) The chord diagram describing significant ligand-receptor pairs involved all signals sending to fetal liver endothelial cell (p < 0.05; one-sided permutation test without adjustment).
Extended Data Fig. 9 |
Extended Data Fig. 9 |. Evaluation of iLSEP-specific siRNA knockdown.
a) qRT-PCR analysis of WNT2, VEGFA, RSPO3, and F8. Data represent the mean ± SEM (n = 4 biological replicates; *, p < 0.05; multiple two-sided t-test with controlling FDR). In the “+Control,” siRNAs of non-targeted negative controls were used. b-c) Scatter dot-plot of the flow cytometry analysis of CD34/CD32 and CD73/CXCR4 expression in CD34+CD43 iLSEC with siRNA treatment at day14. d) Observation of fluorescent reporters with bright-field image to track GFP+ iLSEP and AlexaFlour555 (AF555)-tagged siRNA embedded in the same layer of multilayered gel. Scale bar indicates 500 μm. For at least 9 days, AF555-tagged siRNA remained in the packed gel or inside the organoids. e) Scatter dot-plot of the flow cytometry analysis of whole HLBO cells for separation of GFP−tagged iLSEP in second layer and GFP−negative cells in first layer in HLBO by FACSAria Fusion cell sorter. f) qRT-PCR analysis of WNT2 to validate GFP-tagged iLSEP specific knockdown efficiency. WNT2 mRNA expression levels were determined relative to the negative control siRNA treated for each GFP+ and GFP fraction isolated. Data represent the mean ± SEM (n = 8, GFP+ groups; n = 7, GFP in +Control; n = 6, GFP in +siWNT2; all n are biological replicates; ***, p < 0.001; multiple two-sided t-test with Holm-Sidak correction). g) Cross-sectional H&E staining image of HLBOs with siRNA treatment. h) Measurement of VEGF-A in siRNA-treated HLBO supernatants at day3. Data represent the mean ± SEM (n = 4 biological replicates; ND, not detected). i) Whole-mount image of siRNA-treated HLBOs with immunofluorescent staining for CD31, STAB1 and LYVE1. j) Quantification of the percentage of cells expressing CD31 or LYVE1 alone or co-expressing CD31 and LYVE1. Data represent the mean ± SEM (n = 4 biological replicates; *, p < 0.05; **, p < 0.01; two-way ANOVA with Sidak’s multiple comparison test). k) Quantification of the percentage of STAB1 co-expressing endothelial cells (CD31+ or LYVE1+). Data represent the mean ± SEM (n = 4 biological replicates; ns, not significant; two-sided Welch’s t-test).
Extended Data Fig. 10 |
Extended Data Fig. 10 |. Assessment of coagulation factors in HLBOs and transplanted HLBO into FVIII knockout mice.
a) Bright-field image of organoids at day11. Scale bar indicates 500 μm. b) Cross-sectioning image of HLBOs with immunofluorescent staining for FVIII and GFP-tagged VA or iLSEP embedded in a second cell layer, and LYVE1 at day 11. c) FVIII antigen concentration in organoid supernatants at day 11. Data represent the mean ± SEM (n = 6, +VA HLBO; n = 5, +iLSEP HLBO; both n are biological replicates; ***, p < 0.001; two-sided Welch’s t-test). d) FVIII activity of organoid supernatants at day 11 determined based on APTT mixing with FVIII deficient plasma. To assess quality of the secreted proteins, each relative activity was normalized by FVIII antigen level. Data represent the mean ± SEM (n = 5 biological replicates; **, p < 0.01; two-sided Welch’s t-test). e) Relative activity of coagulation factors (FV, FVIII, FIX, and FXI) in HLBO supernatants at day 11, determined based on APTT mixing with corresponding factor deficient plasma. Data represent the mean ± SEM (n = 3 biological replicates; *, p < 0.05; ***, p < 0.001; multiple two-sided t-test with controlling FDR). f) Time-series specific activity of FVIII in HLBO supernatants at day 4 and 11. Data represent the mean ± SEM (n = 3 biological replicates; *, p < 0.05; **, p < 0.01; ***, p < 0.001; two-way ANOVA with uncorrected Fisher’s LSD test. g) Specific activity of coagulation factors (FV, FIX, and FXI) in HLBO supernatants at day 11 and NPP, calculated by activity (%) / protein level (%) (both parameters relative to NPP). Data represent the mean ± SEM (n = 3 biological replicates; ns, not significant; multiple two-sided t-test with controlling FDR q-value). h) The schema of FVIII gene editing to establish the immunodeficient NS-IL2rg KO/ FVIII KO hemi (NSI-FVIII KO) mice. i) Cross-sectioning image of HLBO graft and mice liver tissue with immunofluorescent staining for human FVIII, LYVE1, CD32b, and human cell marker (Ku80 or human nuclear antigen). Right figure for each group is enlarged single channel images of the orange dashed square region in left figure. j) Measurement of HLBO derived human coagulation factors circulating in mouse blood 8 weeks after liver transplantation (LTx) (n = 5 biological replicates; ****, q < 0.0001; multiple two-sided t-test with controlling FDR (q)). k) Actual APTTs reflecting the activity of FVIII secreted from transplanted HLBO 2 months after transplantation compared with NPP and PBS. Eash sample was diluted to the same FVIII antigen level with inhibitor (+) or (−) FVIII deficient plasma. Data represent the mean ± SEM (n = 3 biological replicates; ***, p < 0.001; ****, p < 0.0001; one-way ANOVA with Sidak’s multiple comparisons test between inhibitor (+) and (−)). l) FVIII antigen concentration in culture supernatants on day 7 after re-seeding (iLSEC) or self-organization (iLSEC in HLBO). Values were normalized by the number of LSEC. Data represent the mean ± SEM (n = 6, iLSEC; n = 8, iLSEC in HLBO; both n are biological replicates; ****, p < 0.0001; two-sided Welch’s t-test). m) The blood trickled from tail-tip in saline solution during 20 min bleeding test. n) Total blood loss during 20 min bleeding evaluated by hemoglobin concentration. Data represent the mean ± SEM (n = 3 biological replicates; **, p < 0.01; two-sided Welch’s t-test).
Fig. 1 |
Fig. 1 |. Self-organization of sinusoid-like endothelial network in iPS-cell-derived HLBOs.
a, Schematic overview of stepwise differentiation of iLSEC and generation of sinusoid-bearing HLBO by IMALI culture. b, Stereomicroscopic image of +iLSEP HLBO at day 11. Overall view from above (top); side view (bottom). c, 3D reconstructed image of HLBO with whole-mount immunofluorescent staining for CD32b and ASGR1 at day 11 (left). Scale bar indicates 500 μm. Enlarged cross-sectional view of the white dashed square region within left panel (right). Scale bar indicates 200 μm. See Supplementary Video 1 for detailed 3D structure. d, Whole-mount immunofluorescent staining for CD32b/CD31 at day 11. Right panel is enlarged image of the yellow dashed square region of left panel. e, Whole-mount image of HLBOs including GFP+ iLSEP and mCherry+ iAEC with FVIII immunofluorescent staining at day 11. Scale bar indicates 200 μm. f, Immunofluorescent staining for LYVE1/THBD/vWF at day 11. Right panels are quantification of LYVE1+ vessel diameter in representative HLBO or tissue. The diameter of vessels with tubular structures was measured from the binarized images. Data represent the mean ± s.e.m. of independently replicated images (n = 8, +iAEC HLBO; n = 10, +iLSEP HLBO; n = 15, fetal liver tissue; n = 16, adult liver tissue; ****P < 0.0001; ***P < 0.001; NS, not significant; one-way ANOVA with Tukey’s multiple comparisons test). g, Schematic representation of HLBO transplantation under cranial window and intravital imaging (top). Intravital fluorescence microscopy imaging in the whole-window view of the +iLSEP HLBO transplanted mice (bottom). The organoid-derived human vessels were observed by GFP+ iLSEP. Blood flow was visualized using 2,000 kDa tetramethylrhodamine-dextran. NOD/SCID, non-obese diabetic/severe combined immunodeficient mice. h, Macroscopic image of transplanted HLBOs under the cranial window. The dotted area indicates the transplanted HLBOs. i, Time-lapse imaging of 70 or 2,000 kDa tetramethylrhodamine-dextran visualized-blood flow in GFP+ organoid-derived human vessels. See Supplementary Video 2 for a time-lapse video.
Fig. 2 |
Fig. 2 |. Longitudinal HLBO profiling for endothelial subpopulations by scRNA-seq.
a, UMAPs for integrated +iLSEP HLBO dataset including days 3, 7 and 11 coloured by louvain clustering group with cell type annotation, culture days or cell cycle phase. b, The dot plot representing gene expression of endothelial marker genes that changed among each subtype group. The size of dots indicates the relative gene expression in percent for each group. The colour represents the average expression level for the indicated gene. c, Proportion of endothelial subtype in each culture time series. d, Diffusion stream estimated by RNA velocity analysis (left) and partition-based graph abstraction (PAGA) graph (top right) overlaid on the UMAP coloured by endothelial subtype. UMAP coloured by culture time series (bottom right). e, UMAP showing extracted subpopulations on the trajectory path to sinusoidal-like endothelial cell (EC4) (upper left) and an inferred latent time. f, Scatter plots showing latent time versus spliced gene expression of endothelial markers. The black line on scatter plot is a linear regression fitted line to represent trends of change.
Fig. 3 |
Fig. 3 |. iLSEP promotes the maturation and functionalization of hepatocytes in HLBO.
a, Cross-section image of HLBOs with H&E staining. b, Distribution of hepatocytes with different metabolic enzymes identified by immunofluorescent staining for GS (peri-central) and GLS2 (pan-lobular) in HLBOs. Lower panels are enlarged images of the white dashed square region. The yellow dashed lines indicate the boundaries of the gel layer in organoid generation as illustrated in Fig. 1a. c, Quantification of the percentage of cells expressing GS or GLS2 alone or co-expressing GS and GLS2. Segmentation and counting were normalized by counterstaining (DAPI). Data represent the mean ± s.e.m. (n = 3, +iAEC HLBO; n = 8, +iLSEP HLBO, biological replicates; **P < 0.01; ****P < 0.0001; multiple two-sided t-test with Holm–Sidak correction). d, Whole-mount 3D reconstructed image of HLBOs with immunofluorescent staining for GS and ASGR1. Resolution is 2.8 × 2.8 × 8.2 μm per voxel. e, Quantification of the percentage of cells expressing GS or ASGR1 in 3D reconstructed images. Total cell numbers were counted by counterstaining (DAPI). Data represent the mean ± s.e.m. (n = 6 biological replicates; **P < 0.01; multiple two-sided Mann–Whitney test with Holm–Sidak correction). f, Enzymatic activity of GS in HLBOs protein extracts at day 11. Data represent the mean ± s.e.m. (n = 6, +iAEC HLBO; n = 3, +iLSEP HLBO, biological replicates; *P < 0.05; two-sided Mann–Whitney’s U-test). g, Measurement of CYP3A4 and CYP1A2 enzyme activities of organoids, with activation by rifampicin for CYP3A4 or omeprazole for CYP1A2. Data represent the mean ± s.e.m. (n = 5, CYP3A4; n = 6, CYP1A2, biological replicates; *P < 0.05; ***P < 0.001; ****P < 0.0001; two-way ANOVA with Tukey’s multiple comparisons test). h, Measurement of complement proteins in organoid supernatants at day 11. Data represent the mean ± s.e.m. (n = 3 biological replicates; *P < 0.05; ***P < 0.001; ****P < 0.0001; one-way ANOVA with Dunnett’s multiple comparisons test compared to +iLSEP HLBO).
Fig. 4 |
Fig. 4 |. Endothelial to hepatic intercellular signal communication supports lineage differentiation in HLBO.
a, The heatmap showing cytokines and growth factors associated gene set derived from gene ontology class ‘GO_SIGNALING_RECEPTOR_BINDING’. b, The chord diagram showing the intercellular communication network within the HLBO and the number of significant ligand–receptor pairs by the thickness of their edges (P < 0.05; one-sided permutation test without adjustment). c, The heatmap visualizing the relative importance of each cell type of HLBOon the basis of the centrality score of WNT signalling pathway. d, The chord diagram describing significant ligand–receptor pairs involved WNT signalling within HLBO (P < 0.05; one-sided permutation test without adjustment). The ligand and receptor names that overlap with intercellular communication in fetal liver are highlighted. e, Whole-mount image of siRNA-treated HLBOs with immunofluorescent staining for GS and ASGR1. Scale bar indicates 500 μm. In the ‘+Control’, siRNAs of non-targeted negative controls were used. f, Quantification of the percentage of cells expressing GS or ASGR1 in 3D reconstructed images. Total cell numbers were counted by counterstaining (DAPI). Data represent the mean ± s.e.m. (n = 7 biological replicates; **P < 0.01; ***P < 0.001; multiple two-sided Mann–Whitney’s test with Holm–Sidak correction). g, Whole-mount image of siRNA-treated HLBOs with immunofluorescent staining for CD32b and CD31. h, Quantification of vascular density (percentage area of vessels) and ratio of the CD32b+/CD31+ area. Data represent the mean ± s.e.m. (n = 9 biological replicates; ***P < 0.001; ****P < 0.0001; multiple two-sided Mann–Whitney’s test with Holm–Sidak correction). i, Measurements of FVIII in HLBO supernatants. Data represent the mean ± s.e.m. (n = 4, +Control; n = 6, +siWNT2, biological replicates; **P < 0.01; two-sided Welch’s t-test).
Fig. 5 |
Fig. 5 |. In vitro and in vivo coagulation factor functions in sinusoid-bearing HLBOs.
a, Heatmap showing the coagulation-associated gene set. b, Time series measurements of FVIII in organoid supernatants. Data represent the mean ± s.e.m. (n = 6 biological replicates; ****P < 0.0001; one-way ANOVA with Dunnett’s multiple comparisons test compared to +iLSEP HLBO). c, APTTs reflecting FVIII activity of organoid supernatants at day 11 in FVIII deficient plasma compared to non-cultured media, heat-inactivated (56 °C, 1 h) supernatant and NPP. Data represent the mean ± s.e.m. (n = 3 biological replicates; ****P < 0.0001; one-way ANOVA with Dunnett’s multiple comparisons test compared to +iLSEP HLBO). d, Relative activity of FVIII in +iLSEP HLBO supernatants at day 11, inhibitor (−) NPP and recombinant human FVIII (rhFVIII), determined on the basis of APTT. Data represent the mean ± s.e.m. (n = 4 biological replicates; *P < 0.05; ****P < 0.0001; multiple two-sided paired t-test with controlling FDR by within-sample group comparisons). e, Coagulation-associated factor profile in 2D-EC and 3D-organoid supernatants at day 11. Colour values indicate the z-score based on log2 transformed concentration (n = 3 biological replicates). f, Thrombin generating activity induced by the intrinsic tenase complex (FVIIIa/FIXa) pathway. Data represent the mean ± s.e.m. (n = 3 biological replicates; *P < 0.05; **P < 0.01; ****P < 0.0001; one-way ANOVA with Dunnett’s multiple comparisons test compared to Sup. +iLSEP HLBO inhibitor (−) within culture supernatant group; Ratio paired t-test within NPP group comparison). g, Fibrin clotting images using Alexa Fluor 488-conjugated fibrinogen. w, with; w/o, without. h, Schematic representation of the in vivo efficacy test with an injection of the culture supernatant of HLBO at day 11. See Supplementary Video 3 for the bleeding assay. i, Shortening of time until bleeding stopped relative to maximum (25 min). Data represent the mean ± s.e.m. (n = 6, wild type +PBS group; n = 5, the other groups, biological replicates; *P < 0.05; ***P < 0.001; one-way ANOVA with Dunnett’s multiple comparisons test compared to FVIII KO mice with HLBO supernatant injection). j, Total blood loss during 25 min of bleeding evaluated by haemoglobin concentration. Data represent the mean ± s.e.m. Dots not displayed indicate that data were not detected (n = 3 biological replicates; **P < 0.01; one-way ANOVA with Dunnett’s multiple comparisons test compared to FVIII KO mice with HLBO supernatant injection).
Fig. 6 |
Fig. 6 |. In vivo haemophilia A correction by orthotopic transplantation of sinusoid-bearing HLBOs.
a, Morphological representation of transplanted HLBO into liver. b, Vascular network connection and overlapping between mouse-CD31+ host vessels and human-CD32b+FVIII+ vessels visualized by whole-mount image of with immunofluorescent staining. Scale bar indicates 50 μm. c, Time series measurement of HLBO-derived FVIII circulating in mouse blood 1, 8 and 20 weeks after liver transplantation (LTx) (n = 3, all sham groups and transplanted groups in 8 weeks; n = 5, transplanted groups in 1 and 20 weeks, biological replicates; **P < 0.01; two-way ANOVA with Tukey’s multiple comparisons test). ND, indicates data were not detected. d, The blood trickled from tail-tip in saline solution during 20 min bleeding test. See Supplementary Video 4 for bleeding. e, Total blood loss during 20 min bleeding evaluated by haemoglobin concentration. Data represent the mean ± s.e.m. (n = 5, wild type and sham in 4 weeks; n = 6, transplanted in 4 weeks; n = 4, sham and transplanted in 8 weeks, biological replicates; *P < 0.05; ***P < 0.001; two-sided Welch’s t-test). f, Shortening of time until bleeding stopped relative to maximum (20 min). Data represent the mean ± s.e.m. (n = 5, wild type and sham in 4 weeks; n = 6, transplanted in 4 weeks; n = 3, sham in 8 weeks; n = 4, transplanted in 8 weeks, biological replicates; ***P < 0.001; two-sided Welch’s t-test). g, Actual APTTs reflecting the activity of FVIII secreted from transplanted HLBO 2 and 5 months after transplantation, which were evaluated by APTT shortening compared with normal human plasma, PBS and rhFVIII. Data represent the mean ± s.e.m. (n = 5, rhFVIII mixed with FVIII deficient plasma; n = 3, the other groups, biological replicates; **P < 0.01; ****P < 0.0001; one-way ANOVA with Dunnett’s multiple comparisons test compared to PBS injected mice).

Update of

References

    1. Koike H et al. Modelling human hepatobiliary-pancreatic organogenesis from the foregut–midgut boundary. Nature 574, 112–116 (2019). - PMC - PubMed
    1. Ouchi R et al. Modeling steatohepatitis in humans with pluripotent stem cell-derived organoids. Cell Metab. 30, 374–384.e6 (2019). - PMC - PubMed
    1. Low JH et al. Generation of human PSC-derived kidney organoids with patterned nephron segments and a de novo vascular network. Cell Stem Cell 25, 373–387.e9 (2019). - PMC - PubMed
    1. Birey F et al. Assembly of functionally integrated human forebrain spheroids. Nature 545, 54–59 (2017). - PMC - PubMed
    1. Kim J, Koo BK & Knoblich JA Human organoids: model systems for human biology and medicine. Nat. Rev. Mol. Cell Biol. 21, 571–584 (2020). - PMC - PubMed

LinkOut - more resources