. 2025 Jul;4(7):821-840.
doi: 10.1038/s44161-025-00669-3. Epub 2025 Jun 25.

Maturation of human cardiac organoids enables complex disease modeling and drug discovery

Affiliations

Maturation of human cardiac organoids enables complex disease modeling and drug discovery

Mark W Pocock et al. Nat Cardiovasc Res. 2025 Jul.

Abstract

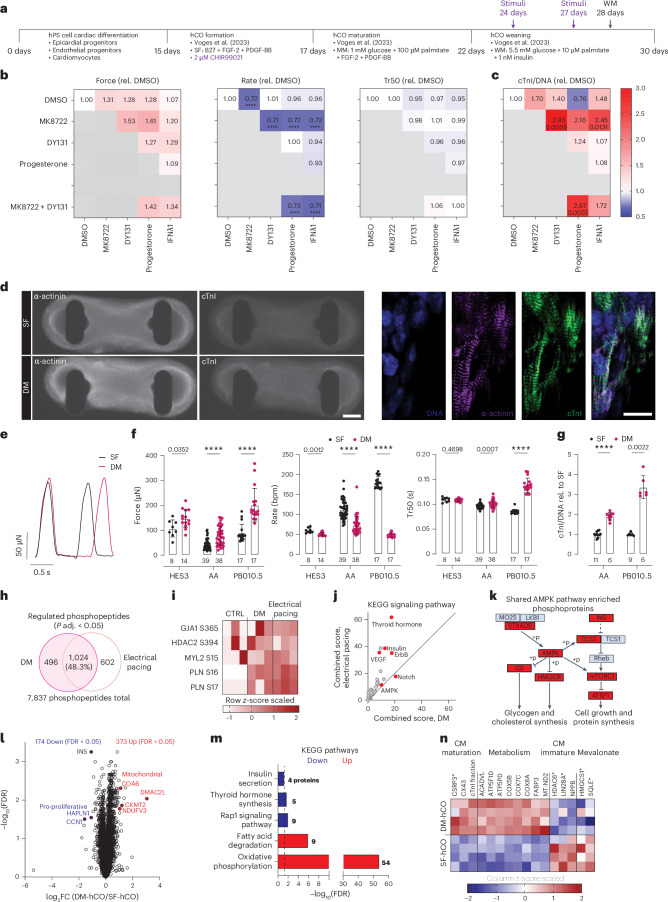
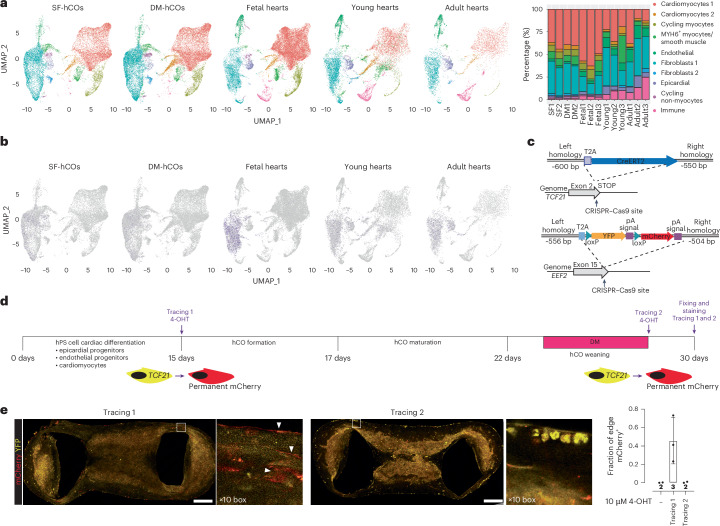
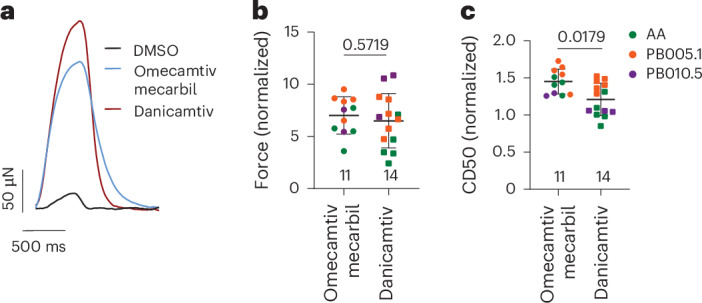
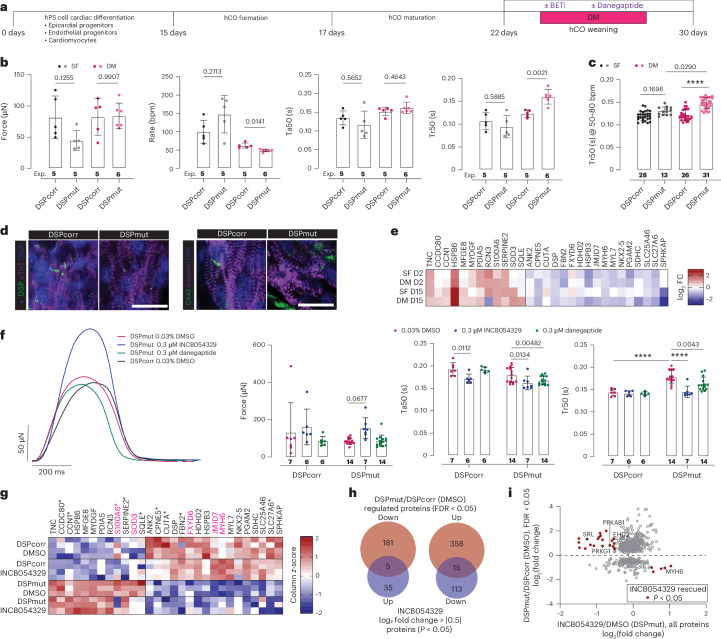
Maturation of human pluripotent stem (hPS) cell-derived cardiomyocytes is critical for their use as a model system. Here we mimic human heart maturation pathways in the setting of hPS cell-derived cardiac organoids (hCOs). Specifically, transient activation of 5' AMP-activated protein kinase and estrogen-related receptor enhanced cardiomyocyte maturation, inducing expression of mature sarcomeric and oxidative phosphorylation proteins, and increasing metabolic capacity. hCOs generated using the directed maturation protocol (DM-hCOs) recapitulate cardiac drug responses and, when derived from calsequestrin 2 (CASQ2) and ryanodine receptor 2 (RYR2) mutant hPS cells exhibit a pro-arrhythmia phenotype. These DM-hCOs also comprise multiple cell types, which we characterize and benchmark to the human heart. Modeling of cardiomyopathy caused by a desmoplakin (DSP) mutation resulted in fibrosis and cardiac dysfunction and led to identifying the bromodomain and extra-terminal inhibitor INCB054329 as a drug mitigating the desmoplakin-related functional defect. These findings establish DM-hCOs as a versatile platform for applications in cardiac biology, disease and drug screening.


Conflict of interest statement

Competing interests: E.R.P., R.J.M. and J.E.H. are co-inventors on a patent relating to the Heart-Dyno device and human cardiac organoid maturation used in this study (WO2018035574A1 filed by the University of Queensland) which is licensed to Dynomics. E.R.P., R.J.M. and J.E.H. are co-inventors on a patent for cardiac regeneration therapeutics (WO2020186283A1 filed by QIMR Berghofer). E.R.P. and J.E.H. are co-inventors on a patent for the serum-free conditions supporting the vascular population used in this study (WO2024016058 filed by MCRI and QIMR Berghofer). J.E.H. is co-inventor on licensed patents for cardiac differentiation and engineered heart muscle, some aspects of which are used in this study (WO2015040142A1 and WO2015025030A1), which are licensed to MyriaMed and Repairon. E.R.P., R.J.M. and J.E.H. are cofounders, scientific advisors, and stockholders in Dynomics. J.E.H. and R.J.M. are co-inventors on a provisional patent filed by QIMR Berghofer on the DM-hCO conditions discovered in this study (2024902826). The remaining authors declare no competing interests.

Figures

Fig. 1
Fig. 1. Screening for combinatorial stimuli to promote hCO maturation.
a, Schematic of the protocol. b, Force of contraction, rate and Tr50 at 30 days normalized to pretreatment at 24 days. n = 11–17 hCOs from three experiments. c, cTnI intensity normalized to DNA and then to dimethylsulfoxide (DMSO) controls. n = 9–14 hCOs from two experiments. d, cTnI staining of cardiomyocytes (α-actinin). Scale bars, 200 μm (left) and 20 μm (right). Representative of data from three cell lines. e, Comparison of SF-hCO and DM-hCO raw contraction curves. f, Comparison of raw force of contraction, rate and Tr50 between SF-hCOs and DM-hCOs for three different cell lines (HES3, AA and PB010.5). n = hCOs. g, cTnI intensity normalized to DNA and then to DMSO controls for two different cell lines (AA and PB010.5). n = hCOs. h, Differentially regulated phosphosites in MK8722 + DY131 (DM)-treated and 120-bpm electrically paced hCOs (5-min stimulation each), highlighting shared sites. n = 3 biological replicates with 15 pooled hCOs each. i, Heat map of phosphosite z-scores. j, Gene Ontology analysis of phosphorylated proteins shared between acute DM treatment of hCOs and electrical pacing. k, The AMPK signaling network shared between acute DM treatment of hCOs and electrical pacing. l, Volcano plot of DM-hCO versus SF-hCO proteomics abundance data. m, Gene Ontology analysis of differentially regulated proteins in DM-hCOs versus SF-hCOs. n = 4 biological replicates with three pooled hCOs each. n, Heat map of selected significantly differentially regulated (FDR < 0.05) protein expression z-scores with asterisks indicating significance by P value only (P < 0.05). cTnI fraction was calculated as cTnI / (cTnI + ssTnI) in each sample. Concentrations: 10 μM progesterone, 3 μM DY131, 10 μM MY8722 and 100 ng ml−1 IFNλ1. Data are the mean ± s.d. Kruskal–Wallis test with Dunn’s multiple comparison to DMSO (b and c) and two-tailed Mann–Whitney tests for each cell line (f and g) were performed. In the heat maps (b and c), the P values are shown beneath the values if significant. ****P < 0.0001. CM, cardiomyocyte; FC, fold change; KEGG, Kyoto Encyclopedia of Genes and Genomes. Source data
Fig. 2
Fig. 2. Cellular composition in SF-hCOs and DM-hCOs.
a, Co-clustering of snRNA-seq from SF-hCOs and DM-hCOs and human heart data from GSE156707 (ref. ), including proportions of cell populations. n = 2 snRNA-seq biological replicates for SF-hCOs and DM-hCOs, each containing ~70 pooled hCOs. b, Expression of pro-epicardial organ marker TCF21. c, Generation of a hPS cell TCF21 lineage tracing line. d, Schematic of lineage tracing experiments. e, Representative analysis of lineage tracing 1 and 2 along with quantification of hCO coverage across multiple experiments. n = 2–3 experiments. Data are the mean ± s.d. White arrowheads indicate epicardial cells on the surface and fibroblasts that are integrated within the hCO tissue. Scale bars, 200 μm. 4-OHT, 4-hydroxytamoxifen. Source data
Fig. 3
Fig. 3. Sarcomeric and metabolic maturation in DM-hCOs.
a, Uniform manifold approximation and projection (UMAP) of nuclei in SF-hCOs and DM-hCOs. Nuclei are labeled by cell type. b, Expression of canonical cell markers in SF-hCOs and DM-hCOs. c, Number of differentially regulated genes in different cellular populations from DM-hCOs versus SF-hCOs using pseudo-bulk analysis (average log2FC > |0.25|, adjusted P < 0.05). d, Top ten enriched Gene Ontology terms from the sub-ontology ‘biological processes’ for upregulated genes in cardiomyocyte 1 and 2 populations. e, Expression of sarcomeric maturation genes TNNI3 and MYL2. f, Top ten enriched Gene Ontology terms from the sub-ontology ‘biological processes’ for upregulated genes in the cardiomyocyte 3 cluster. g, Oxidation rates in SF-hCOs and DM-hCOs over the culture duration. n = hCOs from two cell lines (HES3 and PB005.1). h, Response to BAM15 in SF-hCOs and DM-hCOs. n = hCOs from two cell lines (HES3 and PB005.1). i, Representative spatial expression of cardiomyocyte (MYH7) and nodal cardiomyocyte (MYH6) markers in a section. Purple arrowheads indicate MYH6 clusters. j, Representative spatial expression of sarcomeric and metabolic genes in a section, including a heat map of average expression. Data are the mean ± standard deviation (g and h). Two-way analysis of variance with Tukey’s multiple-comparison test (h) was performed. ****P < 0.0001. Source data
Fig. 4
Fig. 4. Mechanisms of rate control and sarcoplasmic reticulum handling in SF-hCOs and DM-hCOs.
a, Dependence of force and rate on extracellular calcium concentration. n = hCOs from two experiments. b, Contractile rate/burst behavior with blockade of If using 1 μM cilobradine. n = 4 experiments. c, Post-rest-potentiation assessment of sarcoplasmic reticulum (SR) loading and verification using blockade of SERCA using 5 μM thapsigargin. n = hCOs pooled from three different lines (HES3, AA and PB005.1). d, Three-dimensional transmission electron microscopy rendering of the sarcoplasmic reticulum (red). Scale bar, 500 nm. e, Concentration–response curve of DM-hCOs treated with ryanodine and representative trace curves. Richard’s 5 parameter dose–response was used to fit the curves. n = hCOs. f, Influence of ryanodine on rate and Ta50, including under 1-Hz pacing for DM-hCOs. n = hCOs pooled from three different lines (HES3, AA and PB005.1). g, Influence of CASQ2 knockout on rate and Ta50, including under 1-Hz pacing for DM-hCOs. n = hCOs pooled from three experiments for CASQ2+/+ or three different clones for CASQ2−/−. h, Quantification of ectopic contractions during the pause phase of post-rest-potentiation experiments. n = hCOs. i, Critical excitation–contraction genes differentially regulated in DM versus SF-hCO cardiomyocyte populations from snRNA-seq data are colored in Fig. 2. Created with BioRender.com. Data are the mean ± s.d. Two-tailed Mann–Whitney test (b), two-tailed Welch’s t-test (c and paced data in f and g), mixed-effects testing with Dunnett’s multiple-comparison tests (e) and Kruskal–Wallis test with Dunn’s multiple-comparison tests (f and g) were performed. ****P < 0.0001. Source data
Fig. 5
Fig. 5. Myosin activators differentially affect contraction duration in DM-hCOs.
ac, Testing of omecamtiv mecarbil and dancamtiv at Cmax values, 1 μM and 8 μM, respectively. Experiments were performed at 0.6 mM Ca2+ by mixing weaning medium made in RPMI and DMEM base. a, Representative force curves. b, Force of contraction normalized to pre-drug baseline. n = hCOs from three different cell lines (AA, PB005.1 and PB010.5). c, Contraction duration between 50% activation and 50% relaxation (CD50). Data are the mean ± s.d. Two-tailed Mann–Whitney tests (b and c) were performed. Source data
Fig. 6
Fig. 6. Characterization of DSP cardiomyopathy biopsy samples and generation of CRISPR-corrected hiPS cells.
a, Family tree. Participant for iPS cell modeling is MCHTB11. b, Picrosirius red staining of cardiac biopsy samples from a healthy donor heart or at time of left ventricular assist device implantation for the patients. Scale bar, 500 μm. c, Staining of cardiac biopsy samples in b for DSP and CX43. Scale bar, 20 μm. d, Heat map of DSP signature protein expression in different human heart biopsy samples. e, Participant-specific and CRISPR-corrected hiPS cell lines were created using the strategy presented in Supplementary Fig. 21a. Source data
Fig. 7
Fig. 7. Modeling DSP cardiomyopathy and identification of therapeutic candidates in DM-hCOs.
a, Schematic of assessment in hCOs. b, Contraction parameters of SF-hCOs and DM-hCOs from DSPcorr and DSPmut lines. n = experiment means from Extended Data Fig. 9a. c, Tr50 in hCOs beating between 50 and 80 bpm (Extended Data Fig. 9b). n = hCOs pooled from all experiments in Extended Data Fig. 9a. d, Staining of DM-hCOs for DSP and CX43. Scale bars, 20 μm. Representative of n = 3–4 biological replicates. e, Heat map of DSP signature protein fold change in immature 2-day and mature 15-day SF-hCOs and DM-hCOs in DSPmut versus DSPcorr lines. n = 2–3 experiments per group, each with 3 pooled hCOs per sample. Outliers with undetected or very low protein expression were removed from the analysis. f, Representative force traces of 60-bpm paced DM-hCOs including analysis of force and kinetic parameters with INCB054329 or danegaptide treatment. n = hCOs pooled from 3–4 experiments. Baseline functional parameters are in Extended Data Fig. 9c. g, Heat map of DSP signature proteins in DM-hCOs in DSPmut versus DSPcorr lines with and without INCB054329. n = 3–4 experiments, each with 3 pooled hCOs per sample. All FDR < 0.05 except those with *P < 0.05 in DSPmut versus DSPcorr DM-hCOs. Proteins reverted by INCB054329 are highlighted in magenta. h, Venn diagrams of DSPmut versus DSPcorr (FDR < 0.05 or P < 0.05) that are also differentially regulated by INCB054329 in DSPmut (P < 0.05). i, Plot highlighting the differentially regulated proteins in DSPmut versus DSPcorr (FDR < 0.05) that are also differentially regulated by INCB054329 in DSPmut (P < 0.05). Data are the mean ± s.d. Brown–Forsythe and Welch with Dunnett’s T3 multiple-comparison tests comparing DSPmut to DSPcorr (b), Kruskal–Wallis with Dunn’s multiple-comparison tests (c) and two-way analysis of variance with Sidak’s multiple-comparison test between DSPcorr and DSPmut for DMSO or relative to DMSO for DSPmut (f) were performed. ****P < 0.0001. Source data
Extended Data Fig. 1
Extended Data Fig. 1. Comparison of mRNA expression of sarcomeric protein ratios that correlate with maturation across multiple human pluripotent stem cell derived cardiomyocyte platforms.
a, Fraction of MYH7. b, Fraction of MYL2. c, Fraction of TNNI3. Gene counts expressed as a ratio. All n are biological. Data are mean ± standard deviation. RNA-sequencing data collected from hPSC-CM cultures including GSE93841, GSE148025, GSE116464, GSE201437, GSE114976, GSE151279 and human hearts including ERP109940 and Hahn et al., 2021. Source data
Extended Data Fig. 2
Extended Data Fig. 2. Critical pace controlling genes in both SF- and DM-hCOs.
a, If channel genes HCN1 and HCN4. b, A key nodal cell transcription factor, SHOX2. c, Calcium channel genes for Cav1.2 (CACNA1C) and Cav1.3 (CACNA1D). d, CX43 cell-cell junction gene GJA1. e, Immunostaining of CX43 in SF versus DM-hCOs. Representative of hCOs from 3 different cell lines. Scale bar = 10 μm.
Extended Data Fig. 3
Extended Data Fig. 3. Paracrine interactions in SF- and DM-hCOs.
a, FGF2-FGFR1. b, FGF10-FGFR2. c, PDGFB-PDGFRB. d, VEGFA-FLT1.
Extended Data Fig. 4
Extended Data Fig. 4. Cardiomyocyte sub-type.
a, UMAP projection of nuclei in SF- and DM-hCOs for right side/outflow tract marker ISL1, left ventricle marker TBX5 and ventricular marker IRX4. b, Overview of whole hCO expression of AAV6-cTnT-eGFP and AAV6-Hand1LV-nleGFP in SF-hCOs. Scale bars = 100 μm. c, Expression of AAV6-Hand1LV-nleGFP in predominately in the NKX2-5+ cardiomyocytes rather than the stromal cells in SF-hCOs. Arrows indicate NKX2-5 stromal cells lacking AAV6-Hand1LV-nleGFP expression. Scale bar = 20 μm. d, Quantification of NKX2-5+ cardiomyocytes expressing eGFP in SF-hCOs. Data are mean ± standard deviation. Images in b, c are representative of the n = 7 hCOs in d. Source data
Extended Data Fig. 5
Extended Data Fig. 5. Generation of CASQ2−/− and RYR2N4104K/+cell lines using CRISPR.
a, Schematic of the CRISPR editing protocol and SANGER sequencing for CASQ2−/−. This includes proteomics on DM-hCOs confirming knockout of CASQ2 and other SR related proteins and identified CASQ2 peptides. b, Schematic of the CRISPR editing protocol and SANGER sequencing for RYR2N4104K/+.
Extended Data Fig. 6
Extended Data Fig. 6. DM-hCOs predict low and high risk CiPA compounds.
Functional parameters in response to 12 CiPA compounds. n = hCOs. Data are mean ± standard deviation of functional parameters normalized to non-dosed hCOs then DMSO controls. Richard’s 5 parameter dose-response was used to fit the curves. Mixed-Effects testing with Dunnett’s multiple comparison tests were used to calculate corrected p-values which are only shown for the concentration closest to Cmax. Source data
Extended Data Fig. 7
Extended Data Fig. 7. DM-hCOs predict negative inotropes.
a, DM-hCO responses to benign drugs (paracetamol and pravastatin) or drugs inhibiting the impact of systemic factors (atenolol and captopril). b, DM-hCO responses to negative inotropes. n = hCOs. Data are mean ± standard deviation of functional parameters normalized to non-dosed hCOs then DMSO controls. Richard’s 5 parameter dose-response was used to fit the curves. Mixed-Effects testing with Dunnett’s multiple comparison tests were used to calculate corrected p-values which are only shown for the lowest concentration with a decline in force. **** P < 0.0001. Source data
Extended Data Fig. 8
Extended Data Fig. 8. DM-hCOs to predict positive inotropes.
a, DM-hCO responses to drugs modulating L-type calcium channel (BAYK-8644), β-adrenergic signaling (isoprenaline), α1-adrenergic signalling (phenylephrine) or Na+, K+ - ATPase (ouabain). n = hCOs. b, DM-hCO responses to phosphodiesterase inhibition using milrinone (PDE3/PDE4) and rolipram (PDE4). n = hCOs. c, Isoprenaline dose-response curves with 10 μM and/or 30 μM milrinone. n = experimental averages from 3 different cell lines. d, EC50 of isoprenaline from the min-max scaled curves in c. e, DM-hCO responses to sarcomeric acting inotropes targeting troponin (CK-136) or myosin (omecamtiv mecarbil and danicamtiv). All experiments were performed at 0.6 mM Ca2+ by mixing weaning medium made in RPMI and DMEM base. Data are mean ± standard deviation. Functional parameters were normalized to non-dosed hCOs then DMSO controls (a, b, e) or as described on the y-axis (c). Richard’s 5 parameter dose-response was used to fit the curves. Mixed-Effects testing with Dunnett’s multiple comparison tests (a, b, e), two-way ANOVA with Dunnett’s multiple comparison tests relative to DMSO (c) and one-way ANOVA with Dunnett’s multiple comparison tests relative to DMSO (d). Corrected p-values are only shown for the highest concentration and intermediate concentrations where Tr50 is impacted (a, b, e). **** P < 0.0001. Source data
Extended Data Fig. 9
Extended Data Fig. 9. Modelling and drug testing in DSPmut hCOs.
a, Rate in hCOs in different experimental batches. n = hCOs and each bar is a different experiment. b, Tr50 versus rate in DSPcorr hCOs with 50–80 bpm highlighted. n = 90 hCOs from all DSPcorr experiments in a. c, Contraction parameters with treatment of INCB054329 and danegaptide in DM-hCOs (as per Fig. 7a). n = hCOs pooled from 3–4 experiments. Two-way ANOVA with Sidak’s multiple comparison tests between lines for DMSO or relative to DMSO for DSPmut (c). **** p < 0.0001. Source data

References

    1. Karbassi, E. et al. Cardiomyocyte maturation: advances in knowledge and implications for regenerative medicine. Nat. Rev. Cardiol.17, 341–359 (2020). - PMC - PubMed
    1. Mills, R. J. & Hudson, J. E. Bioengineering adult human heart tissue: how close are we? APL Bioeng.3, 010901 (2019). - PMC - PubMed
    1. Bedada, F. B. et al. Acquisition of a quantitative, stoichiometrically conserved ratiometric marker of maturation status in stem cell-derived cardiac myocytes. Stem Cell Rep.3, 594–605 (2014). - PMC - PubMed
    1. Mills, R. J. et al. Functional screening in human cardiac organoids reveals a metabolic mechanism for cardiomyocyte cell cycle arrest. Proc. Natl Acad. Sci. USA114, E8372–E8381 (2017). - PMC - PubMed
    1. Drakhlis, L. et al. Human heart-forming organoids recapitulate early heart and foregut development. Nat. Biotechnol.39, 737–746 (2021). - PMC - PubMed

MeSH terms