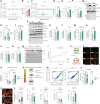
. 2025 Jul;4(7):876-890.
doi: 10.1038/s44161-025-00670-w. Epub 2025 Jun 25.

AIMP3 maintains cardiac homeostasis by regulating the editing activity of methionyl-tRNA synthetase

Affiliations

AIMP3 maintains cardiac homeostasis by regulating the editing activity of methionyl-tRNA synthetase

Anindhya S Das et al. Nat Cardiovasc Res. 2025 Jul.

Abstract

In mammals, nine aminoacyl tRNA synthetases (ARSs) and three auxiliary proteins (ARS-interacting multifunctional proteins 1-3 (AIMP1-3)) form the multisynthetase complex (MSC), a molecular hub that provides a subset of aminoacylated tRNAs to the ribosome and partakes in translation-independent signaling. Knowledge of the role of AIMPs in organ physiology is currently limited. AIMP3 (also known as EEF1E1) was proposed to anchor methionyl tRNA synthetase (MetRS) in the complex and regulate protein synthesis through translation initiation and elongation. Here we show that a cardiomyocyte-specific conditional knockout of AIMP3 in mice leads to lethal cardiomyopathy. MetRS localization, aminoacylation efficiency and global protein synthesis were unaffected in our model, suggesting an alternative mechanism for the pathology. We found that AIMP3 is essential for homocysteine editing by MetRS, a reaction that is necessary for the maintenance of translation fidelity. Homocysteine accumulation induced reactive oxygen species production, protein aggregation, mitochondrial dysfunction, autophagy and ultimately cell death.


Conflict of interest statement

Competing interests: The authors declare no competing interests.

Figures

Fig. 1
Fig. 1. AIMP3 in the heart is responsive to stress and critical for survival.
a, Proposed model of MSC in mammals. The proposed location of AIMP3 in the MSC is shown in green. b, Western blot for AIMP3 from mouse hearts at 7 days after TAC and sham surgery. Ponceau was used as the loading control (n = 5 in each group). c, Quantitative measurement of b using ImageJ (P = 0.0079). d, Schematic representation for cardiomyocyte-specific AIMP3 knockout model using an inducible Cre–Lox system. e, qPCR of Aimp3 from Ctrl (n = 9) and A3cKO (n = 6) hearts at 1 month after tamoxifen injection. Rpl7 was used as the housekeeping control (P < 0.0001). f, Western blot for AIMP3 and GAPDH from Ctrl (n = 4) and A3cKO (n = 4) hearts. g, Quantitative measurement of f using ImageJ (P = 0.0183). h, Kaplan–Meier survival curve analysis of Ctrl and A3cKO mice using GraphPad Prism (version 10) (P < 0.0001). Bar graphs are shown as mean + s.e.m. For c, e and g, a two-tailed parametric Student’s t-test was performed. P values are represented as *P ≤ 0.05, **P < 0.01 and ****P < 0.0001. I.P., intraperitoneal. Source data
Fig. 2
Fig. 2. Loss of AIMP3 induces pathological cardiac remodeling.
a, Representative images of Ctrl and A3cKO echocardiograms using M-mode at 1-month post-knockout induction. b, Fractional shortening (P < 0.0001). c, Left ventricular internal diameter at diastole (LVIDd). d, Left ventricular internal diameter at systole (LVIDs) (P < 0.0001). Bar graphs for Ctrl (n = 38) and A3cKO (n = 30) hearts at 1 month. e, Heart weight (HW) to body weight (BW) ratio between Ctrl (n = 19) and A3cKO (n = 16) (P = 0.0051). f, Representative images for WGA staining for Ctrl and A3cKO heart sections at 1-month post-knockout induction (scale bar, 50 µm). g, Quantification of the cross-sectional area of Ctrl (n = 7) and A3ckO (n = 6) hearts. h, Representative images for isolated adult cardiomyocytes from Ctrl and A3cKO hearts. i, Quantification of the length of cardiomyocytes for Ctrl (n = 3) and A3cKO (n = 3) hearts using ImageJ (P < 0.0001; scale bar, 50 µm). j, Quantification of the width of cardiomyocytes for Ctrl (n = 3) and A3cKO (n = 3) hearts using ImageJ (P = 0.0012). At least 50 randomly chosen cells were measured for each isolation. k, Length-to-width ratio from i and j (P < 0.0001). lp, qPCR analysis of hypertrophic markers (Nppa, P < 0.0001 (l); Nppb, P < 0.0001 (m); Acta1, P = 0.0112 (n); Myh6, P < 0.0001 (o); and Myh7, P = 0.0141 (p)) from total RNA isolated from Ctrl (n = 9) and A3cKO (n = 6) hearts. q, Ratio of p and o between Ctrl and A3cKO (P < 0.0001). Bar graphs and violin plots are shown as mean + s.e.m. Two-tailed parametric Student’s t-test was performed for each graph. P values are represented as *P < 0.05, **P < 0.01 and ****P < 0.0001. CM, cardiomyocyte; FS, fractional shortening; LV, left ventricular; NS, non-significant.
Fig. 3
Fig. 3. Deficiency of AIMP3 in cardiomyocytes induces cardiac inflammation and fibrosis.
a, Gating strategy of total leukocytes for flow cytometric analysis from Ctrl and A3cKO hearts. bg, Flow cytometric analysis of immune cells (total leukocytes, P = 0.0023 (b); T cells, P = 0.008 (c); B cells (d); myeloid-derived cells, P = 0.0013 (e); infiltrating macrophages (f); and neutrophils, P = 0.0233 (g)) using FlowJo software between Ctrl (n = 5) and A3cKO (n = 5) hearts at 1-month post-knockout induction. hk, qPCR analysis of inflammation markers (Il-6, P = 0.0003 (h); Cxcl10, P < 0.0001 (i); Il-1b, P = 0.0183 (j); and Tnf (k)) from total RNA isolated from Ctrl (n = 9) and A3cKO (n = 6) hearts at 1-month post-knockout induction. l, Representative images of picrosirius red staining of cross-sections from the Ctrl and A3cKO whole hearts and respective zoomed-in areas. m, Quantification of fibrosis from picrosirius red staining of Ctrl (n = 4) and A3cKO (n = 5) hearts (P = 0.0317). At least three random areas from each heart were evaluated. nq, qPCR analysis of pro-fibrotic markers (Ctgf, P < 0.0001 (n); Col1a1, P = 0.0001 (o); Col3a1, P < 0.0001 (p); and Postn, P < 0.0001 (q)) from total RNA isolated from Ctrl (n = 9) and A3cKO (n = 6) hearts at 1-month post-knockout induction. Bar graphs are shown as mean + s.e.m. Two-tailed parametric Student’s t-test was performed for each graph. P values are represented as *P < 0.05, **P < 0.01, ***P < 0.001 and ****P < 0.0001. NS, non-significant; SSC-A, side scatter area.
Fig. 4
Fig. 4. Ablation of AIMP3 does not impact global protein synthesis but influences Hcy editing.
a, Western blot of MetRS and TyrRS from Ctrl and A3cKO hearts, fractioned using size-exclusion chromatography. b, Schematic of aminoacylation (addition of Met to tRNAMet) and editing (conversion of Hcy to Htl) functions of MetRS. c, qPCR-based analysis of charged tRNAiMet (CAT) from Ctrl (n = 4) and A3cKO (n = 5) hearts. d, qPCR-based analysis of charged tRNAeMet (CAT) from Ctrl (n = 4) and A3cKO (n = 5) hearts. e, Western blot for puromycin-tagged peptides from isolated adult cardiomyocytes from Ctrl (n = 3) and A3cKO (n = 3) hearts. f, Quantification of e using ImageJ. g, Western blot for puromycin-tagged peptides from Ctrl (n = 3) and A3cKO (n = 3) mouse hearts after three subcutaneous injections of PE at each alternate day. h, Quantification of g using ImageJ (Ctrl versus Ctrl+PE, P = 0.0162 and Ctrl versus A3cKO+PE, P = 0.007). i, Amino acid activation assay for Met and Hcy of size-exclusion chromatography fractionated cell extracts from HEK293 cells treated with non-targeted siRNA (siNC) and a pool of three different Aimp3 siRNAs (siA3). j, Quantification of amino acid activation rate from i using ImageJ. Inset (a.) shows the content of MetRS in size-exclusion fractions from siNC and siA3 cell lysates. Inset (b.) shows the relative rate for activation of Met and Hcy in siNC and siA3 fractions. k, Quantification of total Hcy in Ctrl (n = 5) and A3cKO (n = 5) hearts at 1-month post-knockout induction (P = 0.0264). l, Quantification of total Hcy in the plasma of Ctrl (n = 6) and A3cKO (n = 6) mice at 1-month post-knockout induction. Bar graphs (except j, inset (b.)) are shown as mean + s.e.m. Two-tailed parametric Student’s t-test (c, f, k and l), non-parametric Mann–Whitney test (d) and one-way ANOVA (h) were performed. P values are represented as *P < 0.05 and **P < 0.01. NS, non-significant; puro, puromycin.
Fig. 5
Fig. 5. AIMP3-dependent Hcy regulation impacts ROS production and cell survival.
a, Representative EPR scan of ROS level in H9C2 cells treated with Hcy (an average of 10 scans is shown, and four biological replicates were tested for each group). b, Measurement of ROS in H9C2 cells treated with Hcy for 1.5 hours (n = 6 in each group) using DCFDA-based assay (P = 0.0028). c, Representative EPR scan for measuring ROS in scramble gRNA (Ctrl) and AIMP3 gRNA (A3KO) infected H9C2 cells (showing an average of five scans, n = 4 in each group). d, Measurement of ROS in Ctrl and A3KO cells using DCFDA-based assay (n = 6 in each group, P < 0.0001). e, Quantification of 2-OH-E+ in Ctrl (n = 3) and A3KO (n = 4) using LC–MS (P = 0.0161). f, Quantification of E+ in Ctrl (n = 3) and A3KO (n = 4) using LC–MS. g, Western blot for confirming overexpression of AIMP3 in Ctrl and A3KO H9C2 cells. h, Measurement of ROS in Ctrl and A3KO H9C2 cells overexpressed with AIMP3 (n = 6 in each group; indicated P value < 0.0001). i, Quantification of protein aggregation in Ctrl (n = 4) and A3KO H9C2 cells (P = 0.0028). j, Western blot for p62, BAG3, BECLIN-1, ATG12, LC3-II/I and GAPDH from Ctrl and A3KO H9C2 cells. Ponceau was used as the loading control (n = 4 in each group). kp, Quantification of j using ImageJ (p62, P = 0.0009 (k); BAG3, P = 0.0456 (l); BECLIN-1, P = 0.0448 (m); ATG12, P = 0.0001 (n); LC3-II (o); and LC3-II/I, P = 0.0472 (p)). q, Western blot for LC3-I/II from Ctrl and A3KO cells treated with Bafilomycin A (Baf A) for the indicated time. r, Quantification of q for LC3-II using Image J. Ponceau was used as loading control. s, Schematics for mode of action of mCherry–GFP–LC3 plasmid. t, Representative images for GFP and mCherry expression in live Ctrl and A3KO H9C2 cells (scale bar, 125 µm). u, Quantification of the signal intensity for GFP and mCherry from t (n = 4 in each group, indicated P value < 0.0001). v, Schematics for mitophagy detection by mt-Keima. w, Representative gating strategy for mitophagy detection in mt-Keima expressing Ctrl and A3KO cells using flow cytometry. x, Quantification of mitochondria that are normal (at pH 7.0) versus going through mitophagy (at pH 4.0) between Ctrl and A3KO cells (n = 4 in each group, indicated P value < 0.0001). y, Immunofluorescence images of Ctrl and A3KO H9C2 cells stained with anti-phospho-γH2A.X antibody (green), DAPI (blue) and F-actin (red). z, Quantitative measurement of mean fluorescence intensity for phospho-γH2A.X in Ctrl and A3KO H9C2 cells using ImageJ (n = 3 each group, at least six random fields analyzed per sample, P < 0.0001; scale bar, 125 µm). z (ii–v), Quantification of live (P < 0.0001), early apoptotic, late apoptotic and necrotic cells (P < 0.0001) in Ctrl (n = 4) and A3KO (n = 4) cells by Annexin V and propidium iodide staining using flow cytometry. Bar graphs are shown as mean + s.e.m. Two-tailed parametric Student’s t-test (for b, d, e, f, h, i, kp and z (ii–v)) and one-way ANOVA (u and x) were performed for each graph. P values are represented as *P < 0.05, **P < 0.01, ***P < 0.001 and ****P < 0.0001. AUC, area under the curve; Ex/Em, excitation/emission; NS, non-significant.
Fig. 6
Fig. 6. Loss of AIMP3 from cardiomyocytes induces mitochondrial dysfunction, protein aggregation, autophagy and cell death.
a, Measurement of OCR by electron flow assay of isolated mitochondria from Ctrl (n = 3) and A3cKO (n = 3) mouse hearts at 10-days post-knockout induction. b, The ratio between detergent-insoluble and soluble fractions in Ctrl (n = 4) and A3cKO (n = 4) heart lysates at 1-month post-knockout induction (P = 0.0008). c, Quantification of protein aggregation in Ctrl (n = 6) and A3cKO (n = 6) heart lysates at 1-month post-knockout induction (P = 0.0054). d, Representative images of CryAB in Ctrl and A3cKO heart cryosections at 1-month post-knockout induction (scale bar, 30 µm). e, Western blot of p62, BAG3, BECLIN-1, ATG-12, LC3-I/II, poly-ubiquitin (Poly-ub) and GAPDH in Ctrl (n = 4) and A3cKO (n = 4) at 1-month post-knockout induction. f, Measurement of total proteasomal activity in Ctrl (n = 9) and A3cKO (n = 7) heart lysates at 1-month post-knockout induction. gm, Quantification of p62, P = 0.0024 (h); BAG3, P = 0.014 (i); BECLIN-1, P = 0.0003 (j); ATG-12, P = 0.0001 (k); total LC3-II, P = 0.0044 (l); LC3-II/I, P = 0.041 (m); and poly-ubiquitin from e (g) using ImageJ. Ponceau was used as the loading control. n, Representative images of LC3 staining of Ctrl and A3cKO heart sections (scale bar, 20 µm). o, Quantification of n using ImageJ (n = 3 for each group, and three images per heart were analyzed, P < 0.0001). p, Representative images of phospho-γH2A.X in Ctrl and A3cKO mouse heart cryosections at 1-month post-knockout induction (scale bar, 20 µm). q, Quantification of phospho-γH2A.X-positive nuclei in Ctrl (n = 3) and A3cKO (n = 3) heart cryosections at 1-month post-knockout induction (P < 0.0001). r, Proposed mechanism of cardiac dysfunction in AIMP3-deficient hearts. Bar graphs are shown as mean + s.e.m. Two-way ANOVA (a), two-tailed parametric Student’s t-test (b, c, fk, m and o) and non-parametric Mann–Whitney test (q) were performed. P values are represented as *P < 0.05, **P < 0.01, ***P < 0.001 and ****P < 0.0001. CM, cardiomyocyte; NS, non-significant.
Extended Data Fig. 1
Extended Data Fig. 1. Analysis of S-adenosylhomocysteine and S-adenosylmethionine in A3cKO mouse hearts.
(a) Quantification of S-adenosylhomocysteine (SAH) in Ctrl (n = 5) and A3cKO (n = 5) mouse hearts at 1-month post-knockout induction (p value = 0.0209). (b) Quantification of S-adenosylmethionine (SAM) in Ctrl (n = 5) and A3cKO (n = 5) mouse hearts at 1-month post-knockout induction. Data represented as mean + s.e.m. A two-tailed parametric Student’s t-test was performed using Graph Pad Prism (V10). ns–non-significant. Source data
Extended Data Fig. 2
Extended Data Fig. 2. Electron Paramagnetic Resonance (EPR) spectroscopy analysis of reactive oxygen species in homocystine-treated H9C2 cells.
Representative EPR scan of reactive oxygen species (ROS) level in H9C2 cells treated with homocystine (an average of 10 scans is shown and 4 biological replicates were tested for each group).
Extended Data Fig. 3
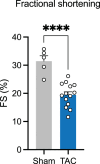
Extended Data Fig. 3. Measurement of fractional shortening 7 days post sham (n = 5) and TAC (n = 14) operated wildtype mouse hearts using echocardiography (p value < 0.0001).
Data represented as mean + s.e.m. A two-tailed parametric Student’s t-test was performed using Graph Pad Prism (V10).
Extended Data Fig. 4
Extended Data Fig. 4. Gating strategies for flow cytometric analysis.
Gating strategies for flow cytometric analysis for a. immune cells from mouse heart, b. apoptosis/necrosis assay from H9C2 cells, and c. mitophagy using mt-keima in H9C2 cells.

Similar articles

References

    1. Savarese, G. & Lund, L. H. Global public health burden of heart failure. Card. Fail. Rev.3, 7–11 (2017). - PMC - PubMed
    1. Duong, L. D., West, J. D. & Morano, K. A. Redox regulation of proteostasis. J. Biol. Chem.300, 107977 (2024). - PMC - PubMed
    1. Wang, X., Su, H. & Ranek, M. J. Protein quality control and degradation in cardiomyocytes. J. Mol. Cell. Cardiol.45, 11–27 (2008). - PMC - PubMed
    1. Rubio Gomez, M. A. & Ibba, M. Aminoacyl-tRNA synthetases. RNA26, 910–936 (2020). - PMC - PubMed
    1. Jakubowski, H. Quality control in tRNA charging. Wiley Interdiscip. Rev. RNA3, 295–310 (2012). - PubMed

MeSH terms

Substances