. 2025 Aug;31(8):2663-2672.
doi: 10.1038/s41591-025-03771-y. Epub 2025 Jun 25.

Efficacy, public health impact and optimal use of the Takeda dengue vaccine

Affiliations

Efficacy, public health impact and optimal use of the Takeda dengue vaccine

Bethan Cracknell Daniels et al. Nat Med. 2025 Aug.

Abstract

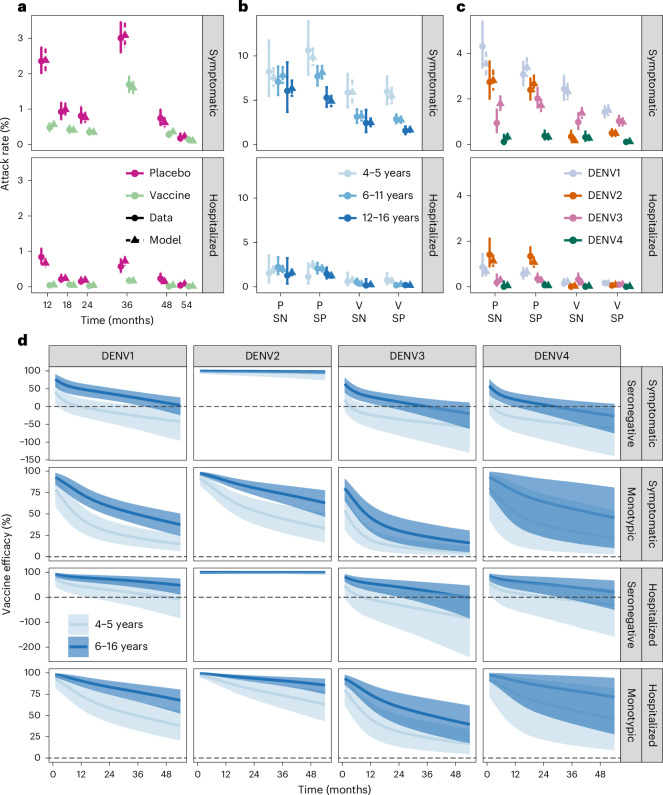
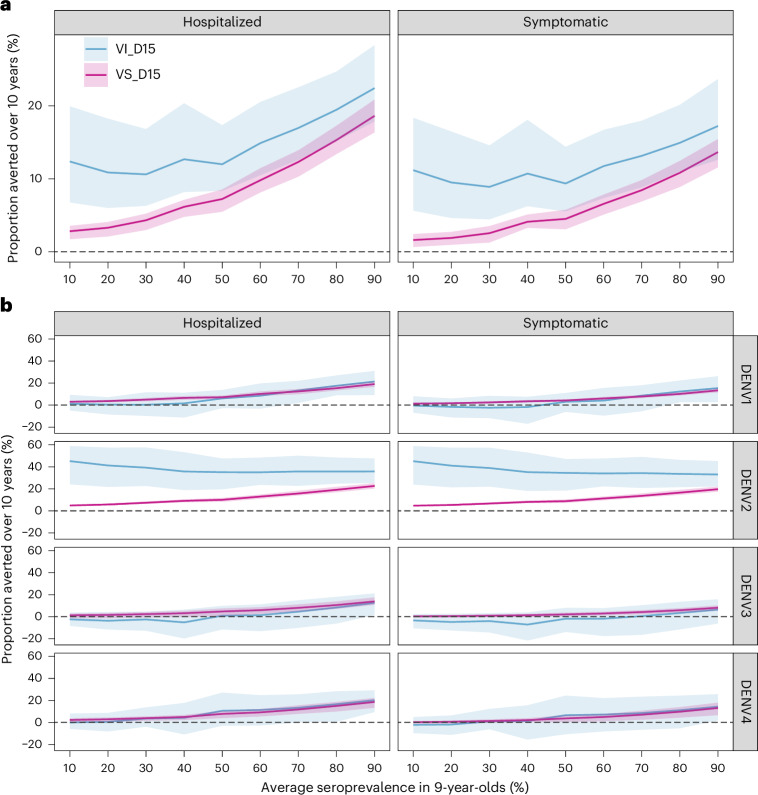
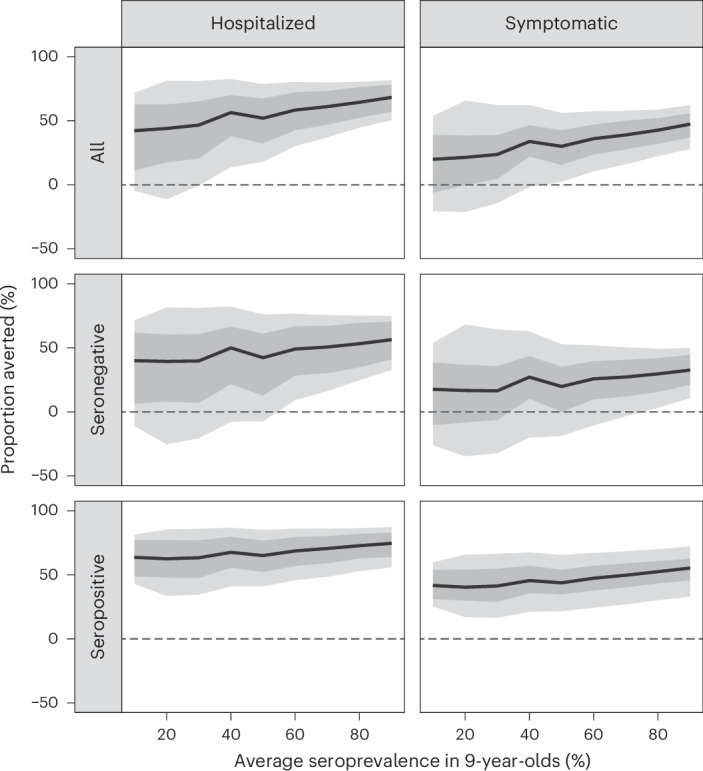
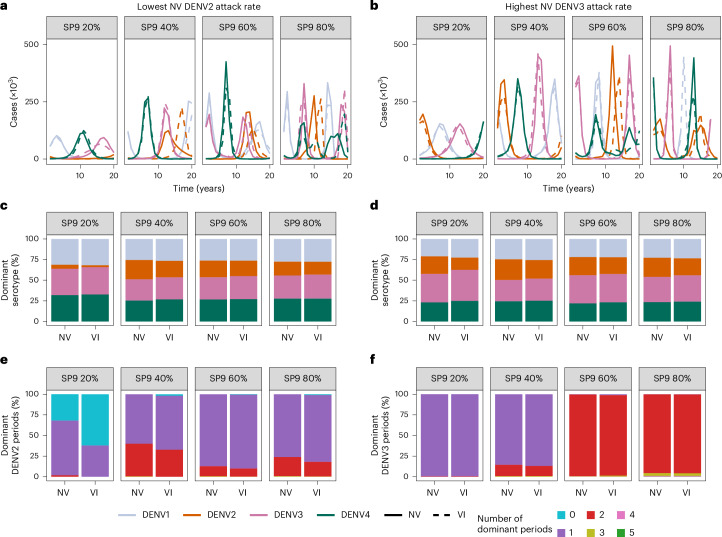
Dengue is the most common arboviral infection, causing substantial morbidity and mortality globally. The licensing of Qdenga, a second-generation vaccine developed by Takeda Pharmaceuticals, is therefore timely, but the potential public health impact of vaccination across transmission settings needs to be evaluated. To address this, we characterized Qdenga's efficacy profile using mathematical models calibrated to published clinical trial data and estimated the public health impact of routine vaccine use. We find that efficacy against both virologically confirmed dengue and hospitalization depends on the infecting serotype, serological status and age. We estimate that vaccination of children aged over 6 years in moderate-to-high dengue transmission settings (average seroprevalence in 9-year-olds > 60%) could reduce the burden of hospitalized dengue by 10-22% on average over 10 years. We find some evidence of a risk of vaccine-induced disease enhancement in seronegative vaccine recipients for dengue serotypes 3 and 4, especially for children under 6 years of age. Because of this, the benefits of vaccination in lower transmission settings are more uncertain, and more data on the long-term efficacy of Qdenga against serotypes 3 and 4 are needed.


Conflict of interest statement

Competing interests: The authors declare no competing interests.

Figures

Fig. 1
Fig. 1. Attack rate and vaccine efficacy estimates.
ac, Observed and estimated attack rates of symptomatic virologically confirmed disease and hospitalizations in the phase III clinical trial by trial arm and time (a), age, serostatus and trial arm (b), and serotype, serostatus and trial arm (c). Note that the plotted resolution is lower than the data used in the model calibration. The modeled attack rates show the mean (triangle) and 95% credible interval (CrI, dashed line) of the posterior distribution (n = 20,000 samples). The observed attack rates show the mean (circle) and 95% exact binomial confidence interval (solid line). d, Estimated vaccine efficacy by serotype, serostatus and age group, against symptomatic disease and hospitalization. The solid line represents the mean of the posterior distribution, and the shaded area represents the 95%CrI of the posterior distribution (n = 20,000 samples). The dashed horizontal line marks 0 efficacy. Vaccine efficacy in multitypic individuals is shown in Supplementary Fig. 8. P, placebo arm; SN, seronegative; SP, seropositive; V, vaccine arm.
Fig. 2
Fig. 2. Population-level impact of vaccination.
a,b, Cumulative proportion of hospitalized and symptomatic cases averted over 10 years by transmission setting (expressed as the average seroprevalence in 9-year-olds), assuming efficacy against infection and disease (VI, blue) or only against disease (VS, pink) decaying for 15 years (D15), using 80% coverage across 10 years and the Brazilian demography over all serotypes (a) and by serotype (b). The dashed horizontal line marks 0 cases averted. The solid lines represent the mean and the shaded regions represent the overall uncertainty (95%CrI) derived from n = 10,000 simulations (that is, 200 posterior distribution samples × 50 stochastic simulations per sample, see Methods for details).
Fig. 3
Fig. 3. Impact of the age at vaccination on the proportion of cases averted at the population level by transmission setting.
The colors show the cumulative proportion of hospitalized and symptomatic cases averted over 10 years by transmission setting (expressed as the average seroprevalence in 9-years-olds), and vaccine mechanism assuming vaccination at ages 6–12 years and the Brazilian demography. The dashed line shows the optimal age of vaccination for each transmission intensity. VI_D15, scenario assuming efficacy against infection and disease decaying for 15 years post-vaccination; VS_D15, scenario assuming efficacy only against disease decaying for 15 years post-vaccination.
Fig. 4
Fig. 4. Individual-level impact of vaccination.
Proportion of hospitalized and symptomatic cases averted in the first vaccinated cohort of 6-year-olds over 10 years by transmission setting, expressed as the average seroprevalence in 9-year-olds assuming a vaccination coverage of 80% using model VS_D15 (efficacy against disease decaying for 15 years post-vaccination) and the Brazilian demography. The impact is shown overall (all) and among baseline seropositive and seronegative vaccinees. The dashed horizontal line marks 0 cases averted. The solid lines represent the mean; the light shading represents the overall uncertainty (95%CrI), derived from n = 10,000 simulations (that is, 200 posterior distribution samples × 50 stochastic simulations per sample, see Methods for details); and the dark shading represents the parameter uncertainty (95%CrI), derived from 200 posterior distribution samples.
Fig. 5
Fig. 5. Cases averted by vaccination per 1,000 vaccinated children.
Absolute number of symptomatic cases and hospitalizations averted over 10 years post-second dose in the first vaccinated cohort of 6-year-olds per 1,000 fully vaccinated persons by transmission setting, expressed as the average seroprevalence in 9-year-olds, assuming model VS_D15 (efficacy against disease decaying for 15 years post-vaccination), the Brazilian demography and that 9% of symptomatic cases are hospitalized. a, Cases averted in the entire vaccinated cohort (all; blue), and among the baseline seropositive (green) and baseline seronegative (pink) vaccinees. b, Cases averted by serotype and serostatus. The bars represent the mean, and the error bars represent the overall uncertainty (95%CrI) derived from n = 10,000 simulations (that is, 200 posterior distribution samples × 50 stochastic simulations per sample, see Methods for details).
Fig. 6
Fig. 6. Impact of vaccination on serotype dynamics.
af, For the n = 1,000 simulations with the lowest DENV2 burden (a,c,e) and the highest DENV3 burden (b,d,f) in the absence of vaccination, across transmission settings (SP9, average seroprevalence in 9-year-olds) with (VI) and without (NV) vaccination, we show example serotype-specific (color) transmission dynamics with (dashed line) and without vaccination (solid line) (a,b), the mean proportion of time that each serotype (color) is dominant (c,d), and the proportion of simulations in which DENV2 (e) and DENV3 (f) become the dominant serotype for the specified number of seasons (colors), over a 20-year period since the start of vaccination.

References

    1. Halstead, S. B. Dengue antibody-dependent enhancement: knowns and unknowns. Microbiol. Spectr.10.1128/microbiolspec.aid-0022-2014 (2014). - PubMed
    1. Halstead, S. & O’Rourke, E. Dengue viruses and mononuclear phagocytes. I. Infection enhancement by non-neutralizing antibody. J. Exp. Med.146, 201–217 (1977). - PMC - PubMed
    1. Sridhar, S. et al. Effect of dengue serostatus on dengue vaccine safety and efficacy. N. Engl. J. Med.379, 327–340 (2018). - PubMed
    1. Ferguson, N. M. et al. Benefits and risks of the Sanofi-Pasteur dengue vaccine: modeling optimal deployment. Science353, 1033–1036 (2016). - PMC - PubMed
    1. Reich, N. G. et al. Interactions between serotypes of dengue highlight epidemiological impact of cross-immunity. J. R. Soc. Interface10, 20130414 (2013). - PMC - PubMed

Substances

LinkOut - more resources