. 2025 Jun 25;26(1):179.
doi: 10.1186/s13059-025-03647-x.

Mapping MAVE data for use in human genomics applications

Affiliations

Mapping MAVE data for use in human genomics applications

Jeremy A Arbesfeld et al. Genome Biol. .

Abstract

Background: Experimental data from functional assays have a critical role in interpreting the impact of genetic variants. Assay data must be unambiguously mapped to a reference genome to make it accessible, but it is often reported relative to assay-specific sequences, complicating downstream use and integration of variant data across resources. To make multiplexed assays of variant effect (MAVE) data more broadly available to the research and clinical communities, the Atlas of Variant Effects Alliance mapped MAVE data from the MaveDB community database to human reference sequences, creating an extensive set of machine-readable homology mappings that are incorporated into widely used human genomics applications.

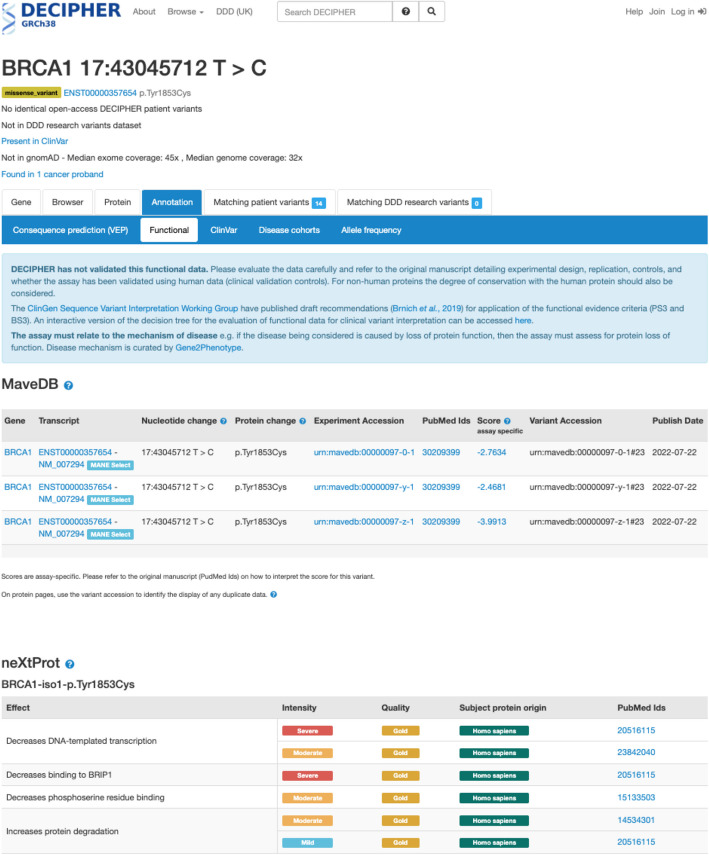
Results: Here, we map approximately 9.0 million individual protein and nucleotide variants in MaveDB to the human genome, describing the examined variants with respect to human reference sequences while preserving the data provenance of the original MAVE sequences. We then disseminate the results to major genomic resources including the Genomics 2 Proteins Portal, UCSC Genome Browser, Ensembl Variant Effect Predictor, and DECIPHER platform. Within these applications, MAVE variants can now be visualized and integrated with other relevant clinical and biological data, making additional knowledge available when performing variant interpretation and conducting other research activities.

Conclusions: Mapping MAVE variants to human reference sequences and sharing the mapped dataset with several key human genomics applications enables a new and diverse set of applications for MAVE data. This study provides increased access to functional data that can assist in clinical variant interpretation pipelines and enable biomedical research and discovery.

Keywords: Deep mutational scanning; Functional assay; Genomic medicine; Genomics; Global Alliance for Genomics and Health; Massively parallel reporter assays; Multiplexed assays of variant effect; Variation representation specification.


Conflict of interest statement

Declarations. Ethics approval and consent to participate: Not applicable. Consent for publication: Not applicable. Competing interests: The authors declare that they have no competing interests. Review history: The review history is available as Additional file 7. Peer review information: Yang Li and Veronique van den Berghe were the primary editors of this article and managed its editorial process and peer review in collaboration with the rest of the editorial team.

Figures

Fig. 1
Fig. 1
Objectives and challenges for mapping MAVE data to human reference sequences. A Data from MaveDB are described on user-submitted experimental sequences. To make these data accessible on human reference sequences, mappings are required to translate the experimental variant coordinates to human reference systems such as GRCh38. B MAVE sequences are often not identical due to structural features of the assay, such as codon optimization in polysome profiling assays [20]. In this example, there is a synonymous nucleotide difference between the target and reference sequences that optimizes translation of the sequence in the assay. C MAVE sequences can contain assay-specific functional elements that do not align to the human genome, such as minigenes used in saturation mutagenesis-based assays [21]. D MAVE protein variants may represent changes that would span exon boundaries on the human genome, but occur on a contiguous region on reverse-transcribed assay sequences [22, 23]
Fig. 2
Fig. 2
Integration and visualization of MAVE data into the Genomics 2 Proteins (G2P) Portal. The G2P Portal displays the MAVE scores (average score per residue) and outliers (mutations with MAVE scores that are 99th percentile top and bottom of the distribution of the corresponding score set) on both protein sequences and three-dimensional structures. A MAVE data mapped on the protein sequence along with clinical data and additional sequence and structure annotations such as protein secondary structures, protein–protein interactions, and domain annotations. For the selected gene TP53 [43] (https://g2p.broadinstitute.org/gene/TP53/protein/P04637), the mapping showed an overlap across the locations of pathogenic mutations in ClinVar (indicated using orange rectangle and arrow), the DNA-binding domain annotation from UniProt database (indicated using dark blue rectangle and arrow), and the hotspot according to average MAVEs (indicated using gray rectangle and arrow). The presence of high scoring MAVE variants indicates a potential effect on the DNA-binding domain for TP53. B MAVE data mapped on the AlphaFold-predicted protein structure, highlighting the hotspot identified in MAVE score set urn:mavedb:00000068-a-1 (indicated using a black arrow) on the DNA-binding domain (dark blue) of the tumor suppressor protein p53
Fig. 3
Fig. 3
Integrating MAVE data as a custom track hub in the UCSC Genome Browser. An illustration of MAVE data in the UCSC Genome Browser. MAVE protein variant positions are mapped to their corresponding genomic coordinates, and consequence scores are reported for each variant via mouseover text. This example illustrates the MaveDB score sets urn:mavedb:00000068-a-1, urn:mavedb:00000068-b-1, and urn:mavedb:00000068-c-1. In these experiments, mutated TP53 was added to a cell line depleted of wild-type TP53 with the following treatments: etoposide, a DNA double-strand break-inducing agent (top); nutlin-3, which impairs proliferation of TP53 by suppressing the interaction between p53 and MDM2 (middle); and nultlin-3 plus wild-type TP53 (bottom) [45]. The heatmaps render the log ratio of cell counts before and after treatment, with colors ranging from blue (lowest) to red (highest). Amino acid positions 332, 337, 338, 341, 344, and 348 (indicated by pink boxes) show contrasting responses in the non-conservative amino acid substitutions (roughly, the lower two-thirds of each heatmap). These positions are involved in the formation of p53 tetramers. Other data informing the clinical impact of variation in these positions is illustrated by the pathogenic variants (red) in the ClinVar SNVs, and the OMIM [49] allelic variant phenotypes 191170.0031 (Li-Fraumeni syndrome) and 191170.0035 (adrenocortical carcinoma). These data are accessible via a UCSC Genome Browser session [50] (https://genome.ucsc.edu/s/mcline/MaveDB_TP53_Figure)
Fig. 4
Fig. 4
MAVE data available within the Ensembl Variant Effect Predictor. Ensembl VEP [52] (https://www.ensembl.org/Multi/Tools/VEP) output showing a batch of variants (see Additional file 4) annotated with MAVE results. The scores and a link to the associated score set information in MaveDB are reported, when available. Results can be filtered for the specific MaveDB score ranges considered to be of interest. The displayed example includes a subset of MAVE variants in the CCR5 gene across experiment set urn:mavedb:00000047 along with their associated REVEL [53] and CADD PHRED [54] scores
Fig. 5
Fig. 5
Integrating MAVE data into DECIPHER. The nucleotide change, protein change, experiment accession, PubMed ID, assay-specific variant effect score, variant accession, and publish date are included for MAVE data displayed in DECIPHER, with links to the experimental details and score set in MaveDB. DECIPHER also includes an interactive decision tree to assist in evaluating the functional data for clinical variant interpretation. The displayed example highlights the functional consequences of a tyrosine to cysteine substitution at residue 1853 in BRCA1 [61] (https://www.deciphergenomics.org/sequence-variant/17–43045712-T-C/annotation/functional) across three different score sets. In this example, MAVE evidence can be linked with neXtProt annotations [62] to provide insights into the potential impact of the variant on biological function

Update of

Similar articles

References

    1. Henrie A, Hemphill SE, Ruiz-Schultz N, Cushman B, DiStefano MT, Azzariti D, et al. ClinVar Miner: demonstrating utility of a web-based tool for viewing and filtering ClinVar data. Hum Mutat. 2018;39:1051. - PMC - PubMed
    1. Landrum MJ, Lee JM, Riley GR, Jang W, Rubinstein WS, Church DM, et al. ClinVar: public archive of relationships among sequence variation and human phenotype. Nucleic Acids Res. 2014;42:D980. - PMC - PubMed
    1. Brnich SE, Abou Tayoun AN, Couch FJ, Cutting GR, Greenblatt MS, Heinen CD, et al. Recommendations for application of the functional evidence PS3/BS3 criterion using the ACMG/AMP sequence variant interpretation framework. Genome Med. 2019;12:1–12. - PMC - PubMed
    1. Richards S, Aziz N, Bale S, Bick D, Das S, Gastier-Foster J, et al. Standards and guidelines for the interpretation of sequence variants: a joint consensus recommendation of the American College of Medical Genetics and Genomics and the Association for Molecular Pathology. Genet Med. 2015;17:405–24. - PMC - PubMed
    1. Pejaver V, Byrne AB, Feng B-J, Pagel KA, Mooney SD, Karchin R, et al. Calibration of computational tools for missense variant pathogenicity classification and ClinGen recommendations for PP3/BP4 criteria. Am J Hum Genet. 2022;109:2163–77. - PMC - PubMed

LinkOut - more resources