. 2025 Jun 25;15(1):89.
doi: 10.1186/s13578-025-01422-w.

Kv1.1 channel dysfunction in parvalbumin-positive interneurons contributes to anxiety-like behaviors in young adult presenilin 1/2 conditional double knockout mice

Affiliations

Kv1.1 channel dysfunction in parvalbumin-positive interneurons contributes to anxiety-like behaviors in young adult presenilin 1/2 conditional double knockout mice

Guang Yang et al. Cell Biosci. .

Abstract

Anxiety occurs in the early stage of cognitive disorders, which can exacerbate cognitive impairment. However, the pathogenesis of this kind of anxiety remains unclear. In this study, we investigated anxiety-like behaviors in young adult presenilin 1/2 conditional double knockout (PS cDKO) mice, a model of progressive cognitive impairment, using behavioral tests and electrophysiological recordings. Disrupted excitatory/inhibitory (E/I) balance was observed in pyramidal neurons (PNs) of the ventral hippocampus (vHPC) CA1 (vCA1) region of PS cDKO mice. Meanwhile, PV + interneurons showed hypoexcitability, associated with increased outward K+ currents due to elevated Kv1.1 potassium channel levels. Importantly, genetic or pharmacological inhibition of Kv1.1 restored PV + interneuron activity and reduced anxiety-like behaviors. These findings highlight a role of Kv1.1 in controlling PV + interneuron excitability, suggesting that targeting Kv1.1 in vCA1 PV + interneurons could mitigate anxiety in early-stage cognitive dysfunction.

Keywords: Anxiety; Cognitive disorder; Excitatory/inhibitory balance; Kv1.1; Parvalbumin-positive interneurons.


Conflict of interest statement

Declarations. Ethical approval: All animal procedures were conducted in strict accordance with the Guidelines of the National Institutes of Health on the Care and Use of Animals and were approved by the Animal Care and Use Committee of Shanghai University of Traditional Chinese Medicine (ethical approval number: PZSHUTCM210108008). Competing interests: The authors declare no competing interests.

Figures

Fig. 1
Fig. 1
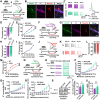
Increased anxiety-like behaviors and impaired E/I balanced inputs received by vCA1 PNs in young adult PS cDKO mice. A Schematic illustration depicting the breeding process of PS cDKO mice (left) and the experimental timeline and diagrams of the behavioral test (middle) and electrophysiology recording (right). B Representative heatmaps of WT and PS cDKO mice in the open field test (OFT). Red indicates more time, and blue indicates less time. C-E Percentage of time spent in the margin zone (C), mean velocity (D) and total distance moved in the open field (E) in OFT (n = 13 mice). F Movement tracks of WT and PS cDKO mice in the light/dark box (LDB) test. G-J Time spent (G) and total distance traveled (I) in the light chamber, time spent in the dark chamber (H) and the number of transitions between light and dark chambers (j) in the LDB test (n = 13 mice). K Representative heatmaps of WT and PS cDKO mice in the elevated plus maze (EPM) test. Red indicates more time, and blue indicates less time. L-N Open arm entries (J), time spent in the open arm (M) and in the closed arm (N) in the EPM test (n = 13 mice). O Sucrose preference percentage in the sucrose preference test (SPT) (n = 13 mice). P Schematic illustration depicting the recorded vCA1 PNs. Q Representative traces of spontaneous excitatory postsynaptic currents (sEPSCs) and spontaneous inhibitory postsynaptic currents (sIPSCs) recorded in PNs from WT and PS cDKO mice. Scale bar, 20 pA, 200 ms. R-S sEPSCs frequency (R) and amplitude (S) (n = 17 neurons from 5 mice per group). T-U sIPSCs frequency (T) and amplitude (U) (n = 17 neurons from 5 mice per group). V-W Charge transfer of sEPSCs (V) and sIPSCs (W) (n = 17 neurons from 5 mice per group). X The ratio of sEPSC/sIPSC charge transfer (n = 17 neurons from 5 mice per group). Data are shown as mean ± S.E.M. Unpaired t test was applied in (C-E), (G-J), (L-O), and (R-X). **P < 0.01, ***P < 0.001
Fig. 2
Fig. 2
Reduced excitability of PV + interneurons and upregulated Kv1.1-mediated currents in vCA1 PV + interneurons of young adult PS cDKO; GAD mice. A Schematic illustration depicting the breeding process of PS cDKO; GAD mice (upper left), the experimental timeline (lower), and the recorded vCA1 PV + interneurons (upper right). B Representative confocal images showing the colabeling of GAD67 (green)-positive interneurons in the vCA1 region with PV (purple) and biocytin (red) antibodies. Scale bar, 50 μm. C Representative traces of action potentials (APs) obtained in response to a 50-pA step injection of current in PV + interneurons (left) and representative traces of single APs recorded in PV + interneurons (right) from WT; GAD and PS cDKO; GAD mice. Scale bar, left: 40 mV, 500 ms; right: 25 mV, 2.5 ms. D-E AP threshold (D) and firing frequency (E) of PV + interneurons from WT; GAD and PS cDKO; GAD mice in response to 50-pA current step injections (n = 13 neurons from 5 mice for the WT; GAD group, n = 15 neurons from 5 mice for the PS cDKO; GAD group). F Schematic illustration depicting the experimental timeline and the recorded vCA1 “regular spiking” interneurons. G Representative confocal image showing the colabeling of GAD67 (green)-positive interneurons in the vCA1 region with biocytin (red) antibody but not with PV (purple) antibody. Scale bar, 50 μm. H-I AP threshold (H) and firing frequency (I) of “regular spiking” interneurons from WT; GAD and PS cDKO; GAD mice in response to 50-pA current step injections (n = 11 neurons from 5 mice per group). J Schematic illustration depicting the experimental timeline, and the recorded vCA1 PNs. K Representative traces of APs obtained in response to a 50-pA step injection of current in PNs from WT; GAD and PS cDKO; GAD mice. Scale bar, 60 mV, 500 ms. L-M AP threshold (L) and firing frequency (M) of PNs from WT; GAD and PS cDKO; GAD mice in response to 50-pA current step injections (n = 19 neurons from 4 mice per group). N Schematic illustration depicting the experimental timeline and the recorded vCA1 PV + interneurons. O Representative traces of K+ currents elicited by trains of voltage steps from − 80 mV to + 20 mV in 10 mV increments from the holding potential of -80 mV in the absence or presence of DTx-K in PV + interneurons from WT; GAD and PS cDKO; GAD mice. Scale bar, 1 nA, 100 ms. P Current-voltage (I-V) relationship of total K+ currents in PV + interneurons from WT; GAD and PS cDKO; GAD mice in the absence of DTx-K (n = 7 neurons from 3 mice per group). QI-V relationship of outward K+ currents in PV + interneurons from WT; GAD and PS cDKO; GAD mice in the presence of DTx-K (n = 7 neurons from 3 mice per group). RI-V curves showing DTx-K-sensitive K+ currents obtained by subtracting the currents in the DTx-K condition from those in the TTX condition (n = 7 neurons from 3 mice per group). S Representative immunoblot of Kv1.1 protein from ventral hippocampal lysates of WT; GAD and PS cDKO; GAD mice. Uncropped immunoblots are shown in Supplementary file. T Densitometry of the data presented in (S) (n = 6 mice per group). U mRNA expression level of Kv1.1 from ventral hippocampal lysates of WT; GAD and PS cDKO; GAD mice (n = 6 mice per group). Data are shown as mean ± S.E.M. Unpaired t test was applied in (D), (H), (L), and (T-U). Two-way Repeated Measures ANOVA with Bonferroni’s multiple comparisons test was applied in (E), (I), (M), and (P-R). *P < 0.05, **P < 0.01, ***P < 0.001
Fig. 3
Fig. 3
Ameliorated anxiety-like behaviors, decreased K+ currents, and elevated excitability of PV + interneurons after pharmacological inhibition of Kv1.1 in the vCA1 of young adult PS cDKO mice. A Schematic illustration depicting bilateral stereotaxic injection of DTx-K into the vCA1 region (upper) and the experimental timeline (lower). Mice were injected once with DTx-K. B-D Percentage of time spent in the margin zone (B), mean velocity (C), and total distance moved in the open field (D) in the open field test (OFT) (n = 10 mice per group). E-H Time spent (E) and total distance traveled (G) in the light chamber, time spent in the dark chamber (F) and the number of transitions between light and dark chambers (H) in the light/dark box (LDB) test (n = 10 mice per group). I-K Open arm entries (I), time spent in the open arm (J) and in the closed arm (K) in the elevated plus maze (EPM) test (n = 10 mice per group). L Schematic illustration depicting the recorded vCA1 PV + interneurons. M Representative traces of K+ currents elicited by trains of voltage steps from − 80 mV to + 20 mV in 10 mV increments from the holding potential of -80 mV in PV + interneurons from WT + Veh (vehicle), cDKO + Veh, and cDKO + DTx-K mice. Scale bar, 1 nA, 100 ms. N Current-voltage (I-V) relationship of K+ currents in PV + interneurons from WT + Veh, cDKO + Veh, and cDKO + DTx-K mice (n = 15 neurons from 6 mice for the WT + Veh group, n = 29 neurons from 9 mice for the cDKO + Veh group, n = 20 neurons from 8 mice for the cDKO + DTx-K group). O Representative traces of action potentials (APs) obtained in response to a 50-pA step injection of current in PV + interneurons from WT + Veh, cDKO + Veh, and cDKO + DTx-K mice. Scale bar, 40 mV, 500 ms. P-Q AP threshold (P) and firing frequency (Q) of PV + interneurons from WT + Veh, cDKO + Veh, and cDKO + DTx-K mice in response to 50-pA current step injections (n = 14 neurons from 4 mice for the WT + Veh group, n = 16 neurons from 4 mice for the cDKO + Veh group, n = 13 neurons from 4 mice for the cDKO + DTx-K group). Data are shown as mean ± S.E.M. One-way ANOVA with Bonferroni’s multiple comparisons test was applied in (B-K) and (P). Two-way Repeated Measures ANOVA with Bonferroni’s multiple comparisons test was applied in (N) and (Q). *P < 0.05, **P < 0.01, ***P < 0.001. NS, not significant
Fig. 4
Fig. 4
Attenuated anxiety-like behaviors after genetic inhibition of Kv1.1 in the vCA1 of young adult PS cDKO mice. A Schematic illustration depicting the AAV-S5E2-PV-shRNA-Kv1.1-mCherry-WPRE (AAV-shKv1.1) and AAV-S5E2-PV-shRNA-scramble-mCherry-WPRE (AAV) viral vectors (upper) and the experimental timeline (lower). B Schematic illustration depicting bilateral stereotaxic injection of AAV-shKv1.1-mcherry into the vCA1 region (upper) and a representative image showing mCherry-labeled PV + interneurons in the whole hippocampus (HPC) of cDKO + AAV-shKv1.1 mice. Scale bar, 2000 μm. C The proportion of cells colabeled with PV antibody (green) and mCherry (red) among PV interneurons and mCherry-labeled neurons (n = 6 slices from 3 mice). D Representative confocal images showing the colabeling of AAV-shKv1.1 (red)-positive interneurons in the vCA1 region with PV (green) antibody. Scale bar, 25 μm. E Representative confocal images showing the colabeling of PV-positive interneurons (green, stained with PV antibody) in the vCA1 region with Kv1.1 (purple) antibody. Scale bar, 25 μm. F The fluorescence intensity of Kv1.1 in PV-positive interneurons (n = 6 slices from 3 mice). G-H Protein expression level of Kv1.1 from ventral hippocampal lysates (membrane fraction) of WT, cDKO, cDKO + AAV-shKv1.1, cDKO + AAV, and WT + AAV mice (n = 6 mice per group). I mRNA expression level of Kv1.1 from ventral hippocampal lysates of WT, cDKO, cDKO + AAV-shKv1.1, cDKO + AAV, and WT + AAV mice (n = 6 mice per group). Uncropped immunoblots are shown in Supplementary file. J-L Percentage of time spent in the margin zone (J), mean velocity (K), and total distance moved in the open field (L) in the open field test (OFT) (n = 12 mice per group). M-P Time spent (M) and total distance traveled (O) in the light chamber, time spent in the dark chamber (N) and the number of transitions between light and dark chambers (P) in the light/dark box (LDB) test (n = 12 mice per group). Q-S Open arm entries (Q), time spent in the open arm (R) and in the closed arm (S) in the elevated plus maze (EPM) test (n = 12 mice per group). Data are shown as mean ± S.E.M. Unpaired t test was applied in (C). One-way ANOVA with Bonferroni’s multiple comparisons test was applied in (F) and (H-S). *P < 0.05, **P < 0.01, ***P < 0.001
Fig. 5
Fig. 5
Elevated excitability of PV + interneurons after genetic inhibition of Kv1.1 in the vCA1 of young adult PS cDKO mice. A Schematic illustration depicting the recorded vCA1 PV + interneurons. B Current-voltage (I-V) relationship of K+ currents in PV + interneurons from WT, cDKO, cDKO + AAV-shKv1.1, cDKO + AAV, and WT + AAV mice (n = 8 neurons from 4 mice per group). C-D AP threshold (C) and firing frequency (D) of PV + interneurons from WT, cDKO, cDKO + AAV-shKv1.1, cDKO + AAV, and WT + AAV mice in response to 50-pA current step injections (n = 14 neurons from 4 mice for the WT group, n = 15 neurons from 4 mice for the cDKO group, n = 16 neurons from 4 mice for the cDKO + AAV-shKv1.1 group, n = 12 neurons from 4 mice for the cDKO + AAV group, n = 15 neurons from 4 mice for the WT + AAV group). E Schematic illustration depicting the recorded vCA1 PNs. F Representative traces of spontaneous excitatory postsynaptic currents (sEPSCs) and spontaneous inhibitory postsynaptic currents (sIPSCs) recorded in PNs from WT, cDKO, cDKO + AAV-shKv1.1, cDKO + AAV, and WT + AAV mice. Scale bar, 20 pA, 200 ms. G-H sEPSCs frequency (G) and amplitude (H) (n = 17 neurons from 5 mice per group). I-J sIPSCs frequency (I) and amplitude (J) (n = 17 neurons from 5 mice per group). K-L Charge transfer of sEPSCs (K) and sIPSCs (L) (n = 17 neurons from 5 mice per group). M The ratio of sEPSC/sIPSC charge transfer (n = 17 neurons from 5 mice per group). Data are shown as mean ± S.E.M. Two-way Repeated Measures ANOVA with Bonferroni’s multiple comparisons test was applied in (B) and (D). One-way ANOVA with Bonferroni’s multiple comparisons test was applied in (C) and (G-M). *P < 0.05, **P < 0.01, ***P < 0.001
Fig. 6
Fig. 6
A schematic diagram for Kv1.1 in vCA1 PV + interneurons regulating anxiety-like behaviors in young adult PS cDKO mice

Similar articles

References

    1. Gallagher D, Fischer CE, Iaboni A. Neuropsychiatric symptoms in mild cognitive impairment. Can J Psychiatry. 2017;62:161–9. 10.1177/0706743716648296. - PMC - PubMed
    1. Sun L, Li W, Qiu Q, Hu Y, Yang Z, Xiao SF. Anxiety adds the risk of cognitive progression and is associated with axon/synapse degeneration among cognitively unimpaired older adults. eBioMedicine. 2023;94:104703. 10.1016/j.ebiom.2023.104703. - PMC - PubMed
    1. Santabárbara J, Lopez-Anton R, de la Cámara C, Lobo E, Gracia-García P, Villagrasa B, et al. Clinically significant anxiety as a risk factor for dementia in the elderly community. Acta Psychiatr Scand. 2019;139:6–14. 10.1111/acps.12966. - PubMed
    1. Geda YE, Smith GE, Knopman DS, Boeve BF, Tangalos EG, Ivnik RJ, et al. De Novo genesis of neuropsychiatric symptoms in mild cognitive impairment (MCI). Int Psychogeriatr. 2004;16:51–60. 10.1017/s1041610204000067. - PubMed
    1. Lyketsos CG, Lopez O, Jones B, Fitzpatrick AL, Breitner J, DeKosky S. Prevalence of neuropsychiatric symptoms in dementia and mild cognitive impairment. JAMA. 200;288:1475–83. 10.1001/jama.288.12.1475. - PubMed

LinkOut - more resources