. 2025 May 28;14(6):649.
doi: 10.3390/antiox14060649.

Transcriptomic Analysis of the Liver Redox Response During Food-Anticipatory Activity Under a Time-Restricted Feeding Protocol in Rats

Affiliations

Transcriptomic Analysis of the Liver Redox Response During Food-Anticipatory Activity Under a Time-Restricted Feeding Protocol in Rats

Adrián Báez-Ruiz et al. Antioxidants (Basel). .

Abstract

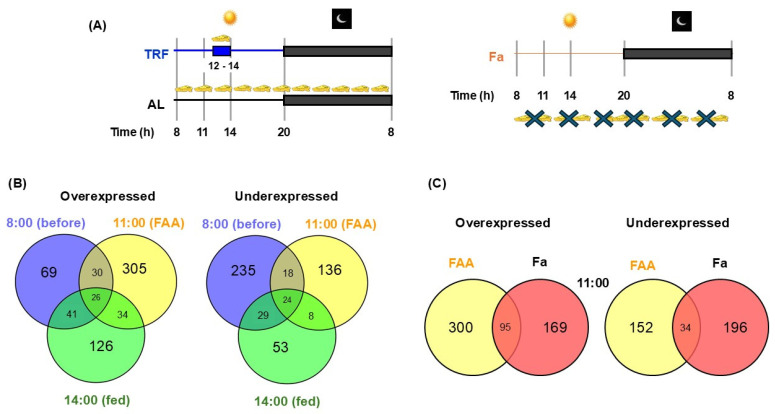
Daytime-restricted feeding (TRF) exerts outstanding effects on circadian physiology, nutrient utilization, and energy metabolism. Limiting feeding access to two hours during the daytime (12:00-14:00 h) for three weeks promotes food-anticipatory activity (FAA). FAA encompasses not only behaviors related to meal expectations but also includes diurnal fluctuations in liver metabolic responses, including distinct redox handling. Hepatic microarray profiles of genes associated with redox response processes were analyzed at three crucial time points: at the beginning of the light period or before FAA (08:00 h), during the expression of FAA (11:00 h), and after feeding (14:00 h). Data on fasting and nutrient processing were integrated, whereas circadian implications were extrapolated by comparing the TRF transcriptional output with a one-day fasting group. Transcripts of redox reactions, such as reactive oxygen species (ROS) generation, antioxidant defenses, NAD+/NADH equilibrium, and glutathione, hydrogen peroxide (H2O2), arginine, nitric oxide (NO), and hydrogen sulfide (H2S) metabolism, were analyzed. Results showed a decline in antioxidant defenses at 08:00 h, followed by a burst of pro-oxidant reactions, preparation of glutathione metabolism factors, and a tendency to decrease H2O2 and increase NO and H2S during the FAA. Most of the findings observed during the FAA were absent in response to one-day fasting. Hence, TRF involves concerted and sequential responses in liver pro-oxidant and antioxidant reactions, facilitating a redox-related circadian control that optimizes the metabolic utilization of nutrients, which differs from a response to a simple fast-feed cycle.

Keywords: food-anticipatory activity; metabolism; redox; time-restricted feeding.


Conflict of interest statement

The authors declare no conflicts of interest.

Figures

Figure 1
Figure 1
Experimental procedure and Venn diagram of microarray data analysis. (A) Schematic of the experimental protocols indicating the daily food access under ad libitum feeding (AL) or time-restricted feeding (TRF, food access for 2 h) for 3 weeks. One-day fasting (Fa) group was submitted to 21 h of fasting. The Venn diagram shows numbers of overexpressed and underexpressed genes in the liver of rats (B) under TRF at 08:00 h (before FAA), 11:00 h (FAA), and 14:00 h (fed rats), and (C) at 11:00 h under TRF, and Fa. The microarray analysis of every time point was performed relative to ad libitum conditions at the same time.
Figure 2
Figure 2
Categories of redox-related genes modified by TRF and Fa. Biological processes were obtained by GSEA analysis. Pie charts show the number of genes (shown in parentheses) that were underexpressed (left) or overexpressed (right) by at least two-fold. (A) 08:00 h, (B) 11:00 h, (C) 14:00 h under TRF, and (D) Fa at 11:00 h. The microarray analysis of every time point was performed relative to ad libitum conditions at the same time.
Figure 2
Figure 2
Categories of redox-related genes modified by TRF and Fa. Biological processes were obtained by GSEA analysis. Pie charts show the number of genes (shown in parentheses) that were underexpressed (left) or overexpressed (right) by at least two-fold. (A) 08:00 h, (B) 11:00 h, (C) 14:00 h under TRF, and (D) Fa at 11:00 h. The microarray analysis of every time point was performed relative to ad libitum conditions at the same time.
Figure 3
Figure 3
Heatmap of differentially expressed genes involved in the liver redox state (A) under TRF at 08:00 h, 11:00 h, and 14:00 h, and (B) under TRF and Fa at 11:00 h. All data are related to ad libitum conditions at the same time. The color scale indicates the magnitude of fold change (range = −4 to 4).
Figure 3
Figure 3
Heatmap of differentially expressed genes involved in the liver redox state (A) under TRF at 08:00 h, 11:00 h, and 14:00 h, and (B) under TRF and Fa at 11:00 h. All data are related to ad libitum conditions at the same time. The color scale indicates the magnitude of fold change (range = −4 to 4).
Figure 4
Figure 4
Differentially expressed genes of liver redox processes-related pathways: (A) glutathione, (B) hydrogen peroxide, (C) nitric oxide, (D) hydrogen sulfide, (E) stress response, and (F) redox homeostasis. Comparison of gene expression in terms of fold change as measured by microarrays based on data from Luna-Moreno, et al. 2007 [22]. Fold changes represent expression level of genes relative to ad libitum group. Comparison at 8:00 h, 11:00 h, and 14:00 h in TRF group (left panel), and comparison between TRF and Fa groups at 11:00 h (right panel).
Figure 4
Figure 4
Differentially expressed genes of liver redox processes-related pathways: (A) glutathione, (B) hydrogen peroxide, (C) nitric oxide, (D) hydrogen sulfide, (E) stress response, and (F) redox homeostasis. Comparison of gene expression in terms of fold change as measured by microarrays based on data from Luna-Moreno, et al. 2007 [22]. Fold changes represent expression level of genes relative to ad libitum group. Comparison at 8:00 h, 11:00 h, and 14:00 h in TRF group (left panel), and comparison between TRF and Fa groups at 11:00 h (right panel).

Similar articles

References

    1. Mishra A., Sobha D., Patel D., Suresh P.S. Intermittent fasting in health and disease. Arch. Physiol. Biochem. 2024;130:755–767. doi: 10.1080/13813455.2023.2268301. - DOI - PubMed
    1. Kolbe I., Brehm N., Oster H. Interplay of central and peripheral circadian clocks in energy metabolism regulation. J. Neuroendocrinol. 2019;31:e12659. doi: 10.1111/jne.12659. - DOI - PubMed
    1. García-Gaytán A.C., Miranda-Anaya M., Turrubiate I., López-De Portugal L., Bocanegra-Botello G.N., López-Islas A., Díaz-Muñoz M., Méndez I. Synchronization of the circadian clock by time-restricted feeding with progressive increasing calorie intake. Resemblances and differences regarding a sustained hypocaloric restriction. Sci. Rep. 2020;10:10036. doi: 10.1038/s41598-020-66538-0. - DOI - PMC - PubMed
    1. Pendergast J.S., Yamazaki S. The Mysterious Food-Entrainable Oscillator: Insights from Mutant and Engineered Mouse Models. J. Biol. Rhythm. 2018;33:458–474. doi: 10.1177/0748730418789043. - DOI - PMC - PubMed
    1. Aguilar-Roblero R., Díaz-Muñoz M. Chronostatic adaptations in the liver to restricted feeding: The FEO as an emergent oscillator. Sleep Biol. Rhythm. 2010;8:9–17. doi: 10.1111/j.1479-8425.2009.00415.x. - DOI

LinkOut - more resources