. 2025 Jun 15;14(6):736.
doi: 10.3390/antiox14060736.

Redox Imbalance Is Associated with Neuronal Apoptosis in the Cortex of Neonates Gestated Under Chronic Hypoxia

Affiliations

Redox Imbalance Is Associated with Neuronal Apoptosis in the Cortex of Neonates Gestated Under Chronic Hypoxia

Esteban G Figueroa et al. Antioxidants (Basel). .

Abstract

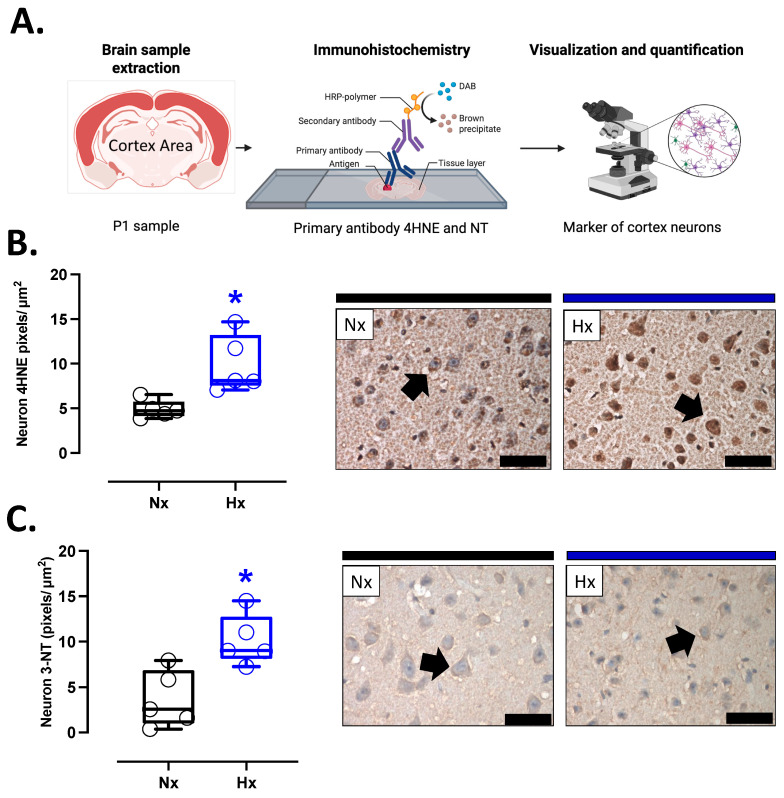
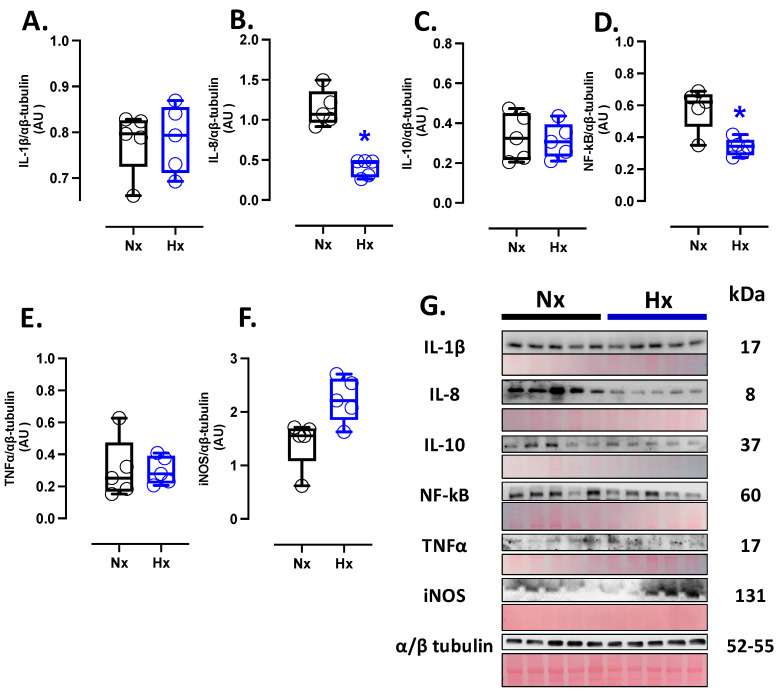
Gestational chronic hypoxia impacts prenatal development, leading to fetal growth restriction (FGR), defined as the fetus's failure to reach its genetic growth potential. Postnatal hypoxia in the cerebral tissue can induce a redox imbalance and mitochondrial dysfunction, consequently increasing neuronal death. However, these data cannot necessarily be extrapolated to prenatal hypoxia. In this regard, this study aims to describe the effect of gestational hypoxia on redox balance and apoptosis cell death mechanisms in the prefrontal cortex of guinea pigs. Ten Guinea pig (Cavia porcellus) pregnant dams were utilized in this study; five gestated in normoxia (Nx; three newborn males, and two females) and five gestated under chronic hypobaric hypoxia (Hx; two newborn males, and three females). We monitored the pregnancies by ultrasound examinations from gestational days 20 to 65 (term ~ 70). At birth, pups were euthanized, and the fetal brain was collected for cellular redox measurement, mitochondrial enzyme expression, and apoptosis assay. Gestation under hypoxia induced an imbalance in the expression of anti- and pro-oxidant enzymes, resulting in increased oxidative stress. Additionally, a decrease in cytochrome I and III expression and neuronal density in the neonatal prefrontal cortex was observed. Finally, DNA fragmentation was increased by the TUNEL assay in the brain tissue of newborns gestated under chronic hypoxia. Our findings demonstrate the association of gestational hypoxia with oxidative stress and neuronal death in newborns, which may predispose to neuronal dysfunction in adulthood.

Keywords: intrauterine chronic hypoxia; mitochondrial dysfunction; neuron death; oxidative stress.


Conflict of interest statement

The authors declare no conflicts of interest.

Figures

Figure 1
Figure 1
Antioxidant protein expression and activity in the neonatal brain. Protein expression by Westen blot and activity levels by ELISA kit of (A) SOD1, (B) SOD2, (C) SOD3, (D) total SOD activity, (E) CAT, (F) CAT activity, (G) GPX1-2, and (H) GPX total activity. (I) shows the blots with the molecular weight and ponceau corresponding to each membrane for each protein. Groups are neonates gestated in normoxia (Nx, n = 5, black bars, and circles) or hypobaric hypoxia (Hx, n = 5, blue bars, and circles). Data expressed as mean ± S.E.M. and compared using a Mann–Whitney t-test. Significant differences (p ≤ 0.05): * vs. Hx.
Figure 2
Figure 2
Pro-oxidants protein expression in the neonatal brain. Protein expression by Westen blot of (A) NOX2, (B) NOX4, (C) COX2, and OXPHOS: (D) Cytochrome I or NDUFB8 (NADH:ubiquinone oxidoreductase subunit B8), (E) Cytochrome II or SDHB (Succinate dehydrogenase cytochrome b), (F) Cytochrome III or UQCRC2 (ubiquinol-cytochrome c reductase core protein 2), (G) Cytochrome IV or MTCO1 (Mitochondrially Encoded Cytochrome C Oxidase I), and (H) Cytochrome V or ATP5A (ATP Synthase Subunit Alpha, Mitochondrial). (I) shows the blots with the molecular weight and ponceau corresponding to each membrane for each protein. Groups are neonates gestated in normoxia (Nx, n = 5, black bars, and circles) or hypobaric hypoxia (Hx, n = 5, blue bars, and circles). Data expressed as mean ± S.E.M. and compared using a Mann–Whitney t-test. Significant differences (p ≤ 0.05): * vs. Hx.
Figure 3
Figure 3
Oxidative stress markers in the neonatal cortex. (A) schematic representation of the experimental procedure, (B) Immunohistochemistry of 4HNE (4-Hydroxynonenal), and (C) NT (3-Nitrotyrosine) with representative micrographs (40×, panel below). Groups are neonates gestated in normoxia (Nx, n = 5, black bars and circles) or hypobaric hypoxia (Hx, n = 5, blue bars and circles). Bar in the micrographs = 100 μm. Reddish-brown color indicates positive staining and the arrows show cortical neurons. Data are expressed as mean ± S.E.M. and compared using a Mann–Whitney t-test. Significant differences (p ≤ 0.05): * vs. Hx.
Figure 4
Figure 4
Inflammation-related protein expression in the neonatal brain. Protein expression by Westen blot of (A) IL-1β (Interleukin 1β), (B) IL-8 (Interleukin 8), (C) IL-10 (Interleukin 10), (D) NF-κB (Nuclear factor kappa-light-chain-enhancer of activated B cells), (E) TNFα (tumor necrosis factor-alpha), and (F) iNOS (Inducible nitric oxide synthase). (G) shows the blots with the molecular weight and ponceau corresponding to each membrane for each protein. Groups are neonates gestated in normoxia (Nx, n = 5, black bars, and circles) or hypobaric hypoxia (Hx, n = 5, blue bars and circles). Data are expressed as mean ± S.E.M. and compared using a Mann–Whitney t-test. Significant differences (p ≤ 0.05): * vs. Hx.
Figure 5
Figure 5
Apoptotic-related protein expression in the neonatal cortex. Protein expression by Westen blot of (A) BLC-2, (B) BAX, (C) Cleaved Casp-3 (cleaved-caspase 3), (D) representative image of the western blots with the molecular weight and ponceau corresponding to each membrane for each protein, (E) immunohistochemistry of Cleaved Casp-3 and (F) Cleaved Casp-3 with representative micrographs (40×, panel below). Groups are neonates gestated in normoxia (Nx, n = 5, black bars, and circles) or hypobaric hypoxia (Hx, n = 5, blue bars and circles). Bar in the micrographs = 100 μm. Reddish-brown color indicates positive staining, and the arrows show cortical neurons by immunohistochemistry. Data expressed as mean ± S.E.M. and compared using a Mann–Whitney t-test. Significant differences (p ≤ 0.05): * vs. Hx.
Figure 6
Figure 6
Apoptosis in the neonatal cortex. (A) schematic representation of the experimental TUNEL fluorometric assay used to determine neuron apoptosis, (B) quantification of TUNEL-positive neurons in the prefrontal cortex with representative micrographs (40×, panel below), (C) schematic representation of the experimental toloudin assay in neurons of the prefrontal cortex, (D) neuron cell density in the prefrontal cortex by toloudin staining, and (E) correlation between neuronal TUNEL staining and neuron density in the prefrontal cortex. Groups are neonates gestated in normoxia (Nx, n = 5, black bars, and circles) or hypobaric hypoxia (Hx, n = 5, blue bars and circles). Bar in the micrographs = 100 μm. Data expressed as mean ± S.E.M. and compared using a Mann–Whitney t-test. Significant differences (p ≤ 0.05): * vs. Hx.

Similar articles

References

    1. Gluckman P.D., Cutfield W., Hofman P., Hanson M.A. The Fetal, Neonatal, and Infant Environments-the Long-Term Consequences for Disease Risk. Early Hum. Dev. 2005;81:51–59. doi: 10.1016/j.earlhumdev.2004.10.003. - DOI - PubMed
    1. Fowden A.L., Giussani D.A., Forhead A.J. Intrauterine Programming of Physiological Systems: Causes and Consequences. Physiology. 2006;21:29–37. doi: 10.1152/physiol.00050.2005. - DOI - PubMed
    1. Fajersztajn L., Veras M.M. Hypoxia: From Placental Development to Fetal Programming. Birth Defects Res. 2017;109:1377–1385. doi: 10.1002/bdr2.1142. - DOI - PubMed
    1. Sun C., Groom K.M., Oyston C., Chamley L.W., Clark A.R., James J.L. The Placenta in Fetal Growth Restriction: What Is Going Wrong? Placenta. 2020;96:10–18. doi: 10.1016/j.placenta.2020.05.003. - DOI - PubMed
    1. Giussani D.A. The Fetal Brain Sparing Response to Hypoxia: Physiological Mechanisms. J. Physiol. 2016;594:1215. doi: 10.1113/JP271099. - DOI - PMC - PubMed

Grants and funding

LinkOut - more resources