

Neuroelectric Correlates of Perceptual Awareness During the Auditory Attentional Blink
- PMID: 40563709
- PMCID: PMC12190337
- DOI: 10.3390/brainsci15060537
Neuroelectric Correlates of Perceptual Awareness During the Auditory Attentional Blink
Abstract
Background: Perceptual awareness refers to the conscious detection and identification of a sensory event. In electrophysiological studies, it is associated with a modality-specific negative-going event-related potential, which can be observed as early as 100-300 ms after the stimulus onset.
Method: In this study, we measured neuroelectric brain activity during the auditory attentional blink, comparing brain responses when participants correctly reported both the first (T1) and second (T2) targets versus when only T1 was detected, but T2 was missed. To achieve robust statistical power, we pooled data across six previously published studies for the current analyses.
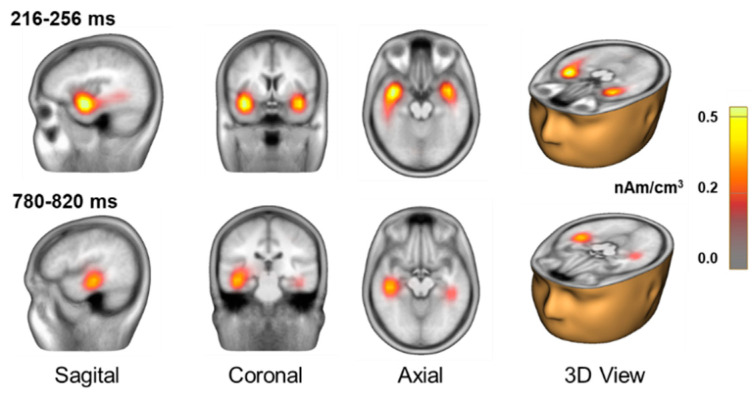
Result: Our results revealed that accurately reporting both T1 and T2 elicited greater negativity between 150 and 300 ms over the frontocentral and central scalp areas following T2 onset, compared to trials where T1 was detected but T2 was not. Additionally, a positive displacement, peaking around 800 ms over the central-parietal scalp area, followed the early negativity. Successful detection of both T1 and T2 was also associated with more pronounced alpha suppression, peaking at approximately 500 ms before and 800 ms after T2 onset.
Conclusions: These findings suggest that neural correlates of what we refer to "auditory awareness" occur both before the stimulus sequence and soon after T2 onset. Pre-stimulus difference in alpha power may serve as an indicator of lapses in attention, with greater alpha power reflecting periods when participants are less engaged or off-task.
Keywords: EEG; ERP; attentional blink; auditory; awareness-related negativity.
Conflict of interest statement
The authors declare no competing interests.
Figures


Similar articles
-
Intravenous magnesium sulphate and sotalol for prevention of atrial fibrillation after coronary artery bypass surgery: a systematic review and economic evaluation.Health Technol Assess. 2008 Jun;12(28):iii-iv, ix-95. doi: 10.3310/hta12280. Health Technol Assess. 2008. PMID: 18547499
-
Systemic pharmacological treatments for chronic plaque psoriasis: a network meta-analysis.Cochrane Database Syst Rev. 2017 Dec 22;12(12):CD011535. doi: 10.1002/14651858.CD011535.pub2. Cochrane Database Syst Rev. 2017. Update in: Cochrane Database Syst Rev. 2020 Jan 9;1:CD011535. doi: 10.1002/14651858.CD011535.pub3. PMID: 29271481 Free PMC article. Updated.
-
Interventions targeted at women to encourage the uptake of cervical screening.Cochrane Database Syst Rev. 2021 Sep 6;9(9):CD002834. doi: 10.1002/14651858.CD002834.pub3. Cochrane Database Syst Rev. 2021. PMID: 34694000 Free PMC article.
-
Maternal and neonatal outcomes of elective induction of labor.Evid Rep Technol Assess (Full Rep). 2009 Mar;(176):1-257. Evid Rep Technol Assess (Full Rep). 2009. PMID: 19408970 Free PMC article.
-
Systemic pharmacological treatments for chronic plaque psoriasis: a network meta-analysis.Cochrane Database Syst Rev. 2021 Apr 19;4(4):CD011535. doi: 10.1002/14651858.CD011535.pub4. Cochrane Database Syst Rev. 2021. Update in: Cochrane Database Syst Rev. 2022 May 23;5:CD011535. doi: 10.1002/14651858.CD011535.pub5. PMID: 33871055 Free PMC article. Updated.
References
Grants and funding
LinkOut - more resources
Full Text Sources
