. 2025 May 22;15(6):538.
doi: 10.3390/brainsci15060538.

Gut Microbiota and Neurovascular Patterns in Amnestic Mild Cognitive Impairment

Affiliations

Gut Microbiota and Neurovascular Patterns in Amnestic Mild Cognitive Impairment

Alexis B Kazen et al. Brain Sci. .

Abstract

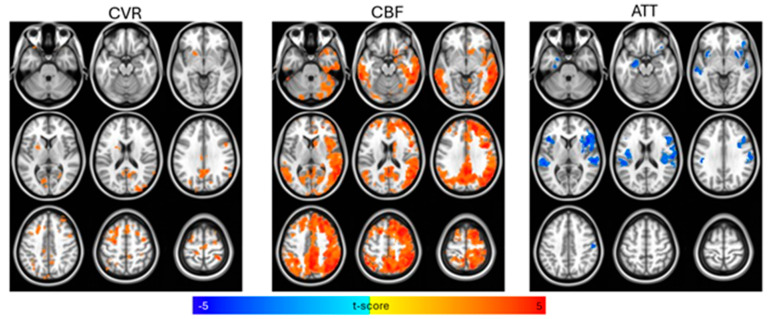
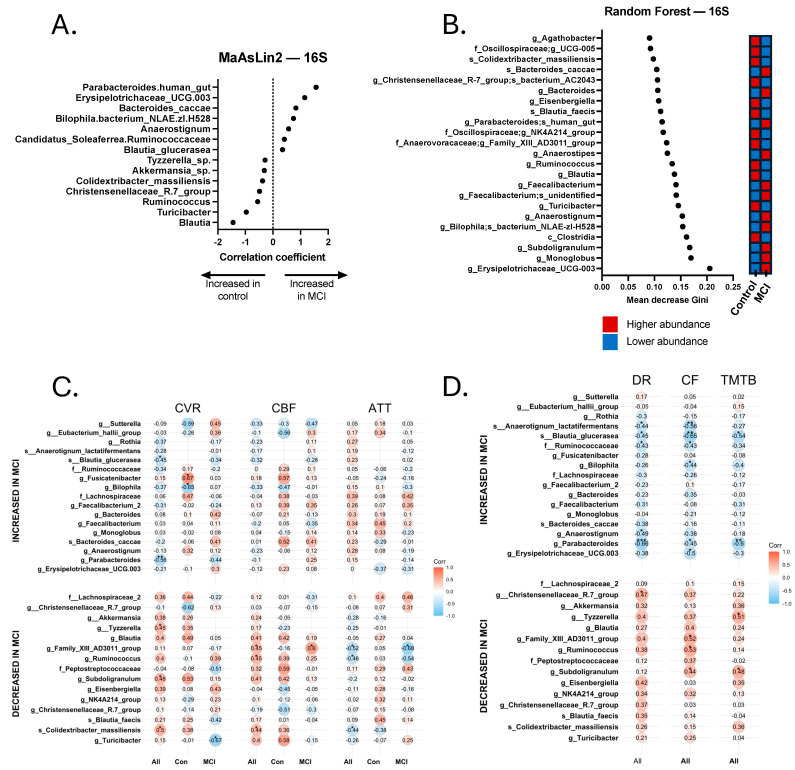
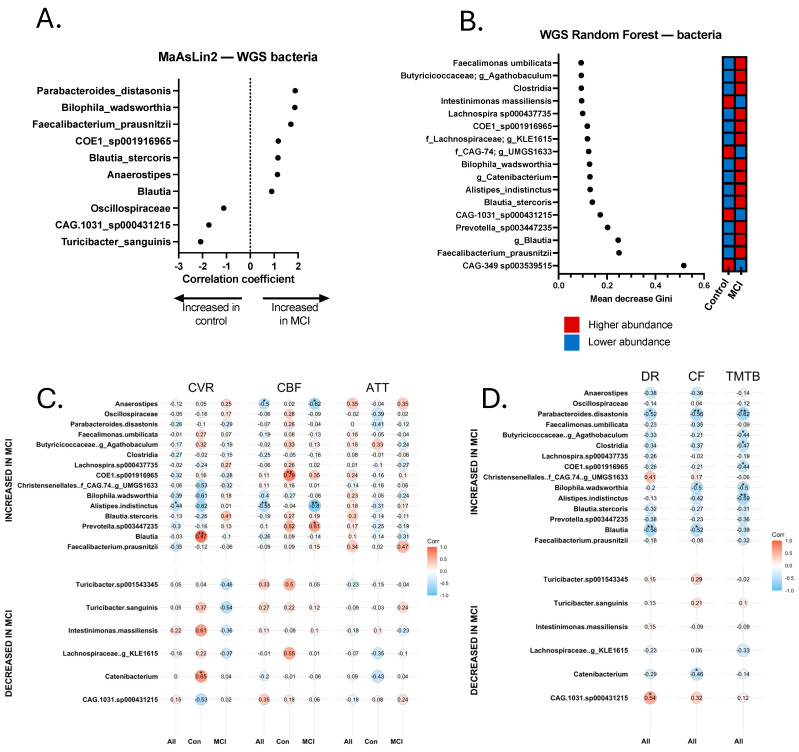
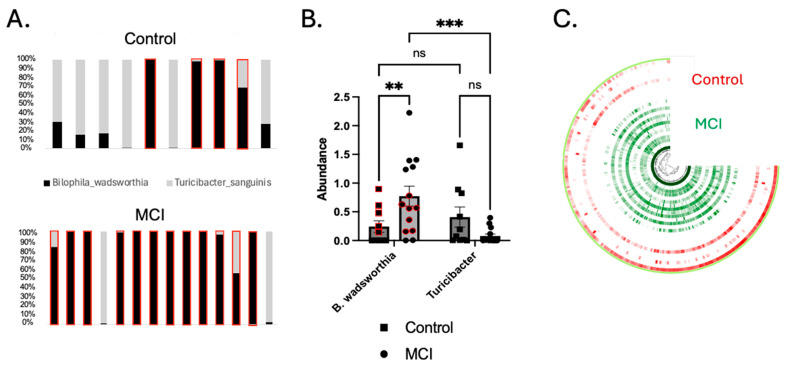
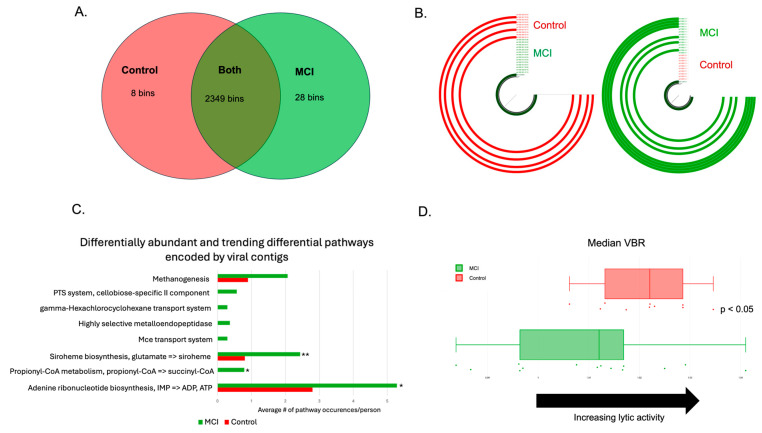
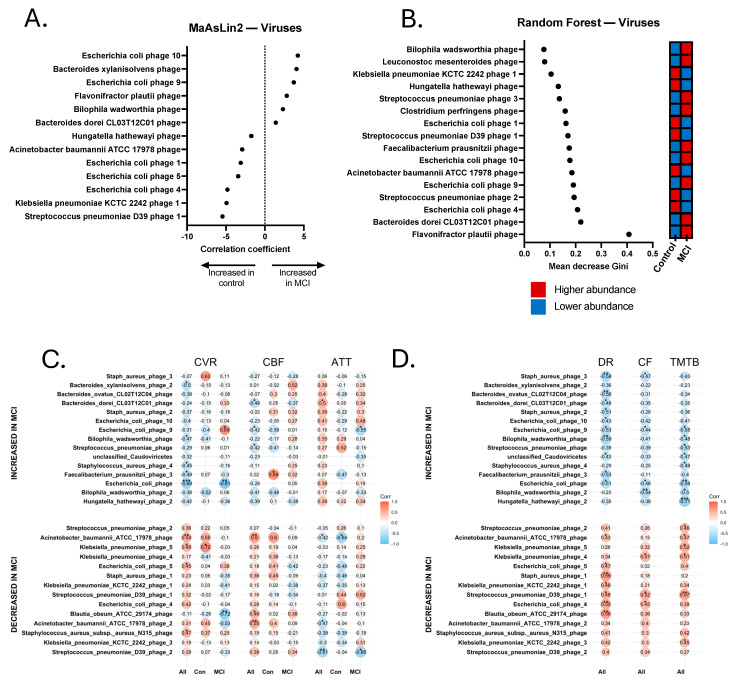
Background/Objectives: The interplay between the gut microbiome (GMB) and neurovascular function in neurodegeneration is unclear. The goal of this proof-of-concept, cross-sectional study is to identify relationships between the GMB, neurovascular functioning, and cognition in amnestic mild cognitive impairment (aMCI), the prototypical prodromal symptomatic stage of Alzheimer's disease (AD). Methods: Participants (n = 14 aMCI and 10 controls) provided fecal samples for GMB sequencing (16S and shotgun metagenomics), underwent MRI, and completed cognitive testing. Cerebral vascular reactivity (CVR), cerebral blood flow (CBF), and arterial transit time (ATT) were assessed. Statistical analyses evaluated the relationships between discriminatory taxa, cerebrovascular metrics, and cognition. Results: Sequencing revealed differentially abundant bacterial and viral taxa distinguishing aMCI from controls. Spearman correlations revealed that bacteria known to induce inflammation were negatively associated with CVR, CBF, and cognition, and positively associated with ATT. A reciprocal pattern emerged for the association of taxa with gut health. Conclusions: Our results provide preliminary evidence that pro-inflammatory gut bacterial and viral taxa are associated with neurovascular dysfunction and cognitive impairment in prodromal AD, highlighting their potential as candidate microbial biomarkers and targets for early intervention.

Keywords: Alzheimer’s disease; blood–brain barrier; dementia; microbiome; neurodegeneration; neurovascular dysfunction; shotgun metagenomics; virome.


Conflict of interest statement

The authors declare no conflicts of interest.

Figures

Figure 1
Figure 1
Voxelwise t-test comparisons between control and amnestic Mild Cognitive Impairment (aMCI) groups for cerebral vascular reactivity (CVR), cerebral blood flow (CBF), and arterial transit time (ATT), controlling for age, biological sex, and gray matter density, with statistical significance set at p < 0.01 (cluster-size correction at α < 0.05). CBF and CVR were higher and ATT was lower for the control group compared to the aMCI group.
Figure 2
Figure 2
Discriminatory taxa from the 16S Random Forest and MaAsLin2 analyses and correlations with neurovascular and cognitive data. (A) Discriminatory taxa identified via MaAsLin2 using a p-value cutoff of 0.05. (B) Discriminatory taxa identified via Random Forest using a Gini score cutoff of 0.09. Discriminatory taxa identified by Random Forest and MaAsLin2 underwent Spearman’s Rho correlational analysis to identify taxa that were significantly correlated with neurovascular metrics, including cerebrovascular reactivity (CVR), cerebral blood flow (CBF), and arterial transit time (ATT). Correlations were calculated separately for all 24 participants (All), 14 aMCI participants (MCI), and 10 controls (Con). Discriminatory taxa also underwent Spearman’s Rho correlational analysis for cognitive analyses, including delayed recall (DR), category fluency (CF), and Trail-Making Test B (TMTB). Correlations for cognitive tests were calculated for the total sample (All). (C) Spearman correlations for cerebrovascular analyses. (D) Spearman correlations for cognitive tests. * p < 0.05, ** p < 0.01, *** p < 0.001.
Figure 3
Figure 3
Discriminatory bacteria from metagenomics sequencing Random Forest and MaAsLin2 analyses and correlations with neurovascular and cognitive data. (A) Discriminatory taxa identified via MaAsLin2 using a p-value cutoff of 0.05. (B) Discriminatory taxa identified via Random Forest using a Gini score cutoff of 0.09. Discriminatory taxa underwent Spearman Rho correlational analysis to identify taxa that were significantly correlated with neurovascular metrics, including cerebrovascular reactivity (CVR), cerebral blood flow (CBF), and arterial transit time (ATT). Correlations were calculated separately for all 24 participants (All), 14 aMCI participants (MCI), and 10 controls (Con). Discriminatory taxa also underwent Spearman’s Rho correlational analysis for cognitive analyses, including delayed recall (DR), category fluency (CF), and Trail-Making Test B (TMTB). Correlations for cognitive tests were calculated for the total sample (All). (C) Spearman correlations for cerebrovascular analyses. (D) Spearman correlations for cognitive tests. * p < 0.05, ** p < 0.01.
Figure 4
Figure 4
Turicibacter was depleted and Bilophila wadsworthia was enriched in the aMCI group. (A) The ratio of Turicibacter to B. wadsworthia for individual participants. Each bar plot represents a single participant. Red boxes indicate participants whose concentration of Bilophila was greater than that of Turicibacter. (B) B. wadsworthia was significantly enriched in the aMCI group compared to controls (p < 0.01), and the ratio of Bilophila to Turicibacter was significantly higher in the aMCI group (p < 0.001) than in controls (p > 0.05). Turicibacter was enriched in controls, though not significantly so (p = 0.093 via the 2-way ANOVA shown above, and p = 0.057 via the Mann–Whitney U test comparing only the control vs. the aMCI group). Red circles and squares represent a subset of samples that underwent LEfSe analysis due to similar abundance levels (p > 0.9999). (C) An anvi’o plot showing the nucleotide variability in the B. wadsworthia MAG. The color intensity represents the number of single-nucleotide variants (SNVs) per kb pair. Each ¾ circle represents a single participant (red = control, green = aMCI). ** p < 0.01, *** p < 0.001.
Figure 5
Figure 5
aMCI phageomes were distinct from those of controls. (A) Viral bins identified with the control group, the aMCI group, or both after use of a min3 filter. The vast majority of the viral contigs identified were bacteriophages. (B) Examples of phage bins identified in (A). The bin on the right was only found in the aMCI group (n = 7/14, represented by the green ¾ circles), and the bin on the left was only found in the controls (n = 4/10, represented by the red ¾ circles). (C) Differential metabolic pathways encoded by phage contigs in the aMCI group vs. the control group. Statistically significant comparisons are denoted by the following: p < 0.05: *; p < 0.01: **. (D) Assessment of phage lifestyle using the viral-to-bacterial ratio (VBR). Values to the right indicate an increase in lytic activity, while values to the left indicate lysogeny. Controls (red dots and boxplot) are more likely to have a more lytic VBR, whereas aMCI participants (green dots and boxplot) have a more lysogenic gut virome (p < 0.05).
Figure 6
Figure 6
Discriminatory viruses from metagenomics sequencing Random Forest and MaAsLin2 analyses and correlations with neurovascular and cognitive data. (A) Discriminatory viral contigs identified via MaAsLin2 using a p-value cutoff of 0.05. (B) Discriminatory viral contigs identified via Random Forest using a Gini score cutoff of 0.09. Discriminatory viral contigs underwent Spearman Rho correlational analysis to identify contigs that were significantly correlated with neurovascular metrics, including cerebrovascular reactivity (CVR), cerebral blood flow (CBF), and arterial transit time (ATT). Correlations were calculated separately for all 24 participants (All), 14 aMCI participants (MCI), and 10 controls (Con). Discriminatory viral contigs also underwent Spearman’s Rho correlational analysis for cognitive tests, including delayed recall (DR), category fluency (CF), and Trail-Making Test B (TMTB). Correlations for cognitive tests were calculated for the total sample (All). (C) Spearman correlations for cerebrovascular analyses. (D) Spearman correlations for cognitive tests. * p < 0.05, ** p < 0.01, *** p < 0.001.

Similar articles

References

    1. Petersen R.C. Mild Cognitive Impairment. Continuum. 2016;22:404–418. doi: 10.1212/CON.0000000000000313. - DOI - PMC - PubMed
    1. Jack C.R., Jr., Andrews J.S., Beach T.G., Buracchio T., Dunn B., Graf A., Hansson O., Ho C., Jagust W., McDade E., et al. Revised criteria for diagnosis and staging of Alzheimer’s disease: Alzheimer’s Association Workgroup. Alzheimers Dement. 2024;20:5143–5169. doi: 10.1002/alz.13859. - DOI - PMC - PubMed
    1. Jack C.R., Jr., Bennett D.A., Blennow K., Carrillo M.C., Dunn B., Haeberlein S.B., Holtzman D.M., Jagust W., Jessen F., Karlawish J., et al. NIA-AA Research Framework: Toward a biological definition of Alzheimer’s disease. Alzheimers Dement. 2018;14:535–562. doi: 10.1016/j.jalz.2018.02.018. - DOI - PMC - PubMed
    1. Vogt N.M., Kerby R.L., Dill-McFarland K.A., Harding S.J., Merluzzi A.P., Johnson S.C., Carlsson C.M., Asthana S., Zetterberg H., Blennow K., et al. Gut microbiome alterations in Alzheimer’s disease. Sci. Rep. 2017;7:13537. doi: 10.1038/s41598-017-13601-y. - DOI - PMC - PubMed
    1. Ferreiro A.L., Choi J., Ryou J., Newcomer E.P., Thompson R., Bollinger R.M., Hall-Moore C., Ndao I.M., Sax L., Benzinger T.L.S., et al. Gut microbiome composition may be an indicator of preclinical Alzheimer’s disease. Sci. Transl. Med. 2023;15:eabo2984. doi: 10.1126/scitranslmed.abo2984. - DOI - PMC - PubMed

LinkOut - more resources