. 2025 Jun 8;15(6):619.
doi: 10.3390/brainsci15060619.

Movement Impairments May Not Preclude Visuomotor Adaptation After Stroke

Affiliations

Movement Impairments May Not Preclude Visuomotor Adaptation After Stroke

Robert Taylor Moore et al. Brain Sci. .

Abstract

Purpose: Many individuals with stroke partake in rehabilitation to improve their movements. Rehabilitation operates on the assumption that individuals with stroke can use visual feedback from their movements or visual cues from a therapist to improve their movements through practice. However, this type of visuomotor learning can be impaired after stroke. It is unclear whether and how learning impairments relate to impairments in movement. Here, we examined the relationship between learning and movement impairments after stroke.

Methods: We recruited adults with first-time unilateral stroke and controls matched for overall age and sex. The participants performed a visuomotor learning task in a Kinarm exoskeleton robot. The task assessed how they adapted their reaching movements to a systematic visual disturbance that altered the relationship between the observed and actual motion of their hand. Learning was quantified as the extent to which the participants adapted their movements to the visual disturbance. A separate visually-guided reaching task was used to assess the straightness, direction, smoothness, and duration of their movements. The relationships between visuomotor adaptation and movement were analyzed using Spearman's correlations. Control data were used to identify impairments in visuomotor adaptation and movement. The independence of these impairments was examined using Fisher's exact tests.

Results: Impairments in visuomotor adaptation (46.3%) and movement (73.2%) were common in participants with stroke (n = 41). We observed weak-moderate correlations between continuous measures of adaptation and movement performance (rho range: -0.44-0.58). Adaptation and movement impairments, identified using the range of performance in the control participants, were statistically independent (all p > 0.05).

Conclusions: Movement impairments accounted for 34% of the variance in visuomotor adaptation at best. Our findings suggest that factors other than movement impairments may influence visuomotor adaptation after stroke.

Keywords: motor adaptation; motor learning; movement impairment; robotics; stroke recovery; stroke rehabilitation; upper limb.


Conflict of interest statement

The author(s) declare no potential conflicts of interest with respect to the research, authorship, and/or publication of this article.

Figures

Figure 1
Figure 1
General task design and lesion characteristics. (A) Participants performed reaching movements from a start position to a single target while adapting to a visuomotor rotation (VMR). Initial arm configuration at the start position was the same as the VGR task described below. (B) Participants began the VMR task with 25 reaching trials with a small cursor displayed over the position of their occluded fingertip (veridical feedback). In the adaptation phase, we applied a 30° counter-clockwise rotation of the feedback cursor relative to the center or the start position. This meant that, as participants reached straight, the cursor travelled 30° leftward. Participants adapted their reaching direction to the rotation over 125 trials. Finally, participants performed 25 reaches with veridical feedback to washout the effects of adaptation. (C) Participants also performed a center-out, visually-guided reaching (VGR) task. Eight targets were spaced radially 10 cm from a central start position. The central start position was located in front of the participant so that their initial arm configuration was 30° of shoulder flexion and 90° of elbow flexion relative to the upper arm. (D) Lesion overlap maps of all participants with stroke (neurological display convention; n = 40). MNI coordinates are labeled and displayed below each slice. The color bar indicates the number of participants with damage in each voxel (brighter colors indicate regions in which more participants had stroke-related damage).
Figure 2
Figure 2
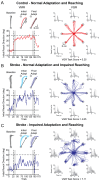
Exemplar hand paths in the VMR and VGR tasks with adaptation curves for a representative control (red), a participant with stroke who had reaching impairments (blue), and a participant with stroke who had impaired adaptation and reaching movements (blue). (A) Left: the average hand paths during Baseline, Initial Adaptation, and Final Adaptation (shaded regions = SD) are shown for the VMR task. Left: adaptation curve describing the trial-by-trial change in initial reach direction throughout the VMR task is shown for the control. Shaded regions represent the trials in which Initial and Final Adaptation were calculated. Right: hand paths and hand speed profiles are shown for a control who performed well on the VGR task. (B) Exemplar participant with stroke who displayed normal adaptation and impaired reaching. (C) Exemplar participant with stroke who displayed impaired adaptation and reaching. Data in (B,C) are presented in the same format as (A).
Figure 3
Figure 3
Adaptation curves and proportion of participants that were impaired on each parameter in the VMR task. (A) Averaged adaptation curves for controls (red) and participants with stroke (blue). Adaptation data were smoothed using a moving average filter (window length = 5; overlap = 4). Line represents the mean, and shaded region is the SE. Gray regions indicate when Initial Adaptation and Final Adaptation were averaged. (B) Mean (horizontal bar), SE (vertical bar), and individual data for Initial Adaptation, Final Adaptation, and Trials to Adapt. Bootstrap hypothesis tests were performed to test for differences in measures of adaptation. (C) The proportion of participants that were impaired on each parameter of adaptation. Chi-square tests were performed to test for differences in proportions. * indicates p < 0.05. ** indicates p < 0.01. *** indicates p < 0.001.
Figure 4
Figure 4
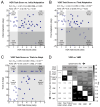
Scatterplots of VGR Task Score and (A) Initial Adaptation, (B) Final Adaptation, and (C) Trials to Adapt for participants with stroke. Scatterplots have been divided into 4 quadrants: participants with normal reaching and adaptation (open diamond), participants with impaired adaptation (solid diamond), participants with impaired reaching (solid circle), and participants with impaired reaching and adaptation (open circle). Spearman’s correlations indicate the strength of ranked associations. Fisher’s exact tests assessed for categorical relationships between impairments. (D) Spearman’s correlations and Fisher’s exact tests of independence for individual measures derived from the VGR and VMR tasks. Upper right: Spearman’s rho values are presented, and darker boxes indicate stronger correlations. Bold white numbers indicate significant correlations between variables (p < 0.05 after Bonferroni–Holm corrections—21 correlations). Bottom left: Odds ratios from the Fisher’s exact tests of independence are presented, and black boxes with bold white numbers indicate significant categorical associations between variables (p < 0.05 after Bonferroni–Holm corrections—21 tests). * indicates p < 0.05. ** indicates p < 0.01. *** indicates p < 0.001.
Figure 5
Figure 5
Scatterplots of Fugl–Meyer Assessment (FMA) scores and (A) Initial Adaptation, (B) Final Adaptation, and (C) Trials to Adapt for participants with stroke. Each panel is divided into 4 quadrants: participants with normal FMA scores (FMA = 66) and adaptation (open diamond), participants with impaired adaptation (solid diamond), participants with impairments on the FMA (FMA < 66; solid circle), and participants with impairments on the FMA and adaptation (open circle). Scatterplots of Chedoke–McMaster Stroke Assessment (CMSA) scores and (D) Initial Adaptation, (E) Final Adaptation, and (F) Trials to Adapt are also presented for participants with stroke. Data in (D), (E), and (F) are presented in the same manner as (A), (B), and (C), respectively. Spearman’s correlations indicate the strength of ranked associations. Fisher’s exact tests were included to test for categorical relationships. * indicates p < 0.05.

Similar articles

References

    1. Reinkensmeyer D.J., Burdet E., Casadio M., Krakauer J.W., Kwakkel G., Lang C.E., Swinnen S.P., Ward N.S., Schweighofer N. Computational Neurorehabilitation: Modeling Plasticity and Learning to Predict Recovery. J. Neuroeng. Rehabil. 2016;13:42. doi: 10.1186/s12984-016-0148-3. - DOI - PMC - PubMed
    1. Krakauer J.W. Motor Learning: Its Relevance to Stroke Recovery and Neurorehabilitation. Curr. Opin. Neurol. 2006;19:84–90. doi: 10.1097/01.wco.0000200544.29915.cc. - DOI - PubMed
    1. Leech K.A., Roemmich R.T., Gordon J., Reisman D.S., Cherry-Allen K.M. Updates in Motor Learning: Implications for Physical Therapist Practice and Education. Phys. Ther. 2021;102:pzab250. doi: 10.1093/ptj/pzab250. - DOI - PMC - PubMed
    1. Krakauer J.W., Hadjiosif A.M., Xu J., Wong A.L., Haith A.M. Motor Learning. Compr. Physiol. 2019;9:613–663. doi: 10.1002/j.2040-4603.2019.tb00069.x. - DOI - PubMed
    1. Takahashi C.D., Reinkensmeyer D.J. Hemiparetic Stroke Impairs Anticipatory Control of Arm Movement. Exp. Brain Res. 2003;149:131–140. doi: 10.1007/s00221-002-1340-1. - DOI - PubMed

LinkOut - more resources