

Resilience of Neural Networks Underlying the Stroop Effect in the Aftermath of Severe COVID-19: fMRI Pilot Study
- PMID: 40563804
- PMCID: PMC12191155
- DOI: 10.3390/brainsci15060635
Resilience of Neural Networks Underlying the Stroop Effect in the Aftermath of Severe COVID-19: fMRI Pilot Study
Abstract
Background: Alterations in resting-state functional connectivity and in activation patterns elicited during cognitive tasks were reported in acute to chronic stages of mild, moderate and critical SARS-CoV-2 infection, suggesting the dysregulation of specialised neural networks. In this pilot study, we report on activation patterns elicited by the colour-word Stroop task in patients who suffered from severe COVID-19 requiring Intensive Care Unit hospitalisation but who had no prior or COVID-19-related brain damage.
Methods: Neural activity elicited during a 16 min long colour-word Stroop task was investigated with 3T fMRI 9 months after severe SARS-CoV-2 infection in six patients and in twenty-four control subjects.
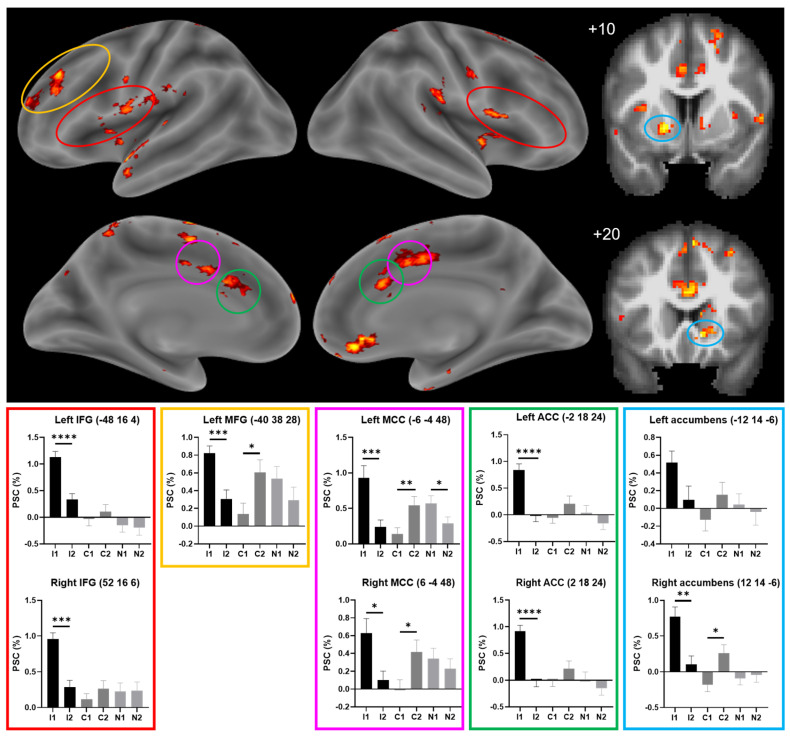
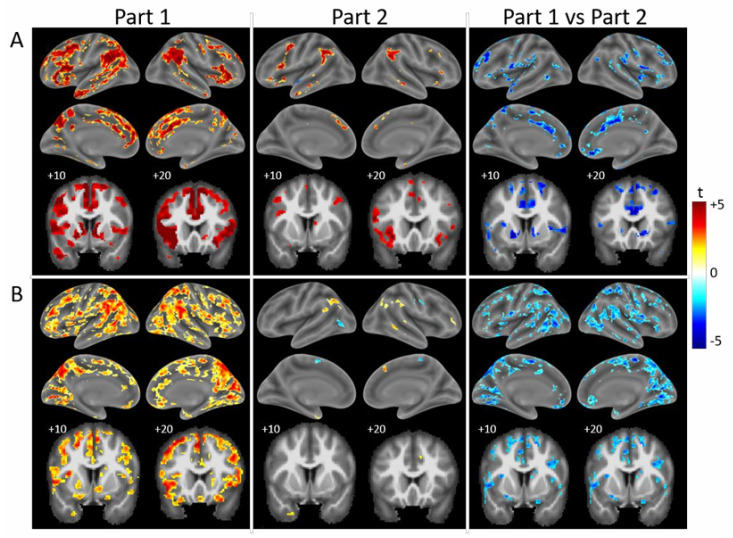
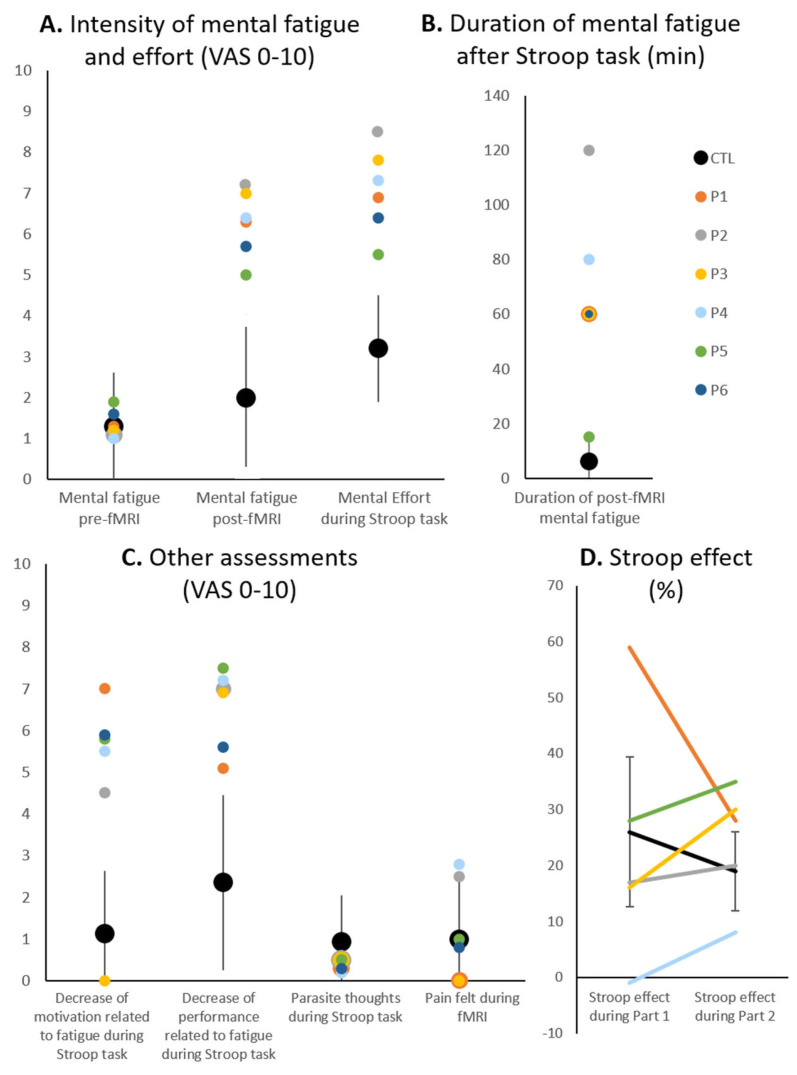
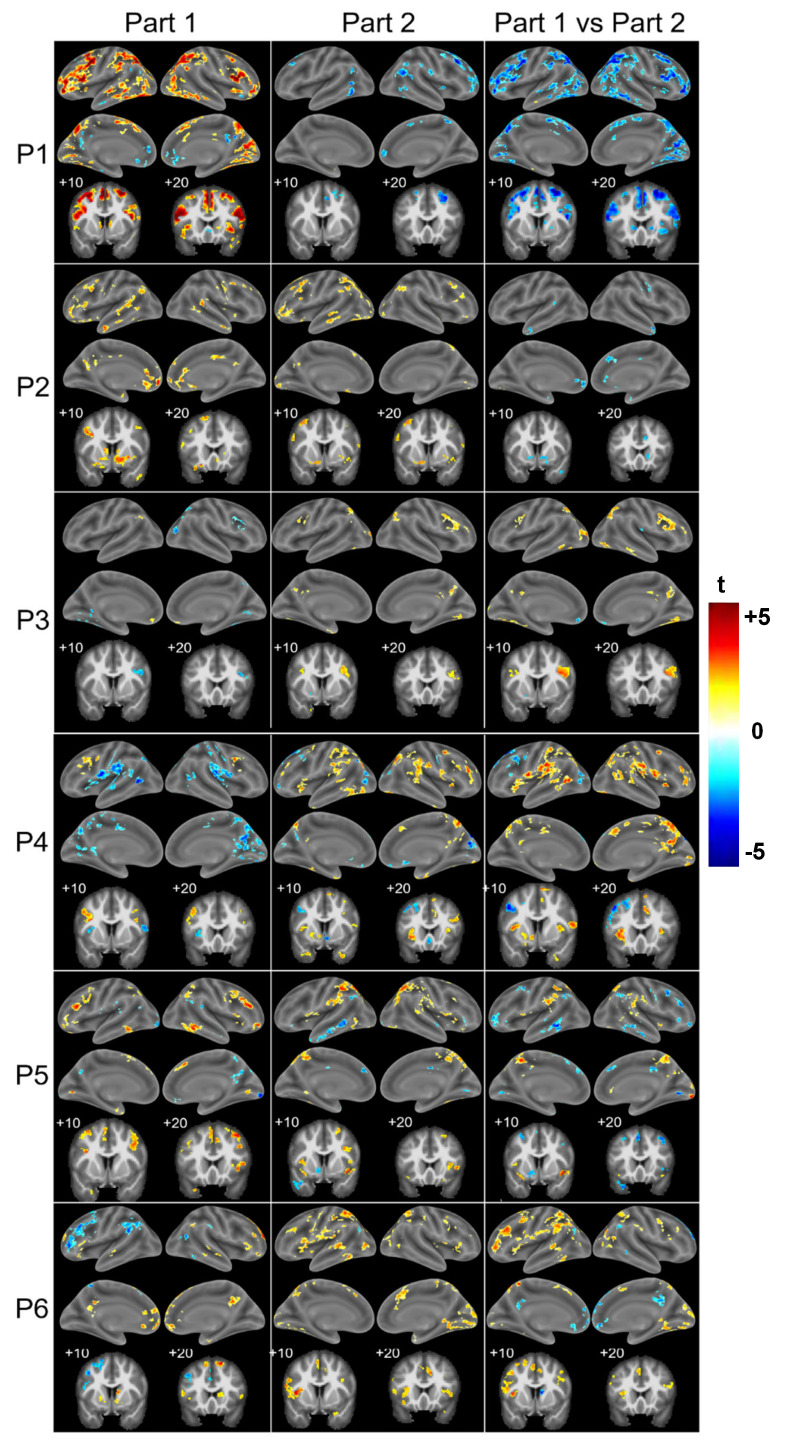
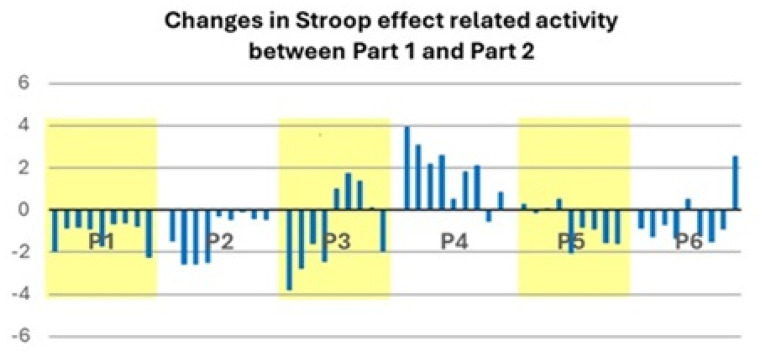
Results: Patients' performance in the Stroop task was within normal limits, with the exception of one (out of six) response time in one patient and one (out of six) accuracy measure in another patient. Activation elicited by the Stroop effect, i.e., the contrasting Incongruent vs. Congruent condition, differed between the first and second parts of the task. In controls, the Stroop effect yielded an increase in activity in prefrontal, cingulate and parieto-temporal clusters as well as in the nucleus accumbens during the first part, and the activity receded during the second part in most regions. Two distinct response profiles were found among patients: (i) a Stroop effect-linked increase during the first part followed by a partial decrease during the second part, as in healthy subjects; and (ii) a weak or absent Stroop effect increase during the first part followed by a partial increase during the second part.
Conclusions: The normal performance presented by patients on the Stroop task was associated with two distinct activation patterns. They may represent different resilience profiles of the corresponding neural networks and be indicative of propensity for further recovery and/or susceptibility to therapeutic interventions.
Keywords: Stroop task; brain plasticity; fMRI; fatigue; severe COVID-19.
Conflict of interest statement
The authors declare no competing financial and non-financial interests.
Figures

Similar articles
-
Signs and symptoms to determine if a patient presenting in primary care or hospital outpatient settings has COVID-19.Cochrane Database Syst Rev. 2022 May 20;5(5):CD013665. doi: 10.1002/14651858.CD013665.pub3. Cochrane Database Syst Rev. 2022. PMID: 35593186 Free PMC article.
-
Measures implemented in the school setting to contain the COVID-19 pandemic.Cochrane Database Syst Rev. 2022 Jan 17;1(1):CD015029. doi: 10.1002/14651858.CD015029. Cochrane Database Syst Rev. 2022. Update in: Cochrane Database Syst Rev. 2024 May 2;5:CD015029. doi: 10.1002/14651858.CD015029.pub2. PMID: 35037252 Free PMC article. Updated.
-
Antibody tests for identification of current and past infection with SARS-CoV-2.Cochrane Database Syst Rev. 2022 Nov 17;11(11):CD013652. doi: 10.1002/14651858.CD013652.pub2. Cochrane Database Syst Rev. 2022. PMID: 36394900 Free PMC article.
-
SARS-CoV-2-neutralising monoclonal antibodies to prevent COVID-19.Cochrane Database Syst Rev. 2022 Jun 17;6(6):CD014945. doi: 10.1002/14651858.CD014945.pub2. Cochrane Database Syst Rev. 2022. PMID: 35713300 Free PMC article.
-
Drugs for preventing postoperative nausea and vomiting in adults after general anaesthesia: a network meta-analysis.Cochrane Database Syst Rev. 2020 Oct 19;10(10):CD012859. doi: 10.1002/14651858.CD012859.pub2. Cochrane Database Syst Rev. 2020. PMID: 33075160 Free PMC article.
References
-
- Beaud V., Crottaz-Herbette S., Dunet V., Knebel J.-F., Bart P.-A., Clarke S. Outcome of Severe COVID-19: Spotlight on Fatigue, Fatigability, Multidomain Complaints and Pattern of Cognitive Deficits in a Case Series without Prior Brain Dysfunction and without COVID-19-Related Stroke and/or Cardiac Arrest. J. Med. Case Rep. 2024;18:64. doi: 10.1186/s13256-023-04300-6. - DOI - PMC - PubMed
-
- Ceban F., Ling S., Lui L.M.W., Lee Y., Gill H., Teopiz K.M., Rodrigues N.B., Subramaniapillai M., Di Vincenzo J.D., Cao B., et al. Fatigue and Cognitive Impairment in Post-COVID-19 Syndrome: A Systematic Review and Meta-Analysis. Brain Behav. Immun. 2022;101:93–135. doi: 10.1016/j.bbi.2021.12.020. - DOI - PMC - PubMed
LinkOut - more resources
Full Text Sources
Miscellaneous
