. 2025 May 28;14(6):621.
doi: 10.3390/biology14060621.

Microbial Community Imbalance Drives Nitrous Oxide Emissions from Strongly Acidic Soil-Insights from a Laboratory Experiment with Microbial Inhibitors

Affiliations

Microbial Community Imbalance Drives Nitrous Oxide Emissions from Strongly Acidic Soil-Insights from a Laboratory Experiment with Microbial Inhibitors

Waqar Ahmed et al. Biology (Basel). .

Abstract

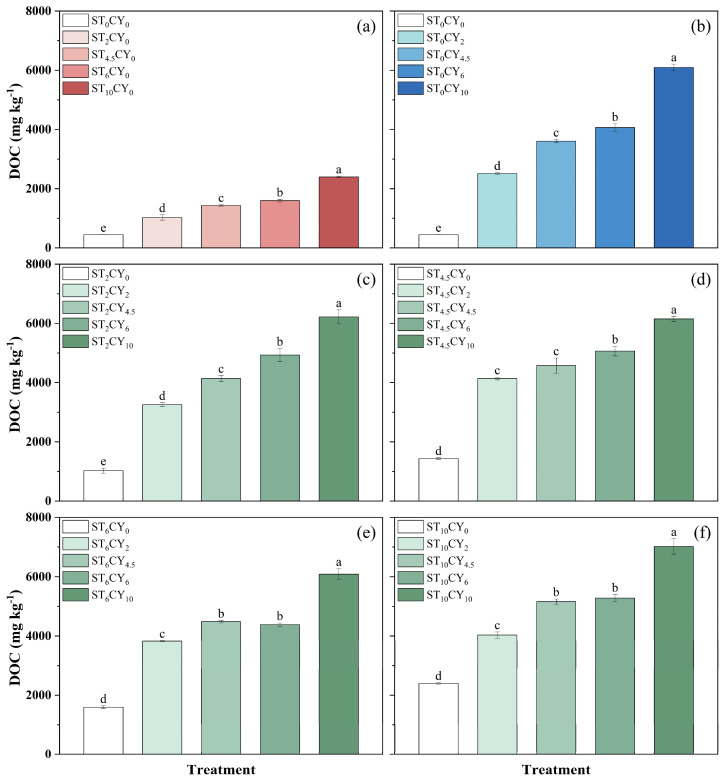
Nitrous oxide (N2O) is a potent greenhouse gas with intensive emissions from acidic soil. This study explored the impact of the disruption of the microbial balance from microbial inhibitors (streptomycin and cycloheximide) on soil's N2O emission and nitrogen (N) dynamics. Under all the conditions examined, biotic processes accounted for 96-98% of total N2O emissions. High concentrations of streptomycin (6 and 10 mg g-1) reduced N2O emissions from 2.24 μg kg-1 h-1 to 1.93 μg kg-1 h-1 and 2.12 μg kg-1 h-1, respectively, whereas lower concentrations (2 and 4.5 mg g-1) increased emissions from 2.24 μg kg-1 h-1 to 2.95 μg kg-1 h-1 and 3.27 μg kg-1 h-1, respectively. Lower cycloheximide (2 and 4.5 mg g-1) significantly enhanced N2O emissions, reaching 9.15 μg kg-1 h-1 and 5.68 μg kg-1 h-1, respectively, whereas higher dosages (6 mg g-1 and 10 mg g-1) inhibited N2O emissions, reducing them to 5.55 μg kg-1 h-1 and 4.84 μg kg-1 h-1, respectively. Carbon dioxide (CO2) emissions generally decreased with increasing inhibitor dosages but significantly increased at 2 mg g-1 and 4.5 mg g-1 streptomycin. The inhibitors also altered soil N and carbon (C) dynamics, increasing ammonium (NH4+-N), dissolved organic nitrogen (DON), and dissolved organic carbon (DOC) levels. Pearson correlation analysis indicated that N2O emission was negatively correlated with cycloheximide dosage (R = -0.68, p < 0.001), NH4+-N (R = -0.31, p < 0.001) and DOC content (R = -0.57, p < 0.05). These findings highlight the consequences of microbial disruption on N2O emission and the complex microbial interactions in acidic soils. High concentrations of microbial inhibitors effectively reduce N2O emissions by suppressing key microbial groups in nitrification and denitrification. Conversely, lower concentrations may prompt compensatory responses from surviving microorganisms, resulting in increased N2O production. Future research should focus on sustainable management strategies to mitigate N2O emissions while preserving the soil's microbial community.

Keywords: acidic soil; dissolved organic carbon; microbial inhibition; nitrogen dynamics; nitrous oxide.


Conflict of interest statement

The authors declare no conflicts of interest.

Figures

Figure 1
Figure 1
(a) Cumulative N2O emissions after 112 h of incubation in highly acidic soils under the application of different treatments, including treatments with the application of microbial inhibitors (1: Sterilized-CK, 2: Sterilized-NH4+-N, 3: Sterilized-NO3-N) and treatments without applying microbial inhibitors (1: Sterilized-CK, 2: Sterilized-NH4+-N, 3: Sterilized-NO3-N). (b) Effect of biotic and abiotic interaction on soil N2O emission in different treatments including: CK (control), NH4+-N (ammonium nitrogen), NO3-N (nitrate nitrogen).
Figure 2
Figure 2
The N2O flux after 4 and 8 h of incubation in highly acidic soils under the application of microbial inhibitors (streptomycin and cycloheximide) with different concentrations, including (0, 2, 4.5, 6, 10 mg g−1) applied alone and with different combinations of both microbial inhibitors. Cycloheximide concentration was maintained at 0 mg g−1 (a) with varying streptomycin concentrations, while streptomycin concentrations were maintained at 0 (b), 2 (c), 4.5 (d), 6 (e), and 10 (f) mg g−1 with varying cycloheximide concentrations. Error bars represent standard errors, with different lowercase letters indicating statistically significant differences among treatments (p < 0.05).
Figure 3
Figure 3
The CO2 flux after 4 and 8 h of incubation in highly acidic soils under the application of microbial inhibitors (streptomycin and cycloheximide) with different concentrations, including (0, 2, 4.5, 6, 10 mg g−1) applied alone and with different combinations of both microbial inhibitors. Cycloheximide concentration was maintained at 0 mg g−1 (a) with varying streptomycin concentrations, while streptomycin concentrations were maintained at 0 (b), 2 (c), 4.5 (d), 6 (e), and 10 (f) mg g−1 with varying cycloheximide concentrations. Error bars represent standard errors, with different lowercase letters indicating statistically significant differences among treatments (p < 0.05).
Figure 4
Figure 4
Influence on the concentration of dissolved organic nitrogen (DON) after incubation in highly acidic soils of the application of microbial inhibitors (streptomycin and cycloheximide) with different concentrations, including (0, 2, 4.5, 6, 10 mg g−1) applied alone and with different combinations of both microbial inhibitors. Cycloheximide concentration was maintained at 0 mg g−1 (a) with varying streptomycin concentrations, while streptomycin concentrations were maintained at 0 (b), 2 (c), 4.5 (d), 6 (e), and 10 (f) mg g−1 with varying cycloheximide concentrations. Error bars represent standard errors, with different lowercase letters indicating statistically significant differences among treatments (p < 0.05).
Figure 5
Figure 5
Influence on the concentration of dissolved organic carbon (DOC) after incubation in highly acidic soils of the application of microbial inhibitors (streptomycin and cycloheximide) with different concentrations, including (0, 2, 4.5, 6, 10 mg g−1) applied alone and with different combinations of both microbial inhibitors. Cycloheximide concentration was maintained at 0 mg g−1 (a) with varying streptomycin concentrations, while streptomycin concentrations were maintained at 0 (b), 2 (c), 4.5 (d), 6 (e), and 10 (f) mg g−1 with varying cycloheximide concentrations. Error bars represent standard errors, with different lowercase letters indicating statistically significant differences among treatments (p < 0.05).
Figure 6
Figure 6
Correlation heatmap of gaseous and soil properties with microbial inhibitor dosages. The size of each square is proportional to the absolute value of the correlation coefficient. ST: streptomycin dosage; CY: cycloheximide dosage; NNR: net nitrification rate; NMR: net mineralization rate. *, p < 0.05; **, p < 0.01; ***, p < 0.001.

References

    1. Rockström J., Gupta J., Qin D., Lade S.J., Abrams J.F., Andersen L.S., Armstrong McKay D.I., Bai X., Bala G., Bunn S.E., et al. Safe and just Earth system boundaries. Nature. 2023;619:102–111. doi: 10.1038/s41586-023-06083-8. - DOI - PMC - PubMed
    1. Palmer K., Biasi C., Horn M.A. Contrasting denitrifier communities relate to contrasting N2O emission patterns from acidic peat soils in arctic tundra. ISME J. 2012;6:1058–1077. doi: 10.1038/ismej.2011.172. - DOI - PMC - PubMed
    1. Ravishankara A.R., Daniel J.S., Portmann R.W. Nitrous oxide (N2O): The dominant ozone-depleting substance emitted in the 21st century. Science. 2009;326:123–125. doi: 10.1126/science.1176985. - DOI - PubMed
    1. Tian H., Xu R., Canadell J.G., Thompson R.L., Winiwarter W., Suntharalingam P., Davidson E.A., Ciais P., Jackson R.B., Janssens-Maenhout G., et al. A comprehensive quantification of global nitrous oxide sources and sinks. Nature. 2020;586:248–256. doi: 10.1038/s41586-020-2780-0. - DOI - PubMed
    1. Tokuda S., Hayatsu M. Nitrous oxide production from strongly acid tea field soils. Soil Sci. Plant Nutr. 2000;46:835–844. doi: 10.1080/00380768.2000.10409149. - DOI

LinkOut - more resources