. 2025 May 30;14(6):635.
doi: 10.3390/biology14060635.

DoDELLA-GAI2 Integrates Gibberellin and Ethylene Signaling to Regulate Chinese Yam (Dioscorea opposita) Tuber Development

Affiliations

DoDELLA-GAI2 Integrates Gibberellin and Ethylene Signaling to Regulate Chinese Yam (Dioscorea opposita) Tuber Development

Mingran Ge et al. Biology (Basel). .

Abstract

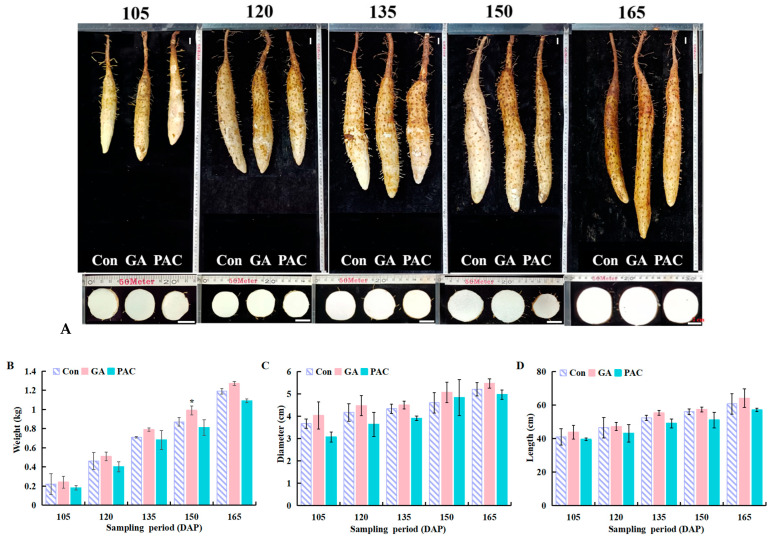
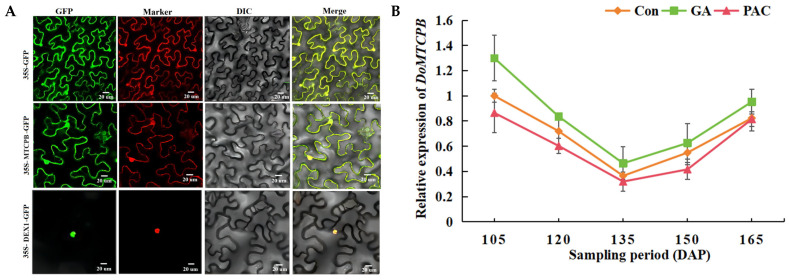
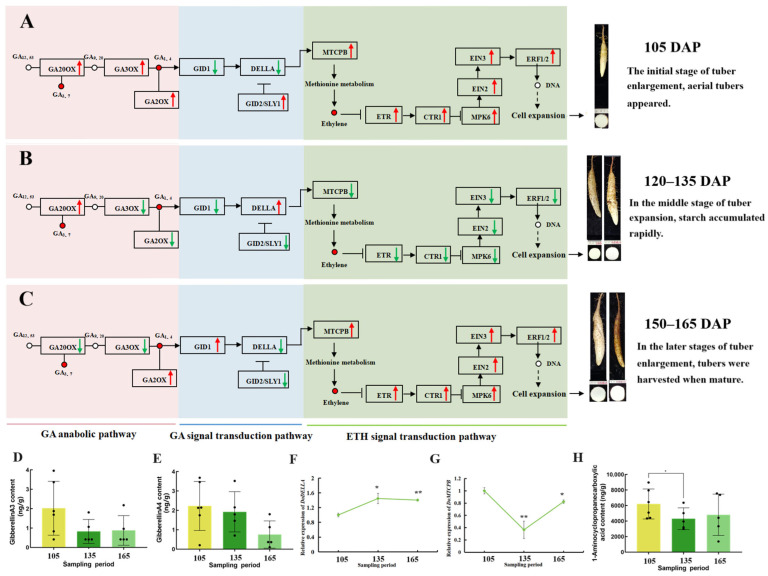
Yam (Dioscorea opposita) tuber development is a complex process regulated by various phytohormones, with gibberellin (GA) playing a crucial role. However, the underlying mechanisms and interaction of GA with other phytohormone pathways on yam tuber development remain incompletely understood. This study investigated the regulatory role of GA and its crosstalk with other phytohormones during yam tuber growth through phenotypic, cytological, physiological, and transcriptomic as well as targeted phytohormone metabolomics analyses. The results reveal that exogenous GA promoted tuber enlargement increases vascular bundle and the number and diameter of sieve tubes, and alters the expression of GA anabolism genes and GA signal transduction pathways. Integrated transcriptome and targeted metabolomics analyses revealed coordinated changes in GA and ethylene (ETH) biosynthesis and signaling pathways during tuber development, particularly DELLA-GAI2 acting as a negative regulator of GA signaling. Overexpression of DoDELLA-GAI2 in transgenic tobacco significantly reduced GA level, starch, cytokinin (CTK), and ETH content, as well as aerenchyma tissue growth and parenchyma cell size. Exogenous GA and ethephon treatments increased GA, starch, CTK, and ETH content, and downregulated DoDELLA-GAI2 gene expression. The yeast two-hybrid and bimolecular fluorescence complementation (BiFC) assays confirmed a direct interaction between DoDELLA-GAI2 and DoMTCPB, an upstream gene-encoding key enzyme in ETH biosynthesis. DoDELLA-GAI2 acts as a negative regulator of ETH synthesis by interacting with DoMTCPB. GA-induced degradation of DoDELLA-GAI2 relieves this inhibition, promoting ETH production and contributing to tuber growth. Taken together, our findings reveal a novel mechanism based on DoDELLA-GAI2 integrating the GA and ETH signaling processes to regulate tuber development in D. opposita, offering a potential target for improving yam crop productivity.

Keywords: DELLA-GAI; Dioscorea opposita; gibberellin; interaction mechanism; signaling cascade reaction.


Conflict of interest statement

The authors declare no conflicts of interest.

Figures

Figure 1
Figure 1
Exogenous GA treatment promotes tuber growth in yam. (A) Morphology of yam tubers at 105, 120, 135, 150, and 165 days after planting (DAP), treated with either water as a control (Con), 200 mg/L gibberellin (GA), or 200 mg/L paclobutrazol (PAC, GA biosynthesis inhibitor) (scale bars: 2 cm); (B) weight per plant; (C) tuber diameter; (D) tuber length; (E) starch content; (F) soluble starch synthase (SSS) enzyme activity; (G) gibberellin content; (H) cross-section of yam tubers at 105 DAP (scale bars: 100 μm), showing the basic tissue (GT), phellem layer (Pg), vascular bundle (VB), sieve tube (ST), vessel (VES), cork cambium (Cb), and phelloderm (Pd). Data in (BG) are presented as the means ± SD (n = 3). *: p < 0.05, **: p < 0.01 compared to control, according to one-way ANOVA followed by Student’s t-test.
Figure 1
Figure 1
Exogenous GA treatment promotes tuber growth in yam. (A) Morphology of yam tubers at 105, 120, 135, 150, and 165 days after planting (DAP), treated with either water as a control (Con), 200 mg/L gibberellin (GA), or 200 mg/L paclobutrazol (PAC, GA biosynthesis inhibitor) (scale bars: 2 cm); (B) weight per plant; (C) tuber diameter; (D) tuber length; (E) starch content; (F) soluble starch synthase (SSS) enzyme activity; (G) gibberellin content; (H) cross-section of yam tubers at 105 DAP (scale bars: 100 μm), showing the basic tissue (GT), phellem layer (Pg), vascular bundle (VB), sieve tube (ST), vessel (VES), cork cambium (Cb), and phelloderm (Pd). Data in (BG) are presented as the means ± SD (n = 3). *: p < 0.05, **: p < 0.01 compared to control, according to one-way ANOVA followed by Student’s t-test.
Figure 2
Figure 2
Effects of exogenous GA on key genes’ expression in GA anabolism and signal transduction pathways in tubers. Note: The heat maps (from left to right) represent gene expression levels in tubers at 105, 135, and 165 DAP, under Con (control), 200 mg/L GA (gibberellin), and 200 mg/L PAC (paclobutrazol) treatments (Con-105; Con-135; Con-165; GA-105; GA-135; GA-165; PAC-105; PAC-135; PAC-165). The colors (scale marked in the upper-right corner) indicate the log2 fold change in gene expression. GGDP: Geranylgeranyl diphosphate; CPS: Ent-copalyl diphosphate synthase; CPP: copalyl pyrophosphate; KS: Ent-kaurene synthase; KO: Ent-kaurene oxidase; KAO: Ent-kaurenoic acid oxidase; GA2ox: GA 2-oxidase; GA3ox: GA 3-oxidase; G20ox: GA 20-oxidase; GID: gibberellin-insensitive dwarf.
Figure 3
Figure 3
Targeted phytohormone metabonomics analysis of untreated yam during different developmental stages. (A) Principal component analysis (PCA) diagram (PC1, PC2: the first and second principal components; percentage of variance explained by each component). (B) Clustering heatmap of plant hormones. (C) Metabolite KEGG statistical diagram. (D) Correlation network of differentially expressed genes (DEGs) and differentially accumulated metabolites (DAMs) in plant hormone signaling pathways.
Figure 4
Figure 4
Dynamic changes in metabolites and genes in the plant hormone signal transduction pathway during yam tuber expansion. Note: The heatmap shows the metabolites and expression of genes at 105, 135, and 165 DAP (from left to right); the color change from orange to blue indicates gene expression from upregulation to downregulation; color change from green to purple indicates metabolites changing from higher relative abundance to lower relative abundance.
Figure 5
Figure 5
(A) Open reading frame (ORF) full-length PCR amplification of DoDELLA-GAI2 (M: DL2 000 DNA marker); for the original, uncropped, gel image, please refer to Supplementary Figure S2; (B) subcellular localization of DoDELLA-GAI2 fusion protein in tobacco leaves. Note: GFP: green fluorescent protein, marker: pBI221-NLS-CFP (nucleus) and pBI221-mCherry-PM (cytomembrane), DIC: Bright field, and Merge: Merged images (scale bars: 20 μm).
Figure 6
Figure 6
Analysis of the anatomical structure of overexpressed DoDELLA-GAI2 tobacco. Note: (A) plant growth and root phenotype (scale bar for plants: 5 cm; scale bar for roots: 1 cm); (B) cross-section of transgenic tobacco roots and stems (Aer: aerenchyma; Ste: stele; Pi: pith; Co: cortex; scale bars: 100 μm); (C) aerenchyma thickness; (D) center column diameter; (E) cortical parenchyma cell thickness; (F) parenchyma cell diameter. Data in (CF) are presented as a distribution plot, with each point representing an individual measurement. ***: p < 0.001, ****: p < 0.0001.
Figure 6
Figure 6
Analysis of the anatomical structure of overexpressed DoDELLA-GAI2 tobacco. Note: (A) plant growth and root phenotype (scale bar for plants: 5 cm; scale bar for roots: 1 cm); (B) cross-section of transgenic tobacco roots and stems (Aer: aerenchyma; Ste: stele; Pi: pith; Co: cortex; scale bars: 100 μm); (C) aerenchyma thickness; (D) center column diameter; (E) cortical parenchyma cell thickness; (F) parenchyma cell diameter. Data in (CF) are presented as a distribution plot, with each point representing an individual measurement. ***: p < 0.001, ****: p < 0.0001.
Figure 7
Figure 7
Changes in the physiology, biochemistry, and endogenous phytohormone content of DoDELLA-GAI2 overexpressing tobacco under gibberellin (GA) treatment. (A) Plant growth (scale bar: 5 cm); (B) transcript levels of DoDELLA-GAI2; (C) starch content; (D) GA content; (E) auxin (IAA) content; (F) cytokinin (CTK) content; (G) ethylene (ETH) content. Note: Data are presented as mean ± SD (n = 3). *: p < 0.05, **: p < 0.01, compared to WT, according to one-way ANOVA followed by Student’s t-test.
Figure 8
Figure 8
Changes in the physiology, biochemistry, and endogenous phytohormone content of DoDELLA-GAI2 overexpressing tobacco under ethephon treatment. (A) Plant growth (scale bar: 5 cm); (B) transcript levels of DoDELLA-GAI2; (C) starch content; (D) gibberellin (GA) content; (E) auxin (IAA) content; (F) cytokinin (CTK) content; (G) ETH content. Data are presented as mean ± SD (n = 3). *: p < 0.05, **: p < 0.01, compared to WT, according to one-way ANOVA followed by Student’s t-test.
Figure 9
Figure 9
Toxicity detection of the bait vector pGBKT7-DoDELLA-GAI2. Note: Yeast cells expressing the pGBKT7-DoDELLA-GAI2 bait vector with an empty pGADT7 vector, and the controls (positive: pGBKT7-p53 + pGADT7-T; negative: pGBKT7-laminC + pGADT7-T) were plated onto selective media. The numbers at the top indicate serial dilutions (1, 1/10, and 1/100). The positive control showed normal growth and a blue color on SD/-Trp/-Leu/-His/X-α-Gal media, whereas the bait vector showed no blue color and no growth on SD/-Trp/-Leu/-His/-Ade media, which indicates that the bait vector pGBKT7-DoDELLA-GAI2 does not possess transcriptional autoactivation activity.
Figure 10
Figure 10
Screening of DoDELLA-GAI2 interacting proteins. (A) Colonies screened on SD/-Leu/-Trp and SD/-Leu/-Trp/-His/X-a-gal plates. 1–23: Numbering of screened positive clones; +: positive control; −: negative control. (B) representative colony PCR results for 16 clones. M: DL5000 DNA marker; 1–16: 1–16 bacterial solution PCR. The ID numbers in (A,B) and Table 1 are correspondingly consistent. For the original uncropped gel image, please refer to Supplementary Figure S3.
Figure 11
Figure 11
Yeast two-hybrid point-to-point rotation verification and BiFC confirmed the interaction of DoDELLA-GAI2 with DoMTCPB and DoDEX1 in tobacco cells. (A) DoDELLA-GAI2 and DoMTCPB rotation verification. (B) DoDELLA-GAI2 and DoDEX1 rotation verification. (C) DoDELLA-GAI2 and DoMTCPB. DoDELLA-GAI2 and DoDEX1. Note: YFP: YFP fluorescence, Marker: pBI221-NLS-CFP (nucleus), DIC: Bright field, Merge: Merged images (scale bars: 50 µm).
Figure 12
Figure 12
Subcellular localization of the interacting proteins DoMTCPB and DoDEX1, and expression pattern analysis of DoMTCPB. (A) Subcellular localization of DoMTCPB and DoDEX1 fusion proteins in tobacco leaves. GFP: green fluorescent protein; 35S-GFP and 35S-MTCPB-GFP markers: pBI221-NLS-CFP (nucleus) and pBI221-mCherry-PM (cytomembrane), 35S-DEX1-GFP marker: pBI221-NLS-CFP (nucleus); DIC: bright field; Merge: merged images; scale bars: 20 µm. (B) Expression pattern analysis of DoMTCPB. Data are presented as mean ± SD (n = 3).
Figure 13
Figure 13
Regulatory mechanism of gibberellin (GA) and ethylene (ETH) signaling crosstalk during yam tuber development. (AC) The integration of two KEGG pathways: diterpenoid biosynthesis (Ko00904) and plant hormone signal transduction (Ko04075), at three developmental stages: 105 DAP (days after planting, early stage), 120–135 DAP (middle stage), and 150–165 DAP (late stage). Black boxes: genes; circles: signaling intermediates; red arrows: high expression; green arrows: low expression. In the ETH pathway, ethylene binding to its receptor (ETR) leads to the inactivation of CTR1 (a negative regulator). This releases EIN2 from inhibition, allowing EIN2 to promote the stability and activity of EIN3/EIL1 transcription factors, which in turn activate ERF gene expression. (D) Gibberellin A3 (GA3) content. (E) Gibberellin A4 (GA4) content. (F) Relative expression of DoDELLA-GAI2. (G) Relative expression of DoMTCPB. (H) 1-aminocyclopropanecarboxylic acid (ACC) content. Data are presented as mean ± SD (n = 3). *: p < 0.05, **: p < 0.01 compared to 105 DAP, according to one-way ANOVA followed by Student’s t-test.

Similar articles

References

    1. Epping J., Laibach N. An underutilized orphan tuber crop—Chinese yam: A review. Planta. 2020;252:58. doi: 10.1007/s00425-020-03458-3. - DOI - PMC - PubMed
    1. Khol M., Ma F., Lei L., Liu W., Liu X. A frontier review of nutraceutical chinese yam. Foods. 2024;13:1426. doi: 10.3390/foods13101426. - DOI - PMC - PubMed
    1. Wu Z.-G., Jiang W., Nitin M., Bao X.-Q., Chen S.-L., Tao Z.-M. Characterizing diversity based on nutritional and bioactive compositions of yam germplasm (Dioscorea spp.) commonly cultivated in china. J. Food Drug Anal. 2016;24:367–375. doi: 10.1016/j.jfda.2015.12.003. - DOI - PMC - PubMed
    1. Li Y., Ji S., Xu T., Zhong Y., Xu M., Liu Y., Li M., Fan B., Wang F., Xiao J., et al. Chinese yam (Dioscorea): Nutritional value, beneficial effects, and food and pharmaceutical applications. Trends Food Sci. Technol. 2023;134:29–40. doi: 10.1016/j.tifs.2023.01.021. - DOI
    1. Datir S., Kumbhar R., Kumatkar P. Understanding physiological and biochemical mechanisms associated with post-harvest storage of yam tuber (Dioscorea sp.) Technol. Hortic. 2024;4:e004. doi: 10.48130/tihort-0024-0001. - DOI

LinkOut - more resources