

Analysis of Software Read Cross-Contamination in DNBSEQ Data
- PMID: 40563921
- PMCID: PMC12189395
- DOI: 10.3390/biology14060670
Analysis of Software Read Cross-Contamination in DNBSEQ Data
Abstract
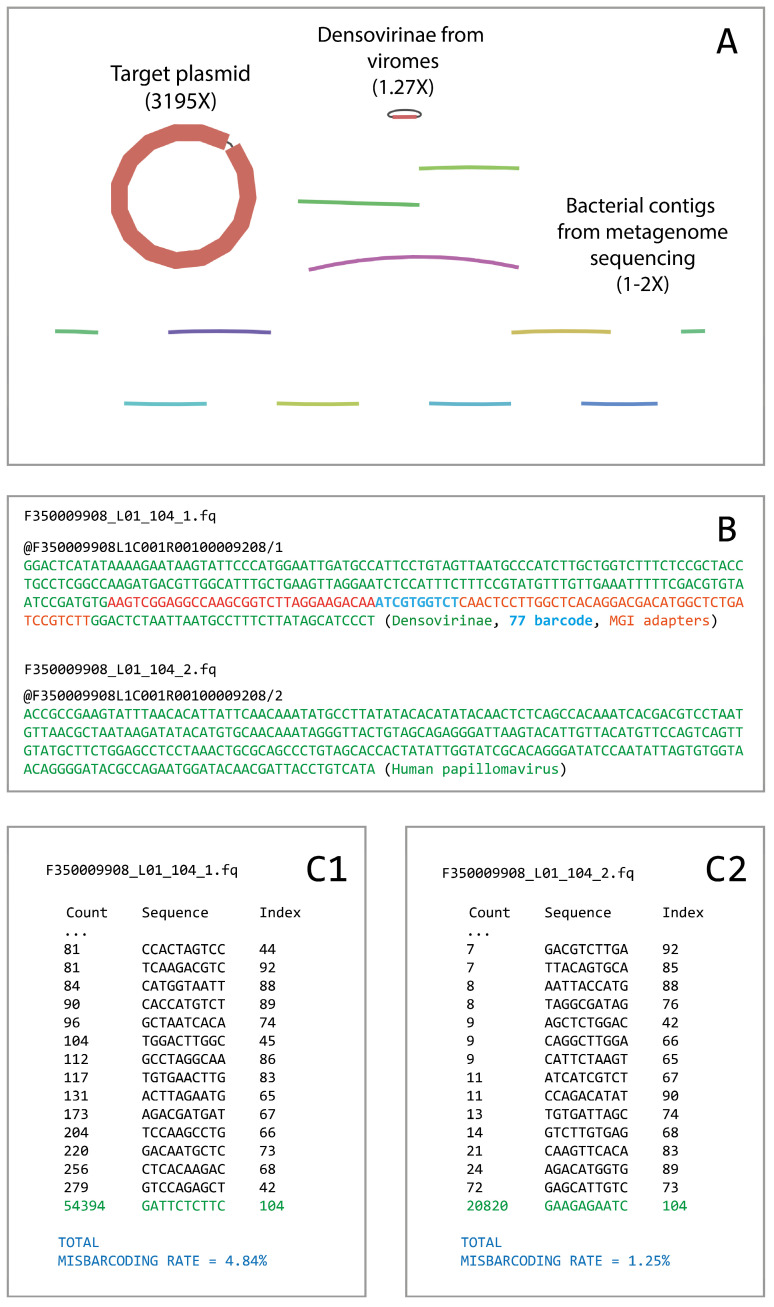
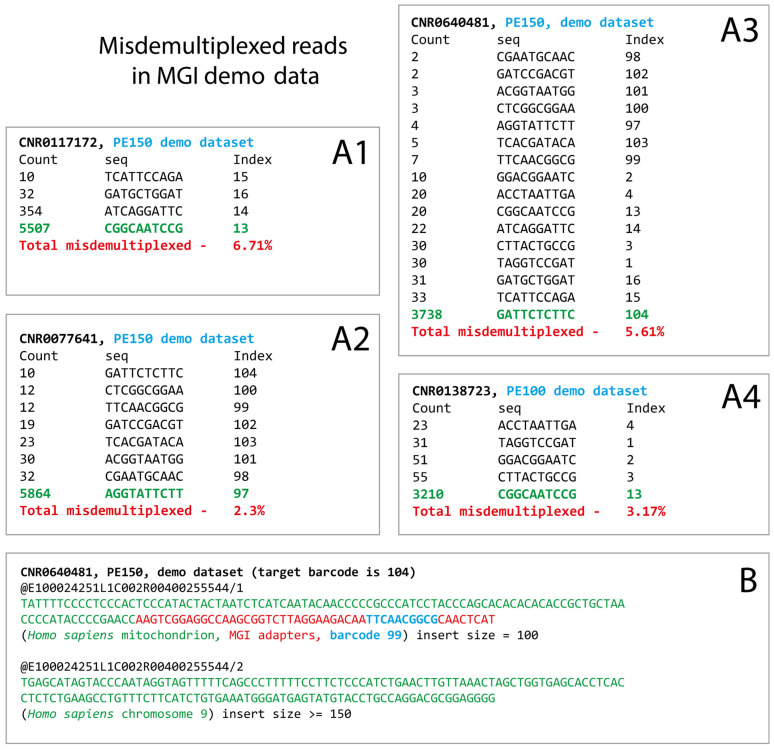
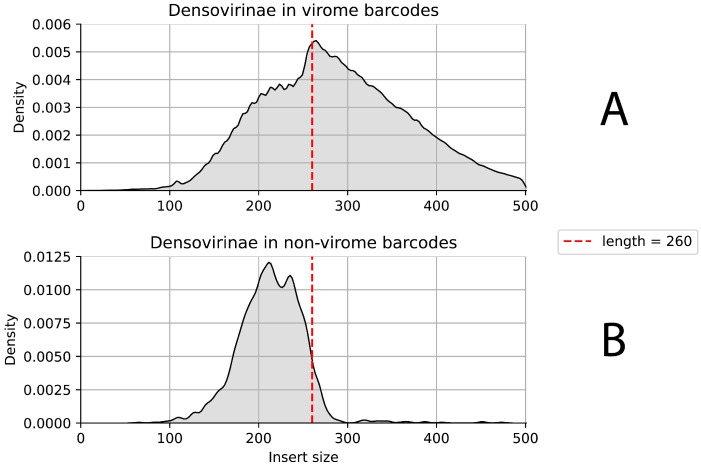
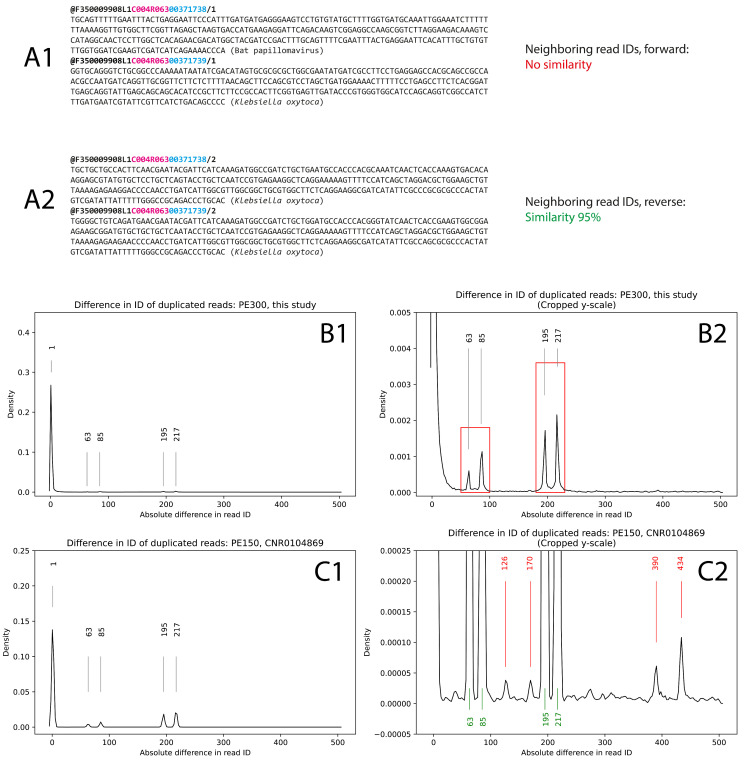
DNA nanoball sequencing (DNBSEQ) is one of the most rapidly developing sequencing technologies and is widely applied in genomic and transcriptomic investigations. Recently, a new PE300 sequencing option primarily recommended for amplicon analysis was released for DNBSEQ-G99 and G400 devices. Given their unprecedentedly high data yield per flow cell, the new PE300 kits could be a great choice for various sequencing tasks, but we found that combining different types of DNA libraries in a single run could lead to undesired artifacts in the data. In this study, we investigate the occasional read cross-contamination that we first observed in our DNBSEQ PE300 run. The phenomenon, which we refer to as "software contamination", is not actual contamination but primarily manifests as improper forward/reverse read pairing, improper demultiplexing, or as "digital chimeric" reads. Although rare, these artifacts were found in all runs we have analyzed, including several MGI demo datasets (both PE100 and PE150). In this study, we demonstrate that these artifacts arise primarily from the incorrect resolution of sequencing signals produced by neighboring DNA nanoballs, leading to mixing out forward and reverse reads or improper demultiplexing. The artifacts occur most frequently with read pairs where the length of insert sequence is shorter than the read length. Based on a few external NA12878 human exome sequencing data, we conclude that the total improper pairing rate in DNBSEQ data is comparable to Illumina ones. Overall, the problem only affects the analysis results when simultaneously sequenced libraries have markedly different insert size distribution or flow cell loading. Additionally, we demonstrate here that raw DNBSEQ data might contain ~2% optical duplicates, resulting from the same effect of close neighboring of DNB-sites in the flow cell.
Keywords: DNBSEQ; data filtering; read duplicates; sequencing artifacts.
Conflict of interest statement
The authors declare no conflicts of interest.
Figures
Similar articles
-
Systemic pharmacological treatments for chronic plaque psoriasis: a network meta-analysis.Cochrane Database Syst Rev. 2021 Apr 19;4(4):CD011535. doi: 10.1002/14651858.CD011535.pub4. Cochrane Database Syst Rev. 2021. Update in: Cochrane Database Syst Rev. 2022 May 23;5:CD011535. doi: 10.1002/14651858.CD011535.pub5. PMID: 33871055 Free PMC article. Updated.
-
Antidepressants for pain management in adults with chronic pain: a network meta-analysis.Health Technol Assess. 2024 Oct;28(62):1-155. doi: 10.3310/MKRT2948. Health Technol Assess. 2024. PMID: 39367772 Free PMC article.
-
Systemic pharmacological treatments for chronic plaque psoriasis: a network meta-analysis.Cochrane Database Syst Rev. 2017 Dec 22;12(12):CD011535. doi: 10.1002/14651858.CD011535.pub2. Cochrane Database Syst Rev. 2017. Update in: Cochrane Database Syst Rev. 2020 Jan 9;1:CD011535. doi: 10.1002/14651858.CD011535.pub3. PMID: 29271481 Free PMC article. Updated.
-
Diagnostic test accuracy and cost-effectiveness of tests for codeletion of chromosomal arms 1p and 19q in people with glioma.Cochrane Database Syst Rev. 2022 Mar 2;3(3):CD013387. doi: 10.1002/14651858.CD013387.pub2. Cochrane Database Syst Rev. 2022. PMID: 35233774 Free PMC article.
-
Signs and symptoms to determine if a patient presenting in primary care or hospital outpatient settings has COVID-19.Cochrane Database Syst Rev. 2022 May 20;5(5):CD013665. doi: 10.1002/14651858.CD013665.pub3. Cochrane Database Syst Rev. 2022. PMID: 35593186 Free PMC article.
References
-
- Póliska S., Fareh C., Lengyel A., Göczi L., Tőzsér J., Szatmari I. Comparative transcriptomic analysis of Illumina and MGI next-generation sequencing platforms using RUNX3-and ZBTB46-instructed embryonic stem cells. Front. Genet. 2024;14:1275383. doi: 10.3389/fgene.2023.1275383. - DOI - PMC - PubMed
Grants and funding
LinkOut - more resources
Full Text Sources
