. 2025 Jun 10;14(6):672.
doi: 10.3390/biology14060672.

Research on Plant RNA-Binding Protein Prediction Method Based on Improved Ensemble Learning

Affiliations

Research on Plant RNA-Binding Protein Prediction Method Based on Improved Ensemble Learning

Hongwei Zhang et al. Biology (Basel). .

Abstract

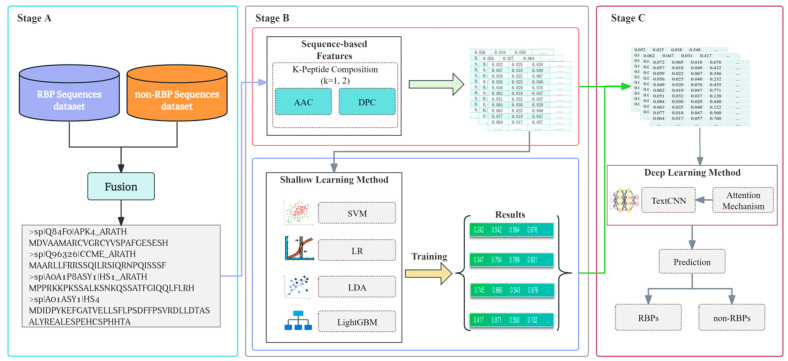
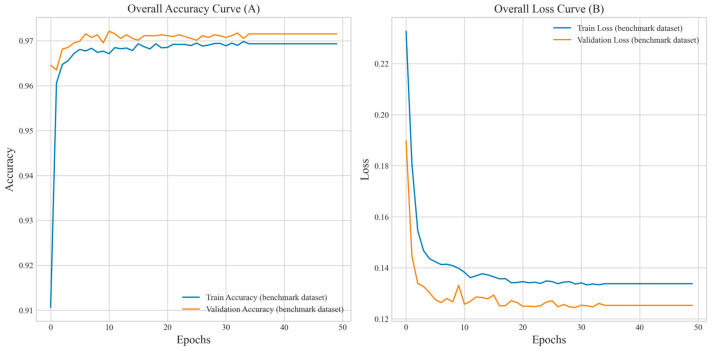
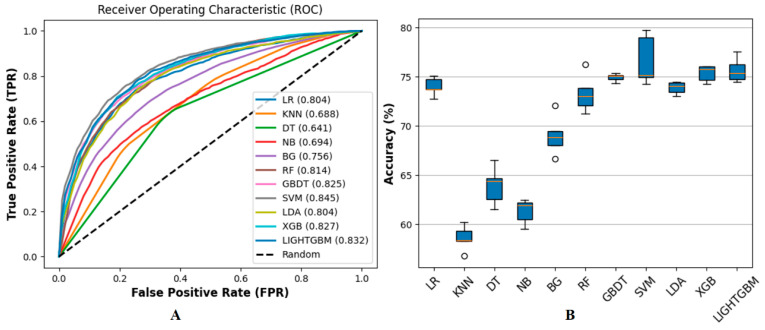
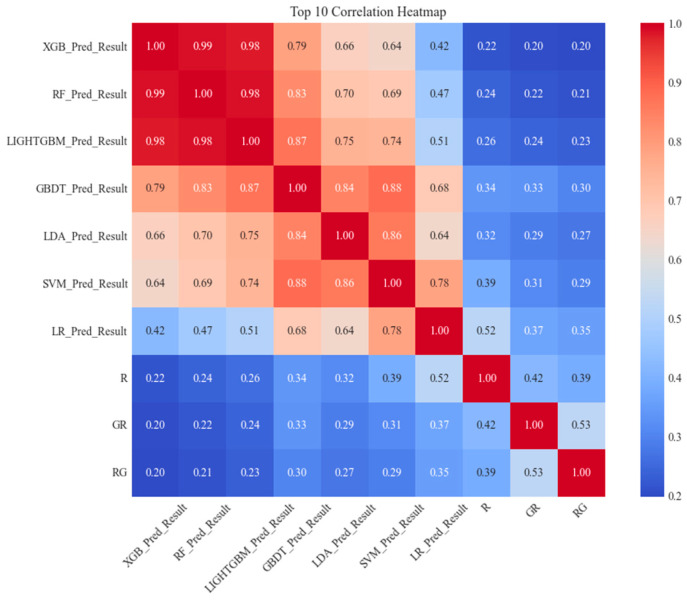
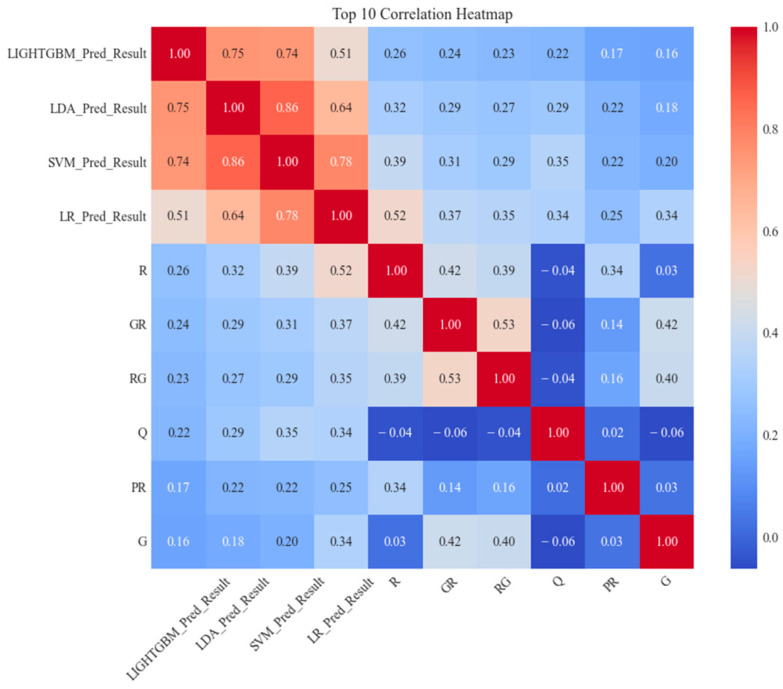
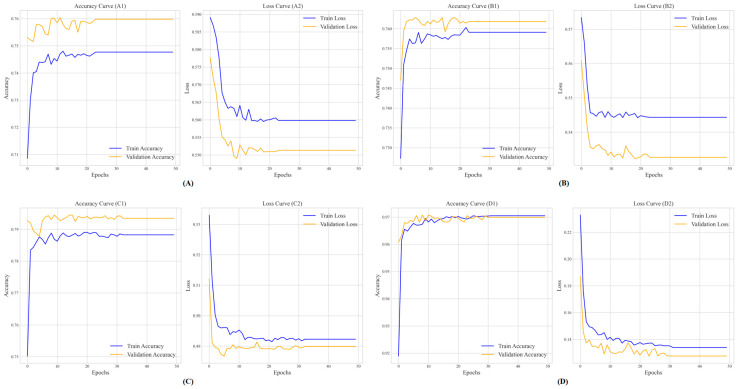
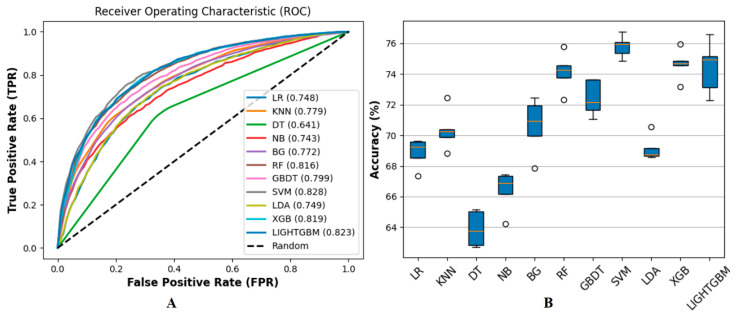
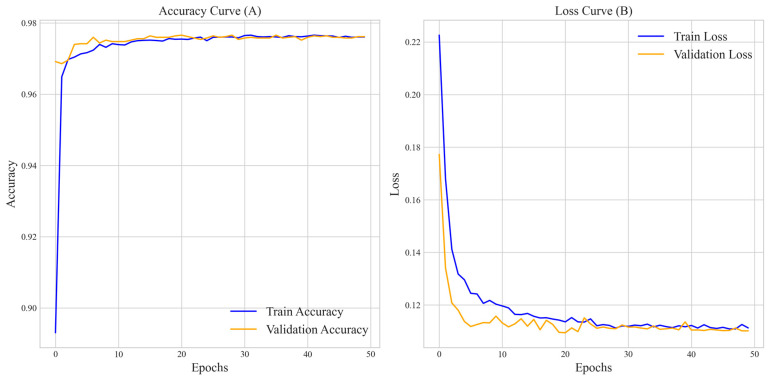
(1) RNA-binding proteins (RBPs) play a crucial role in regulating gene expression in plants, affecting growth, development, and stress responses. Accurate prediction of plant-specific RBPs is vital for understanding gene regulation and enhancing genetic improvement. (2) Methods: We propose an ensemble learning method that integrates shallow and deep learning. It integrates prediction results from SVM, LR, LDA, and LightGBM into an enhanced TextCNN, using K-Peptide Composition (KPC) encoding (k = 1, 2) to form a 420-dimensional feature vector, extended to 424 dimensions by including those four prediction outputs. Redundancy is minimized using a Pearson correlation threshold of 0.80. (3) Results: On the benchmark dataset of 4992 sequences, our method achieved an ACC of 97.20% and 97.06% under 5-fold and 10-fold cross-validation, respectively. On an independent dataset of 1086 sequences, our method attained an ACC of 99.72%, an F1score of 99.72%, an MCC of 99.45%, an SN of 99.63%, and an SP of 99.82%, outperforming RBPLight by 12.98 percentage points in ACC and the original TextCNN by 25.23 percentage points. (4) Conclusions: These results highlight our method's superior accuracy and efficiency over PSSM-based approaches, enabling large-scale plant RBP prediction.

Keywords: RBPs; RNA-binding proteins; TextCNN; ensemble learning; plant.


Conflict of interest statement

The authors declare no conflicts of interest.

Figures

Figure 1
Figure 1
Shows the overall structure of the prediction framework of this study. First, RBPs and non-RBP sequence data are collected in (Stage A), and then the protein sequence is first encoded in (Stage B). This study introduces the protein sequence-based AAC, TPC, and DPC methods for sequence encoding. After encoding, machine learning methods, such as SVM, LR, LDA, and LightGBM, are applied for training and prediction. Finally, in (Stage C), the encoded protein sequence and the predicted results of the four machine learning methods are fused; then, a deep learning method (TextCNN) is used for higher-dimensional feature abstraction, and finally, classification prediction is performed to classify RBPs from non-RBPs.
Figure 2
Figure 2
Shows the overall accuracy curve and loss curve for training, with the horizontal axis representing training epochs and the vertical axis indicating accuracy and loss, respectively. (A) demonstrates that the average accuracy of the training and validation sets rapidly increases in the initial stage, exceeding 0.97 after about 10 epochs, and then stabilizes with slight fluctuations, indicating that the method is approaching convergence on the benchmark dataset. (B) shows that the average loss values for both the training and validation sets rapidly decrease in the initial stage, stabilizing at around 0.13 after about 10 epochs. The validation and training set losses remain consistent, demonstrating good fitting performance, enhanced by early stopping to prevent overfitting, ensuring stable and robust performance. Overall, the method converges rapidly within 30 epochs, demonstrates excellent performance, and does not exhibit significant overfitting, making it suitable for application to this dataset.
Figure 3
Figure 3
Presents the evaluation results of the method’s performance on the benchmark dataset using the KPC method, where F1, F2, and F3 represent the AAC, DPC, and tripeptide composition (TPC) features, respectively, for k = 1, 2, 3. The evaluation indicators include ACC, (MCC, F1score, SN, and SP. When F1 is used alone, the model performs best, achieving an ACC of 67.63%, an MCC of 35.23%, and an F1score of 67.58%, indicating that the AAC feature has strong discriminative ability in capturing the sequence’s basic information. However, performance is poorest when F3 is used alone (ACC of 56.23%, MCC of 12.46%) due to its data sparsity caused by high dimensionality. In the feature combination, the ACC of F1 + F2 is 64.12%, slightly lower than F1, but also shows good balance, while the ACC of F1 + F2 + F3 (62.14%) is slightly lower than that of F1, indicating that feature stacking may introduce redundant information, weakening performance. With the introduction of F3, the encoding dimension increases to 8420 dimensions, requiring more computational resources.
Figure 4
Figure 4
Illustrates the time consumption (in seconds) of different feature combinations used in the proposed RBP prediction model, with F1, F2, and F3. The results show that using F1 alone requires the least time at 60.28, followed by F2 at 88.36s, while F3 significantly increases the computational cost to 905.38s due to its higher dimensionality (8000 dimensions). Combining features further escalates the time: F1 + F2 takes 73.38s, F1 + F3 consumes 1643.74s, F2 + F3 requires 1138.78s, and the full combination F1 + F2 + F3 demands the time at 1250.68s. This indicates that while F1 and F2 offer a balance between computational efficiency and predictive performance (as shown in Figure 3), incorporating F3 substantially increases runtime, highlighting the trade-off between feature complexity and computational cost in RBP prediction tasks.
Figure 5
Figure 5
Illustrates the comparison of the ROC curves and ACC for the methods. This study compared the performance of 11 machine learning methods. (A) illustrates among these, SVM demonstrated the best performance with an AUC value of 0.845, and its ROC curve was closest to the upper left corner. LightGBM and XGB followed closely with AUC values of 0.832 and 0.827, respectively, while GBDT and RF also performed well with AUC values of 0.825 and 0.814. KNN, DT, and NB perform poorly, with AUC values below 0.700, specifically 0.688, 0.641, and 0.694, respectively. Overall, shallow learning methods such as SVM performed well, while LightGBM and XGB demonstrated advantages in classification ability and are suitable for complex data. In contrast, other methods like KNN and NB showed weaker performance and may require further optimization or replacement. (B) shows that SVM, GBDT, XGBoost, and LightGBM perform well in accuracy metrics, achieving an accuracy rate of over 75% and demonstrating excellent classification ability. The accuracy range for LR, RF, and LDA is 70% to 75%, indicating comparable performance. The accuracy of BG ranges from 65% to 70%, indicating a moderate level of performance. However, the accuracy of KNN, DT, and NB is relatively low, concentrated between 50% and 65%, reflecting poor performance.
Figure 6
Figure 6
Shows a heatmap of the Pearson correlation coefficients between the prediction results of the machine learning models and the original features (R, GR, RG), reflecting the strength of the correlation between these predictions and the original features. The redder the color in the figure, the stronger the positive correlation between the features. The bluer the color, the stronger the negative correlation between the features. The heatmap indicates that the prediction results of XGBoost, RF, and LightGBM (XGB_Pred_Result, RF_Pred_Result, LIGHTGBM_Pred_Result) are highly correlated (0.98–0.99), suggesting that the predictions of these models are consistent and may capture similar patterns. In contrast, the prediction results of LR (LR_Pred_Result) show moderate correlation with the original features R, GR, and RG (0.35–0.52), and moderate to strong correlation with predictions from other models (0.42–0.78), indicating that LR may rely more on the original features due to its linear nature. Overall, the prediction results of the ensemble models are highly correlated with one another, likely due to shared feature representations, but weakly correlated with the original features (0.20–0.52).
Figure 7
Figure 7
Shows that the correlation coefficient between LDA_Pred_Result and SVM_Pred_Result is 0.86, above the Pearson threshold of 0.80. We retained both due to their complementary mechanisms and high AUC values (0.845, 0.804). Other feature pairs, with correlations below 0.80 (0.20–0.79), were retained to ensure predictive diversity.
Figure 8
Figure 8
Illustrates the accuracy and loss curves of the proposed RBP prediction method. Subfigure (A) shows the average accuracy (A1) and loss (A2) curves of SVM, where training stops after about 20 epochs. The training accuracy was stable at around 0.750, while the validation accuracy fluctuated around 0.760. The loss decreased to between 0.550 and 0.565, indicating that early stopping alleviated overfitting despite the oscillation. Subfigure (B) shows the average accuracy (B1) and loss (B2) curves after adding LR, stopping after about 20 epochs. The training accuracy reached 0.758, the validation accuracy peak increased to 0.762, and the loss decreased to about 0.500, indicating an improvement compared to Subfigure (A) and showing that early stopping has better generalization ability. Subfigure (C) shows the average accuracy (C1) and loss (C2) curves with LDA added, stopping at 30 epochs. The training and validation accuracy converges between 0.780 and 0.800, while the loss stabilizes between 0.490 and 0.500, reflecting limited improvement that may be caused by feature redundancy. Finally, Subfigure (D) depicts the average accuracy (D1) and loss (D2) curves including LightGBM, which ends after 30 epochs. The training and validation accuracy converges to about 0.97, while the loss decreases to less than 0.14, demonstrating optimal convergence and stability and emphasizing the effectiveness of LightGBM and the benefits of early stopping in balancing performance and training efficiency.
Figure 9
Figure 9
Shows the performance of 11 machine learning methods on the benchmark dataset under the F1 feature set (i.e., AAC, k = 1), which is evaluated by ROC curve (A) and accuracy (B). Compared with Figure 5A, the AUC values of all machine learning methods in (A) decreased; for example, LightGBM decreased from 0.832 to 0.823, and SVM decreased from 0.845 to 0.828. Similarly, (B) shows that the prediction accuracy is also generally reduced, with the highest accuracy of about 76%, which is about 2% lower than the highest value of 78% in Figure 5B. Specifically, the accuracy of each classifier is reduced; for example, LR is reduced from 74% to below 70%, and SVM is reduced from 79% to 76%. In addition, the prediction accuracy range of some classifiers has been widened, such as LightGBM and GBDT, indicating that the stability of the method has decreased [56,57].
Figure 10
Figure 10
Illustrates the accuracy (A) and loss curves (B) of the method under the F1, utilizing early stopping and 5-fold cross-validation, while Figure 2A, B represents the same under the F1 + F2. In Figure 2A, the validation accuracy stabilizes at around 0.97 after 10 epochs, with losses dropping below 0.13 by 10 epochs, as seen in Figure 2B. In contrast, (A) shows that the validation set accuracy under F1 gradually stabilizes at 0.97 after 20 epochs. (B) shows a slower decrease in loss, with the validation set loss stabilizing at around 0.11 after 30 epochs. In addition, Figure 2 shows a more pronounced stability after stabilizing. This indicates that compared to F1 alone, the F1 + F2 combination improves convergence speed and stability by capturing global and local sequence patterns.

Similar articles

References

    1. Koletsou E., Huppertz I. RNA-binding proteins as versatile metabolic regulators. Npj Metab. Health Disease. 2025;3:1. doi: 10.1038/s44324-024-00044-z. - DOI
    1. Hogan D.J., Riordan D.P., Gerber A.P., Herschlag D., Brown P.O. Diverse RNA-binding proteins interact with functionally related sets of RNAs, suggesting an extensive regulatory system. PLoS Biol. 2008;6:e255. doi: 10.1371/journal.pbio.0060255. - DOI - PMC - PubMed
    1. Corley M., Burns M.C., Yeo G.W. How RNA-binding proteins interact with RNA: Molecules and mechanisms. Mol. Cell. 2020;78:9–29. doi: 10.1016/j.molcel.2020.03.011. - DOI - PMC - PubMed
    1. Muthusamy M., Kim J.H., Kim J.A., Lee S.I. Plant RNA binding proteins as critical modulators in drought, high salinity, heat, and cold stress responses: An updated overview. Int. J. Mol. Sci. 2021;22:6731. doi: 10.3390/ijms22136731. - DOI - PMC - PubMed
    1. Tao Y., Zhang Q., Wang H., Yang X., Mu H. Alternative splicing and related RNA binding proteins in human health and disease. Signal Transduct. Target. Ther. 2024;9:26. doi: 10.1038/s41392-024-01734-2. - DOI - PMC - PubMed

LinkOut - more resources