

Plasma Fatty Acid Profiling and Mathematical Estimation of the Omega-3 Index: Toward Diagnostic Tools in Atherosclerosis and Statin Therapy Monitoring
- PMID: 40564102
- PMCID: PMC12189591
- DOI: 10.3390/biomedicines13061383
Plasma Fatty Acid Profiling and Mathematical Estimation of the Omega-3 Index: Toward Diagnostic Tools in Atherosclerosis and Statin Therapy Monitoring
Abstract
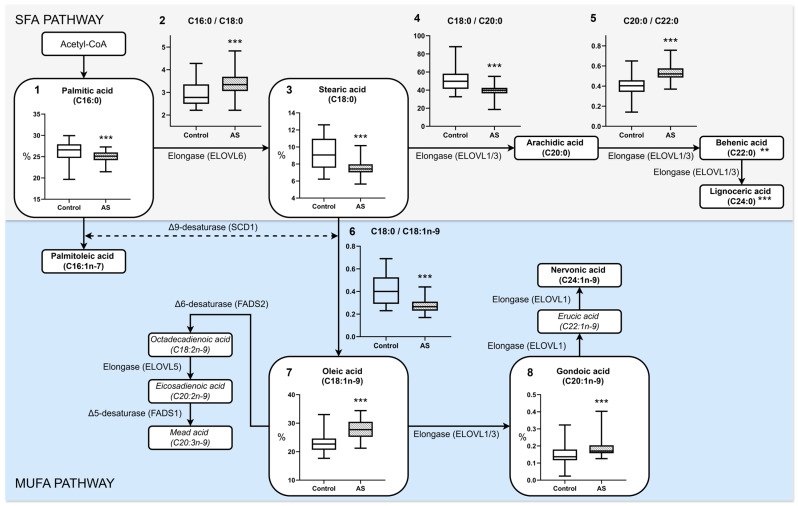
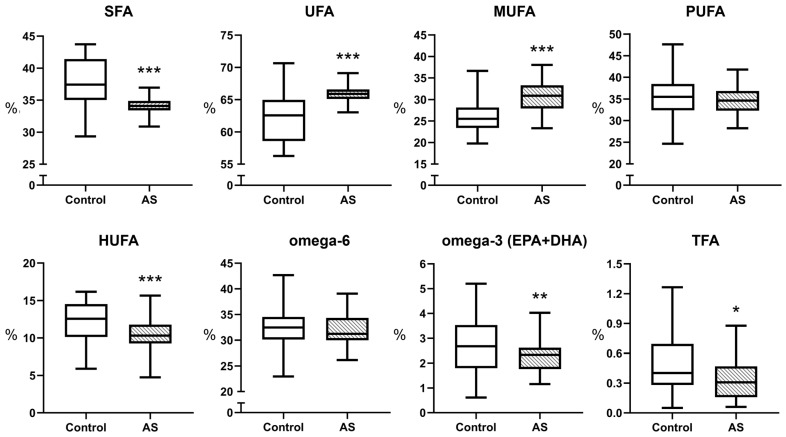
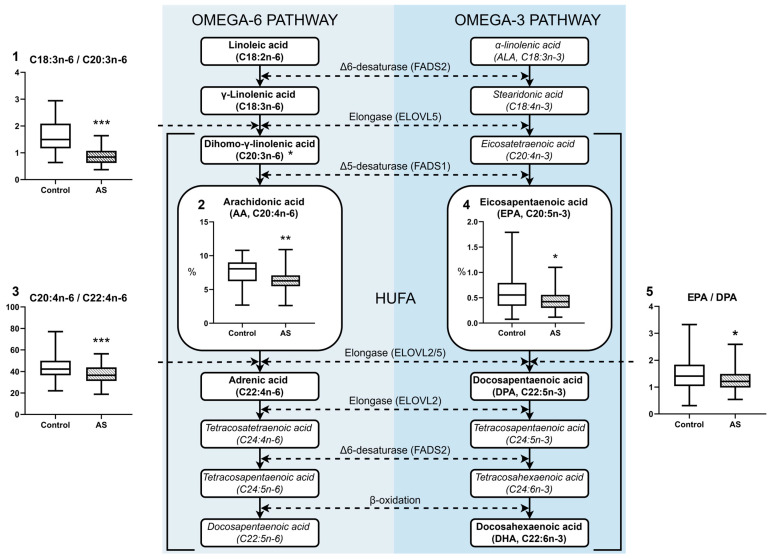
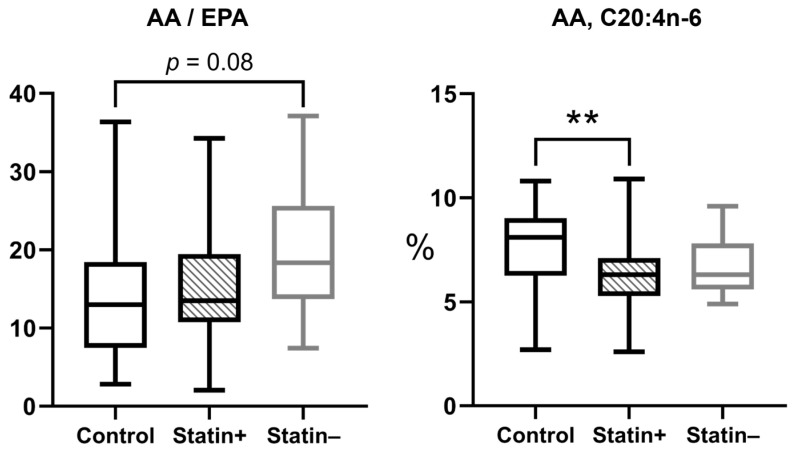
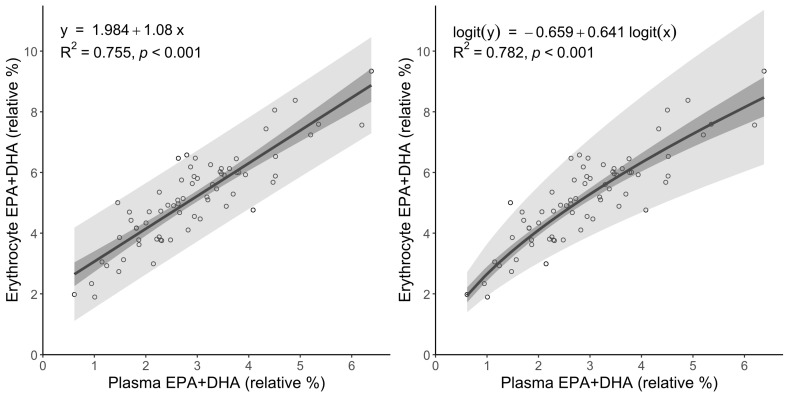
Background/Objectives: Omega-3 highly unsaturated fatty acids (HUFAs), particularly EPA and DHA, have anti-inflammatory and lipid-modulating properties for treating atherosclerosis. However, the relationship between plasma fatty acid profiles, omega-3 status, and statin efficacy in carotid atherosclerosis remains poorly defined. Objectives: This study evaluates plasma and plaque fatty acid (FA) composition, explores their associations with plaque stability, and examines the relationship of omega-3 levels, lipid biomarkers (VLDL-C, LDL-C, HDL-C, total cholesterol, and triglycerides) with statin and β-blocker treatment. A mathematical model was developed to predict the erythrocyte omega-3 index from plasma. Methods: In this case-control study, plasma and carotid plaques of 52 patients undergoing carotid endarterectomy were analyzed. Plasma was compared with that of 50 healthy controls. FAs were quantified by LC-MS/MS. Plaques were histologically classified as stable or unstable. Results: Atherosclerotic patients showed disturbed FA metabolism, including decreased plasma omega-3 EPA + DHA, SFAs and HUFAs, increased MUFAs, and impaired desaturase and elongase activity. Unstable plaques had higher MUFA and lower HUFA content compared with stable plaques. Significant correlations between plasma EPA + DHA and HDL-C and triglycerides were observed in statin-naïve patients, whereas statins appeared to attenuate these associations. Co-treatment with β-blockers had no significant effect. A validated logit-based model accurately predicted the erythrocyte omega-3 index from plasma (R2 = 0.782). Conclusions: Altered plasma and plaque FA profiles correlate with atherosclerosis's plaque instability and inflammatory lipid profiles. Statins significantly influence these associations, suggesting their complex interaction with lipid metabolism. Plasma measurements of omega-3 fatty acids in combination with predictive modelling may be beneficial for diagnostic and therapeutic monitoring in carotid atherosclerosis.
Keywords: atherosclerotic plaques; carotid atherosclerosis; lipid metabolism; omega-3 fatty acids; regression analysis; statins.
Conflict of interest statement
The authors declare no conflicts of interest. The funders had no role in the design of the study; in the collection, analyses, or interpretation of the data; in the writing of the manuscript; or in the decision to publish the results.
Figures
References
-
- Alfaddagh A., Elajami T.K., Saleh M., Mohebali D., Bistrian B.R., Welty F.K. An Omega-3 Fatty Acid Plasma Index ≥4% Prevents Progression of Coronary Artery Plaque in Patients with Coronary Artery Disease on Statin Treatment. Atherosclerosis. 2019;285:153–162. doi: 10.1016/j.atherosclerosis.2019.04.213. - DOI - PMC - PubMed
-
- Ahn J., Park S.K., Park T.S., Kim J.H., Yun E., Kim S.P., Lee H.W., Oh J.H., Choi J.H., Cha K.S., et al. Effect of N-3 Polyunsaturated Fatty Acids on Regression of Coronary Atherosclerosis in Statin Treated Patients Undergoing Percutaneous Coronary Intervention. Korean Circ. J. 2016;46:481–489. doi: 10.4070/kcj.2016.46.4.481. - DOI - PMC - PubMed
-
- Hande L.N., Thunhaug H., Enebakk T., Ludviksen J., Pettersen K., Hovland A., Lappegård K.T. Addition of Marine Omega-3 Fatty Acids to Statins in Familial Hypercholesterolemia Does Not Affect in Vivo or in Vitro Endothelial Function. J. Clin. Lipidol. 2019;13:762–770. doi: 10.1016/j.jacl.2019.08.004. - DOI - PubMed
-
- Umemoto N., Ishii H., Kamoi D., Aoyama T., Sakakibara T., Takahashi H., Tanaka A., Yasuda Y., Suzuki S., Matsubara T., et al. Reverse Association of Omega-3/Omega-6 Polyunsaturated Fatty Acids Ratios with Carotid Atherosclerosis in Patients on Hemodialysis. Atherosclerosis. 2016;249:65–69. doi: 10.1016/j.atherosclerosis.2016.03.037. - DOI - PubMed
Grants and funding
LinkOut - more resources
Full Text Sources
Research Materials
Miscellaneous
