

Longitudinal Changes in Neuroaxonal and Inflammatory CSF Biomarkers in Multiple Sclerosis Patients Undergoing Interferon Beta Therapy
- PMID: 40564113
- PMCID: PMC12190630
- DOI: 10.3390/biomedicines13061394
Longitudinal Changes in Neuroaxonal and Inflammatory CSF Biomarkers in Multiple Sclerosis Patients Undergoing Interferon Beta Therapy
Abstract
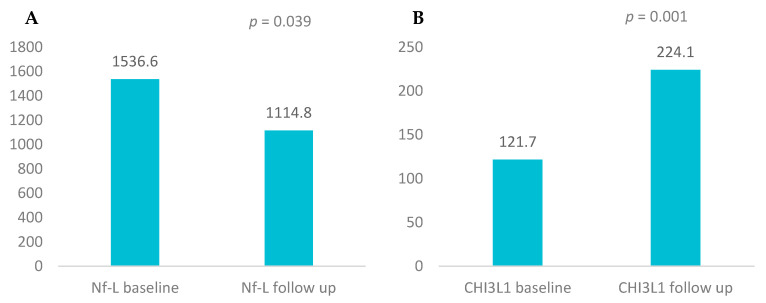
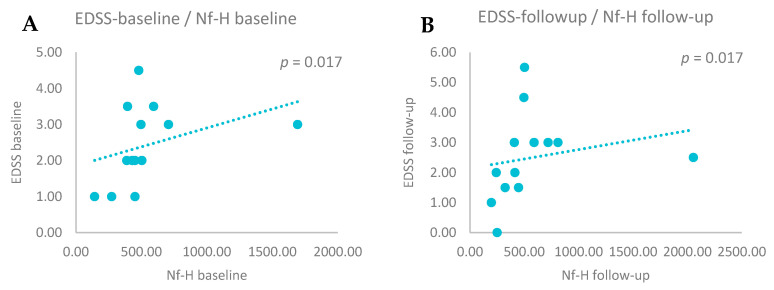
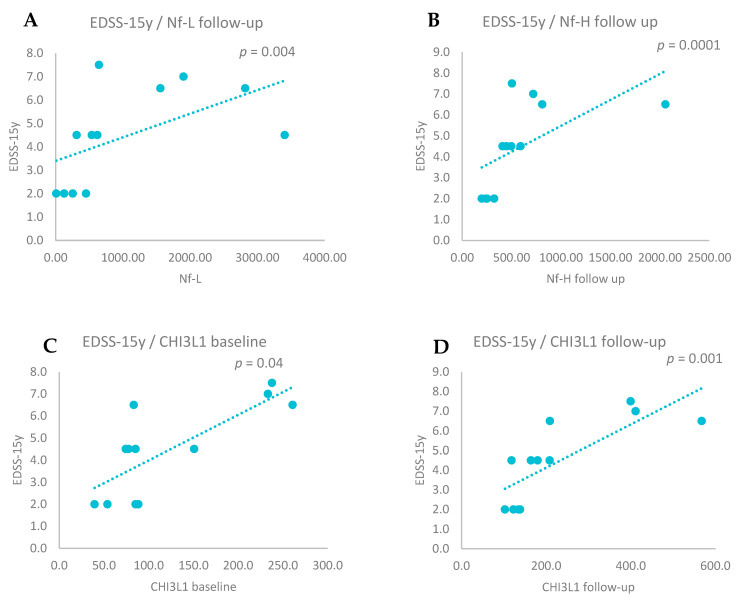
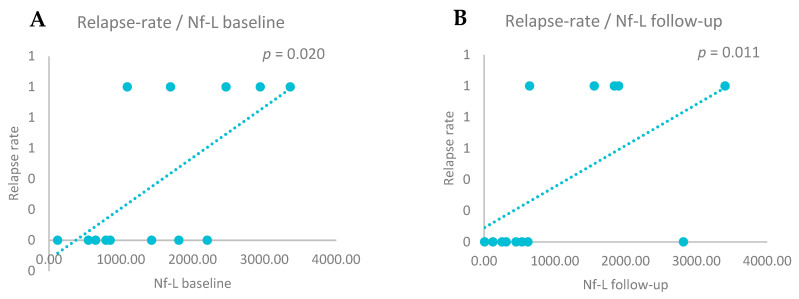
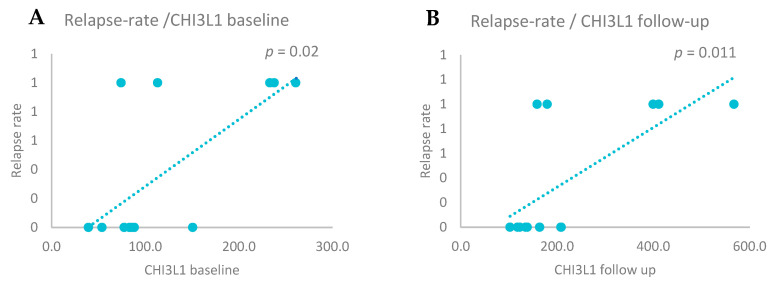
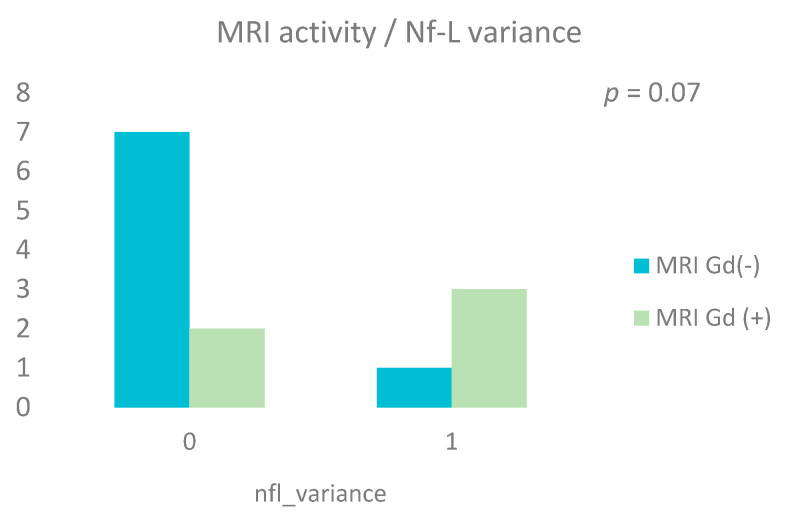
Background/Objective: Neurofilament light chain (Nf-L), neurofilament heavy chain (Nf-H), and chitinase 3-like 1 (CHI3L1) are cerebrospinal fluid (CSF) biomarkers of neuroaxonal damage and inflammation in multiple sclerosis (MS). Their longitudinal response to disease-modifying therapies and association with clinical and radiological outcomes remain incompletely understood. The aim of this study is to evaluate the impact of interferon beta (IFN-β) therapy on CSF levels of Nf-L, Nf-H, and CHI3L1 in early relapsing-remitting MS (RRMS) and assess their association with long-term clinical outcomes and MRI activity. Methods: We conducted a prospective two-year observational study involving 14 treatment-naive RRMS patients who initiated IFN-β therapy. CSF levels of Nf-L, Nf-H, and CHI3L1 were measured at baseline and after two years. Clinical disability was assessed via the Expanded Disability Status Scale (EDSS) and by studying brain MRI activity. A 15-year clinical follow-up was performed for 12 patients. Results: Nf-L levels significantly decreased after two years of IFN-β treatment (p = 0.039), while CHI3L1 levels significantly increased (p = 0.001). Nf-H levels remained stable. Nf-L and CHI3L1 levels at baseline and follow-up correlated with relapse rate and long-term EDSS. Nf-H levels correlated with EDSS scores but not with relapse or MRI activity. A trend toward a positive correlation between increasing Nf-L levels and MRI activity was observed (p = 0.07). Conclusions: CSF biomarkers demonstrate differential responses to IFN-β therapy in early RRMS. Nf-L emerges as a sensitive biomarker of treatment response and disease activity, while CHI3L1 may reflect ongoing tissue remodeling and inflammation. These findings support the utility of CSF biomarker monitoring for personalized treatment strategies in MS.
Keywords: CHI3L1; biomarkers; cerebrospinal fluid; disease-modifying therapy; interferon beta; longitudinal study; multiple sclerosis; neurofilament heavy chain; neurofilament light chain.
Conflict of interest statement
The authors declare no conflicts of interest.
Figures
Similar articles
-
Teriflunomide for multiple sclerosis.Cochrane Database Syst Rev. 2016 Mar 22;3(3):CD009882. doi: 10.1002/14651858.CD009882.pub3. Cochrane Database Syst Rev. 2016. PMID: 27003123 Free PMC article.
-
Interferons-beta versus glatiramer acetate for relapsing-remitting multiple sclerosis.Cochrane Database Syst Rev. 2016 Nov 24;11(11):CD009333. doi: 10.1002/14651858.CD009333.pub3. Cochrane Database Syst Rev. 2016. PMID: 27880972 Free PMC article.
-
Fingolimod for relapsing-remitting multiple sclerosis.Cochrane Database Syst Rev. 2016 Apr 19;4(4):CD009371. doi: 10.1002/14651858.CD009371.pub2. Cochrane Database Syst Rev. 2016. PMID: 27091121 Free PMC article.
-
Alemtuzumab for multiple sclerosis.Cochrane Database Syst Rev. 2016 Apr 15;4(4):CD011203. doi: 10.1002/14651858.CD011203.pub2. Cochrane Database Syst Rev. 2016. Update in: Cochrane Database Syst Rev. 2023 Jun 5;6:CD011203. doi: 10.1002/14651858.CD011203.pub3. PMID: 27082500 Free PMC article. Updated.
-
Treatment with disease-modifying drugs for people with a first clinical attack suggestive of multiple sclerosis.Cochrane Database Syst Rev. 2017 Apr 25;4(4):CD012200. doi: 10.1002/14651858.CD012200.pub2. Cochrane Database Syst Rev. 2017. PMID: 28440858 Free PMC article.
References
-
- Franciotta D. Biological markers in multiple sclerosis. Int. MS J. 2004;11:87–94. - PubMed
LinkOut - more resources
Full Text Sources
