Review
. 2025 Jun 10;13(6):1427.
doi: 10.3390/biomedicines13061427.

Animal Models of Spinal Cord Injury

Affiliations
Review

Animal Models of Spinal Cord Injury

Vladislav E Sobolev et al. Biomedicines. .

Abstract

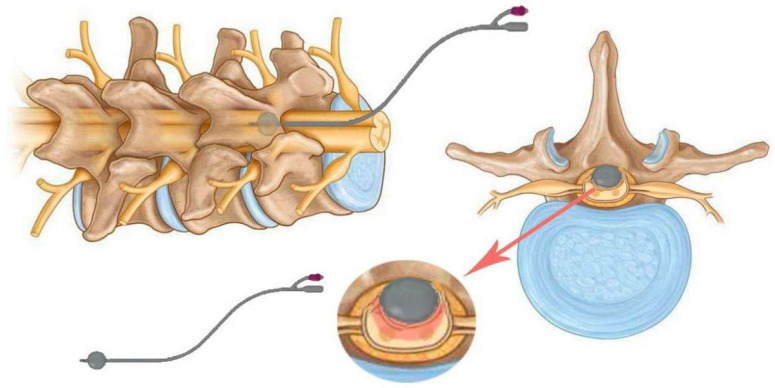
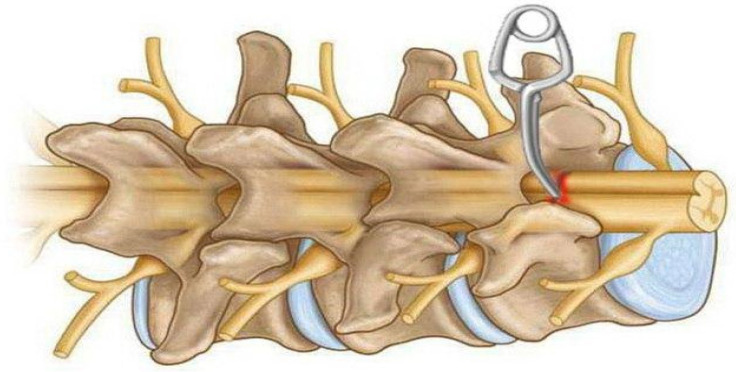
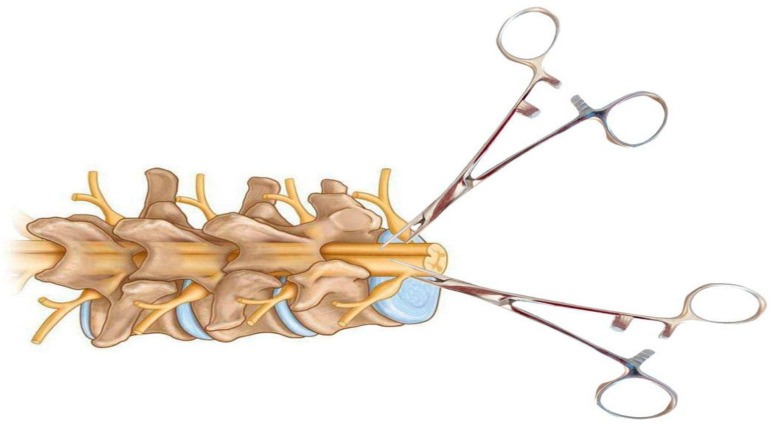
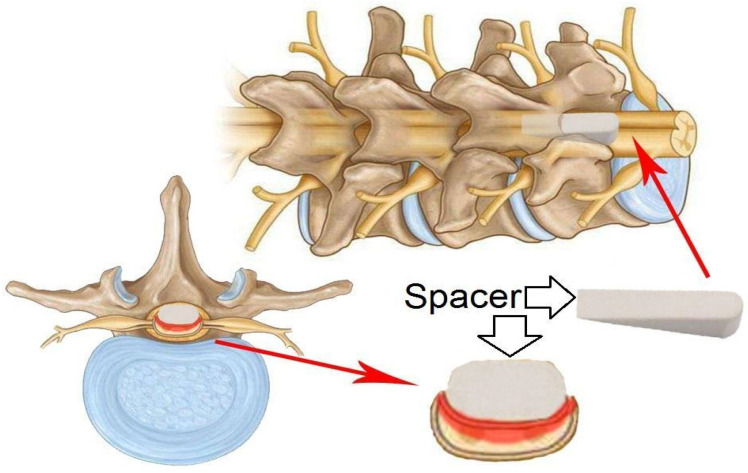
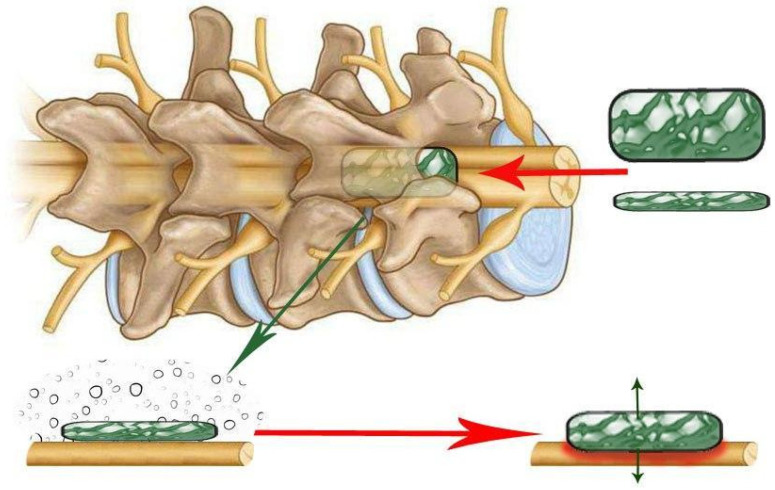
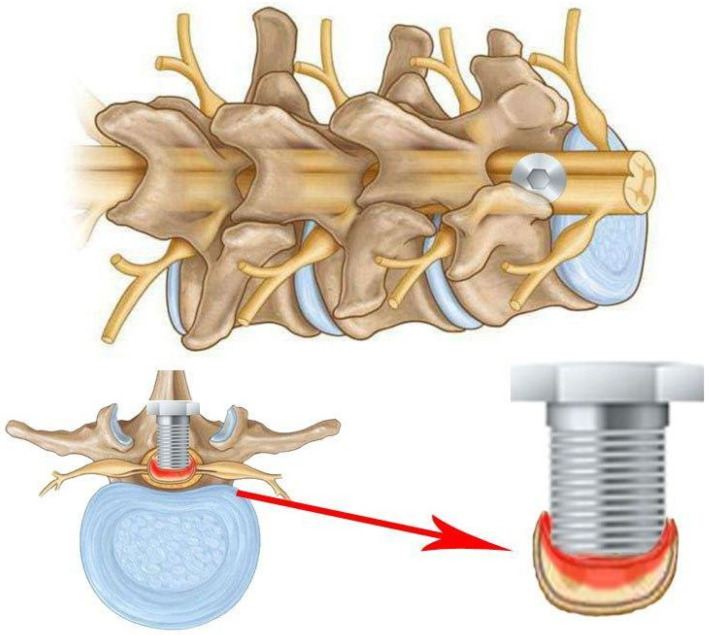
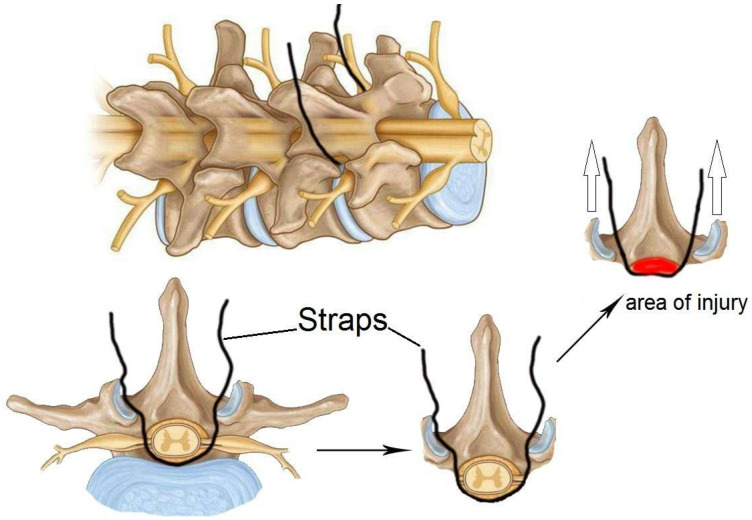
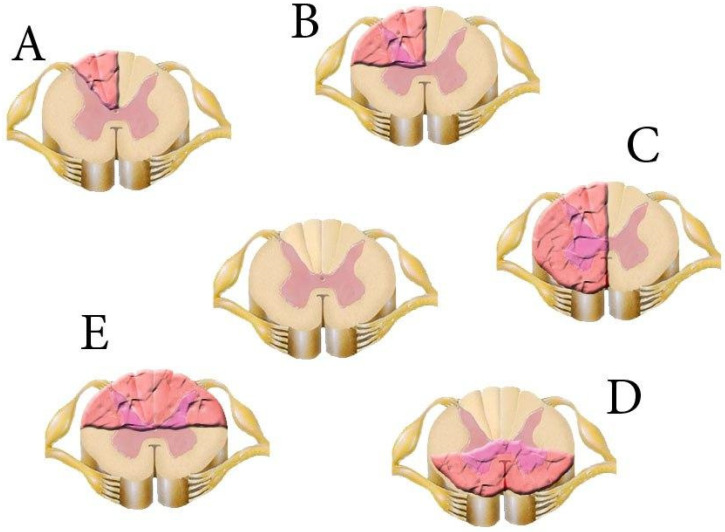
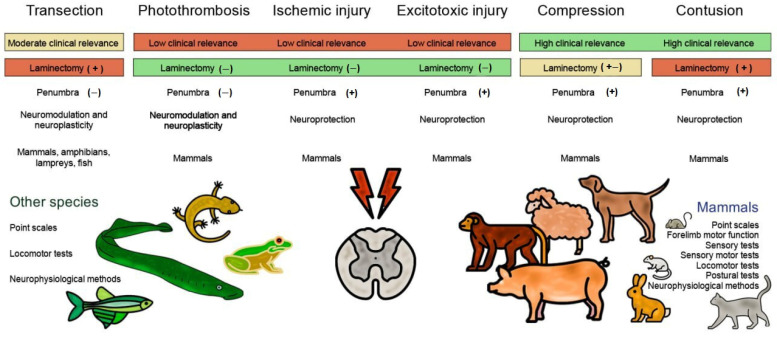
Spinal cord injury (SCI) is one of the most frequent causes of disability, accompanied by motor and postural impairments, as well as autonomic and behavioural disorders. Since the beginning of the last century, researchers have been developing and refining experimental models of SCI to study pathogenesis and find therapies. Since the beginning of the 20th century, quite a wide range of methods have been developed for contusion and compression injury, complete and partial transection of the spinal cord, and many others. The choice of model subject in such studies was not limited to mammals, but also included amphibians, lampreys, and even fish. Many functional tests have been proposed to assess functional recovery after injury in laboratory animals, ranging from simple rating scales to locomotion kinematics or recording of spinal neuronal activity. This review describes existing models of SCI in most animal species used in neurobiology. Their key characteristics are discussed, which determine the choice of model and model animals depending on the experimental tasks. Each experimental model of SCI has its own advantages and disadvantages determined by species-specific features of spinal cord anatomy and physiology, the speed of recovery from injury, and the ratio of the necrosis zone to the penumbra. The applicability and availability of the proposed methods for assessing the speed and completeness of recovery is also an important factor.

Keywords: animal models; cats; compression; contusion; dogs; fish; lampreys; mice; monkeys; pigs; rats; sheep; spinal cord injury; transection.


Conflict of interest statement

The authors declare no conflict of interest.

Figures

Figure 3
Figure 3
Three types of impactors are (a) OSU impactor [27]; (b) NYU/MACSIS impactor [28]; and (c) IH-0400 impactor (https://psiimpactors.com/product/ih400/) accessed on 15 May 2024. Use permitted under CC BY-NC 4.0.
Figure 1
Figure 1
Alfred Reginald Allen (1876–1918) and a schematic of a device (a) designed for dosed spinal cord injury in dogs. (b). A dream.ai neural network stylised image of Dr Allen’s device based on his textual description. The original drawing is from a 1911 article [13].
Figure 2
Figure 2
Evolution of SCI contusion animal models.
Figure 4
Figure 4
(a): Aneurysm clips. (b): Fogarty catheter. (c): Spacer. (d): Calibrated forceps. Arrows indicate the direction of compression. (c,d) cited by [17]. Use permitted under CC BY-NC 4.0.
Figure 5
Figure 5
Schematic of the balloon compression model with a 2-French Fogarty catheter and inflatable tip. The catheter is placed under the spine and over the dura mater upstream of the laminectomy and then inflated.
Figure 6
Figure 6
Schematic diagram of a model of spinal cord compression injury using an aneurysmatic clip on the exposed spinal cord after laminectomy. The spinal cord is placed between the two prongs of a special clip, after which the spinal cord is briefly compressed laterally and removed after a short time.
Figure 7
Figure 7
Schematic of a calibrated forceps model for spinal cord compression injury. The forceps are specially modified to include a spacer between the handles for even compression of the spinal cord. This model can be performed in the posterior or lateral plane of the spinal cord after laminectomy.
Figure 8
Figure 8
Schematic of a model of a solid wedge-shaped spacer that is inserted between the dorsal vertebral column and the dura mater of the spinal cord after laminectomy. The spacer can be left in place for several days to several weeks.
Figure 9
Figure 9
Schematic of an expanding polymer (green rectangle) inserted between the back of the vertebral column and the dura mater of the spinal cord after laminectomy. The polymer fragment expands in place over time, creating a growing spinal cord lesion that slowly compresses the spinal cord.
Figure 10
Figure 10
Schematic of the screw method of SCI, in which a screw is passed through the spinal column plate and compresses the spinal cord. The screw can be adjusted gradually over a period of days or weeks.
Figure 11
Figure 11
Schematic of a compression injury to the spinal cord using a compression thread or strap. The compression thread or strap passes through the dermal layers and wraps under the spinal cord before exiting the dermis. The threads are then attached to weights that pull the spinal cord dorsally, pressing it against the back of the spinal column. Empty arrows indicate the direction of straps tension.
Figure 12
Figure 12
Models of spinal cord transection (pink wavy area). (A)—dorsal funiculi transection; (B)—dorsolateral funiculus transection; (C)—lateral hemisection; (D)—ventral column lesion; (E)—dorsal column lesion. The intact spinal cord is in the centre.
Figure 13
Figure 13
Areas of spinal cord injury modelling in teleost fishes. (a) In most fish species, spinal cord transection (line and arrows) is performed at the cervical (C) or thoracic (T) level. (b) In A. leptorhynchus, caudal spinal cord amputation (line and arrow) can be performed by removing the entire caudal segment of the spinal cord.
Figure 14
Figure 14
Different models of SCI that can be reproduced in rats. In the compression model, a clamp is used to initiate the injury. In the contusion model of injury, the impactor is dropped from a predetermined distance. In the spinal cord transection model, microsurgical scissors are used.
Figure 15
Figure 15
Transverse sections of the rat (A,B) and human (C) demonstrating the approximate locations and sizes of the corticospinal, rubrospinal, and reticulospinal tracts. Rats were injected with an anterograde tracer, biotinylated dextran amine, into the motor cortex (A), reticular formation and red nucleus (B). Injections performed according to [180]. The corticospinal tract (CST) has larger lateral fibres in humans (yellow), while there is no dorsal CST in humans as compared to rats, who have a large dorsal CST (green). Both rats and humans have a ventral CST (pink). The rubrospinal tract (red) is prominent in rats, but largely reduced in humans, only passing through the upper cervical levels. All species express the reticulospinal tract (blue) prominently, with slight variations in location and size. High-order non-human primates more closely resemble humans; however, tract size and exact location varies between non-human primate species. Adapted from [174]. Use permitted under CC BY-NC 4.0.
Figure 16
Figure 16
Cross-species comparison of the neural basis of vertebrate movement. (A) Cladogram of vertebrate evolution with illustrations of movement patterns for each of the species listed as examples. The lamprey is the most primitive vertebrate and exhibits simple, undulatory swimming; zebrafish display more complex swimming patterns; the frog and salamander use both tail and limbs for movement; reptiles exhibit diagonal limb coordination; and mammals display complex fore−/hindlimb gaits. (B) Cardinal neuron classes that make up the spinal cord circuitry are derived from 11 progenitor domains. Some domains give rise to more than one neuron class, e.g., the p2 domain gives rise to the V2a, V2b, and V2c interneurons. (C) Comparison of interneuron subtypes and projection patterns in the spinal cord of zebrafish versus mice. Colours represent different neuron classes; grey represents neurons without a clear cardinal class identity [226]. Use permitted under CC BY-NC 4.0.
Figure 17
Figure 17
SCI model selection chart. The red color highlights the problematic aspects and methodological difficulties in selecting a specific SCI model. The yellow color highlights the “average balance” between the methodology of SCI models and their clinical significance. Green highlights the more easily implementable SCI models and their correspondence to clinical observations of spinal cord injury in humans. (+) indicates presence in the methodology; (−) indicates absence in the methodology; (+, −) indicates the possibility of both presence and absence in the methodology.

Similar articles

References

    1. WHO Spinal Cord Injury. 2023. [(accessed on 15 April 2025)]. Available online: https://www.who.int/news-room/fact-sheets/detail/spinal-cord-injury.
    1. National Spinal Cord Injury Statistical Center . Traumatic Spinal Cord Injury Facts and Figures at a Glance. University of Alabama at Birmingham; Birmingham, AL, USA: 2024. [(accessed on 15 May 2024)]. Available online: https://sci-bc.ca/wp-content/uploads/2024/05/us-sci-facts-and-stats-1.pdf.
    1. Priebe M.M., Chiodo A.E., Scelza W.M., Kirshblum S.C., Wuermser L.A., Ho C.H. Spinal cord injury medicine. 6. Economic and societal issues in spinal cord injury. Arch. Phys. Med. Rehabil. 2007;88:84–88. doi: 10.1016/j.apmr.2006.12.005. - DOI - PubMed
    1. Fernandez E., Pallini R., Marchese E., Tulomonti G. Experimental studies on spinal cord injuries in the last fifteen years. Neurol. Res. 1991;13:138–159. doi: 10.1080/01616412.1991.11739982. - DOI - PubMed
    1. Cheng H., Cao Y., Olson L. Spinal cord repair in adult paraplegic rats: Partial restoration of hind limb function. Science. 1996;273:510–513. doi: 10.1126/science.273.5274.510. - DOI - PubMed

LinkOut - more resources