. 2025 Jun 17;13(6):1489.
doi: 10.3390/biomedicines13061489.

Identification Exploring the Mechanism and Clinical Validation of Mitochondrial Dynamics-Related Genes in Membranous Nephropathy Based on Mendelian Randomization Study and Bioinformatics Analysis

Affiliations

Identification Exploring the Mechanism and Clinical Validation of Mitochondrial Dynamics-Related Genes in Membranous Nephropathy Based on Mendelian Randomization Study and Bioinformatics Analysis

Qiuyuan Shao et al. Biomedicines. .

Abstract

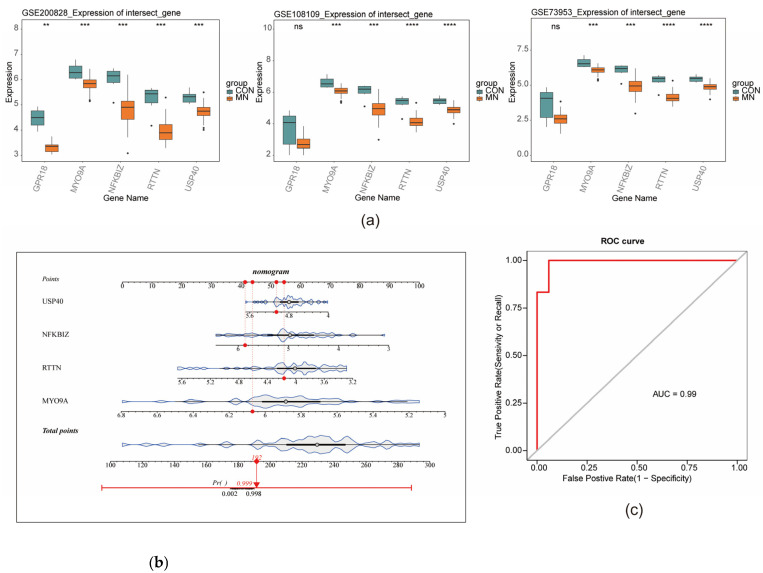
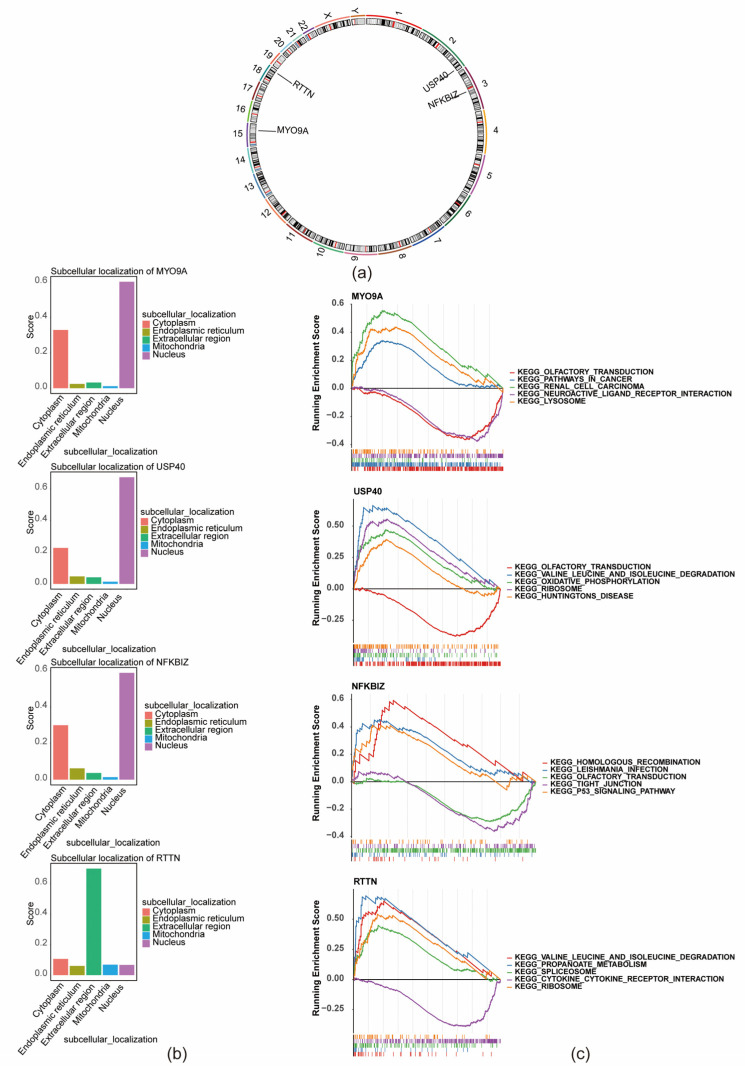
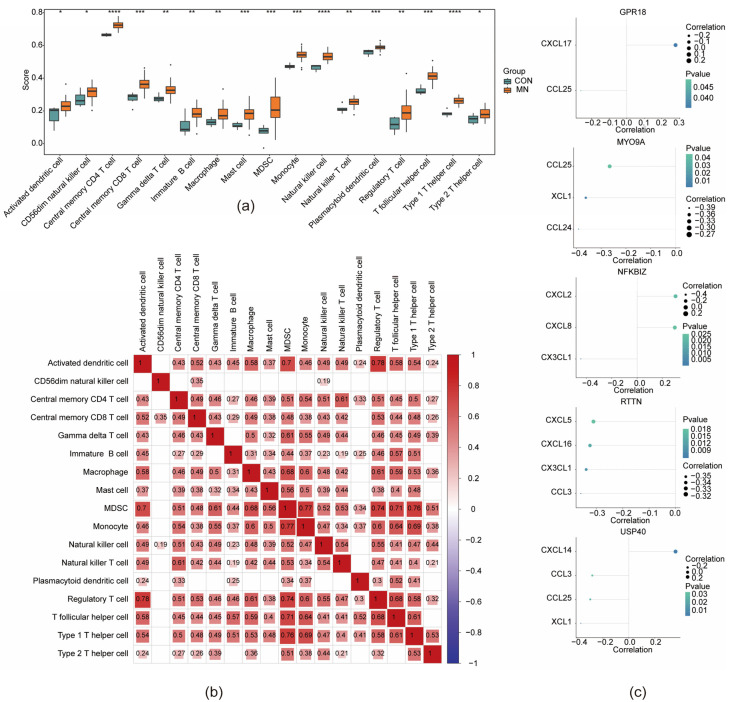
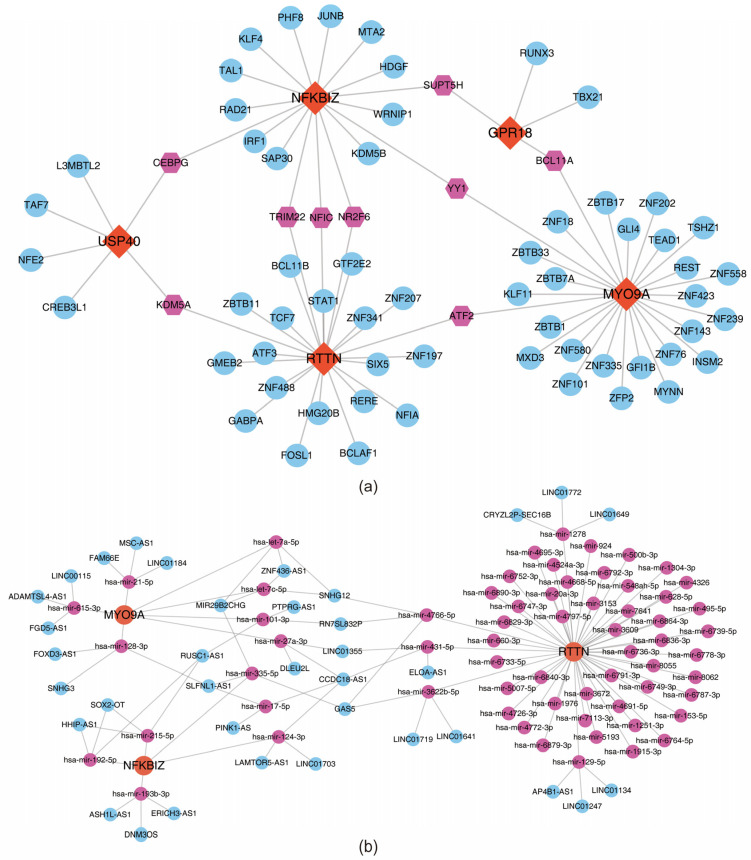
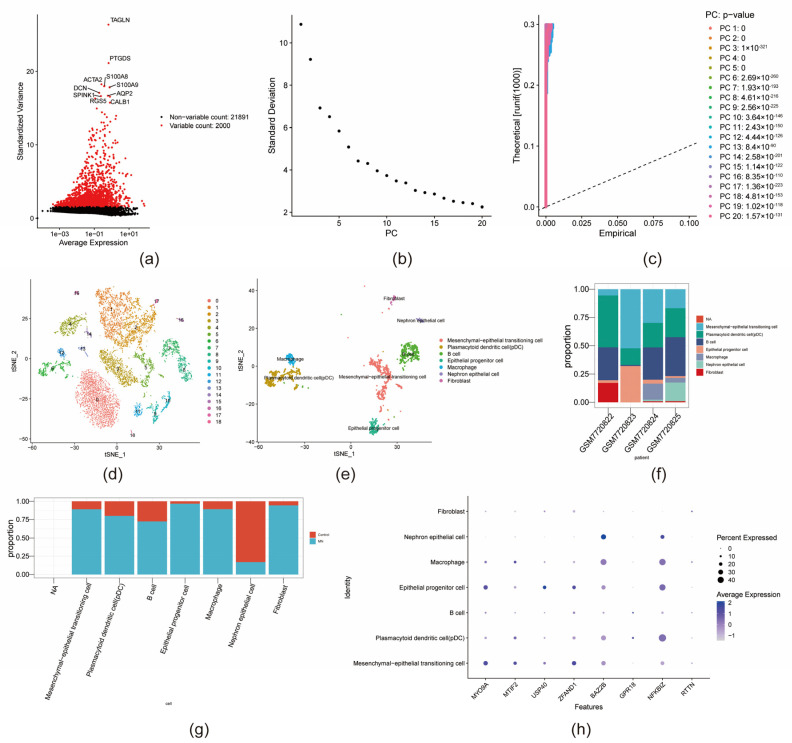
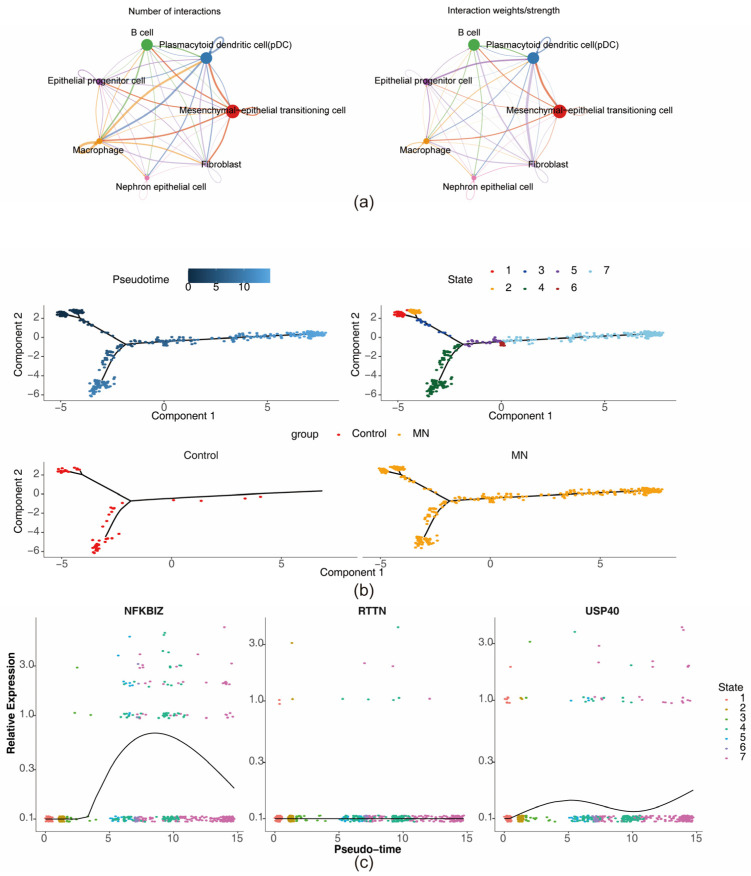
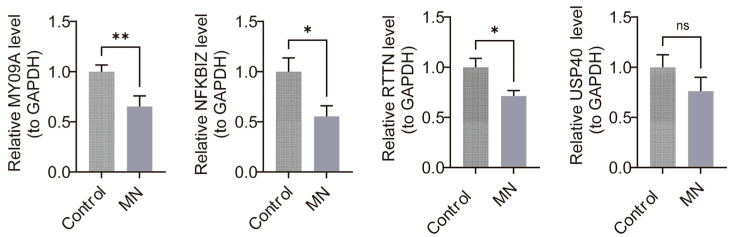
Background: Membranous nephropathy (MN), a prevalent glomerular disorder, remains poorly understood in terms of its association with mitochondrial dynamics (MD). This study investigated the mechanistic involvement of mitochondrial dynamics-related genes (MDGs) in the pathogenesis of MN. Methods: Comprehensive bioinformatics analyses-encompassing Mendelian randomization, machine-learning algorithms, and single-cell RNA sequencing (scRNA-seq)-were employed to interrogate transcriptomic datasets (GSE200828, GSE73953, and GSE241302). Core MDGs were further validated using reverse-transcription quantitative polymerase chain reaction (RT-qPCR). Results: Four key MDGs-RTTN, MYO9A, USP40, and NFKBIZ-emerged as critical determinants, predominantly enriched in olfactory transduction pathways. A nomogram model exhibited exceptional diagnostic performance (area under the curve [AUC] = 1). Seventeen immune cell subsets, including regulatory T cells and activated dendritic cells, demonstrated significant differential infiltration in MN. Regulatory network analyses revealed ATF2 co-regulation mediated by RTTN and MYO9A, along with RTTN-driven modulation of ELOA-AS1 via hsa-mir-431-5p. scRNA-seq analysis identified mesenchymal-epithelial transitioning cells as key contributors, with pseudotime trajectory mapping indicating distinct temporal expression profiles: NFKBIZ (initial upregulation followed by decline), USP40 (gradual fluctuation), and RTTN (persistently low expression). RT-qPCR results corroborated a significant downregulation of all four genes in MN samples compared to controls (p < 0.05). Conclusions: These findings elucidate the molecular underpinnings of MDG-mediated mechanisms in MN, revealing novel diagnostic biomarkers and therapeutic targets. The data underscore the interplay between mitochondrial dynamics and immune dysregulation in MN progression, providing a foundation for precision medicine strategies.

Keywords: machine learning; membranous nephropathy; mendelian randomization; mitochondrial dynamics; single-cell analysis.


Conflict of interest statement

The authors declare no conflicts of interest.

Figures

Figure 1
Figure 1
Identification of DEGs. (a) Volcano plot of DEGs1. Orange points represent upregulated genes, green points represent downregulated genes, and gray points represent genes with no significant difference under the threshold. (b) Expression heatmap of DEGs1. (c) Volcano plot of DEGs2. (d) Expression heatmap of DEGs2. (e) A total of 5 differentially upregulated intersection genes. (f) A total of 437 differentially downregulated intersection genes.
Figure 2
Figure 2
In total, 286 MD-DEGs were selected. (a) Box plot of MDGs score between MN and CON sample groups. *, p < 0.05 (b) Sample hierarchical clustering diagram. Each branch represents a sample, the red line represents the cutting line, and the vertical axis represents the Euclidean distance of sample expression. (c) Co-expression module identification. Different colors represent different modules. (d) Soft threshold selection. Left plot: Scale-free fitting index under different soft thresholds (x-axis); right plot: Network connectivity under different soft thresholds. The different numbers in the figure represent different soft thresholds. (e) Correlation heatmap between co-expression modules and MDGs scores. (f) Identification of 286 MD-DEGs.
Figure 3
Figure 3
Protein interaction and functional prediction of MD-DEGs. (a) GO enrichment circle plot of MD-DEGs. (b) KEGG enrichment plot of MD-DEGs. (c) Protein interaction network diagram of MD-DEGs.
Figure 4
Figure 4
Identification of 5 characterization genes and construction of machine-learning. (a) Selection of the optimal lambda value for LASSO. (b) LASSO coefficient penalty plot. (c) Random forest model. (d) Boruta algorithm gene importance ranking plot. (e) Identification of 5 feature genes.
Figure 5
Figure 5
Identification of key genes and construction of nomogram model. (a) Expression differences of feature genes in the training and validation sets. (b) Nomogram model was constructed based on key genes. (c) ROC curve evaluation of the predictive performance of the nomogram model was performed. ** represents p < 0.01, *** signifies p < 0.001, **** denotes p < 0.0001. “ns” represents no significant difference.
Figure 6
Figure 6
Chromosomal and subcellular localization and functional enrichment of key genes. (a) Chromosomal localization of key genes. (b) Subcellular localization of key cells. (c) Functional pathway analysis of key genes.
Figure 7
Figure 7
The immune microenvironment of membranous nephropathy. (a) Expression differences of 17 immune cell types between the disease and control groups. (b) Correlation heatmap of the 17 immune cell types. (c) Bubble plot of the correlation between key genes and different immune factors. * indicates that p < 0.05, ** represents p < 0.01, *** signifies p < 0.001, **** denotes p < 0.0001.
Figure 8
Figure 8
Molecular regulatory network of key genes. (a) Key gene–TF network diagram. (b) lncRNA–miRNA–mRNA network diagram.
Figure 9
Figure 9
Single-cell dataset analysis of membranous nephropathy. (a) Screening of highly variable genes. (b) Scree plot of the top 20 principal components. (c) Jackstraw permutation test plot. (d) Unsupervised clustering analysis plot. (e) Seven cell types identified. (f) Differences in the proportions of cell clusters in MN and control groups. (g) Expression patterns of seven cell clusters in MN and control groups. (h) Bubble plot of key gene expression in each cell cluster.
Figure 10
Figure 10
Cell communication network and pseudotime analysis. (a) The communication network between cells. Different colors represent different cell types, and the thickness of the lines represents the strength of cell–cell interactions. The thicker the line, the stronger the interaction. (b) Developmental trajectory of key cells. The top-left plot shows the differentiation timeline of cells, where deeper blue indicates earlier differentiation. The top-right plot illustrates seven different differentiation states of cells, with each state marked by a different color, and red represents the earliest differentiation type. The bottom-left plot shows the differentiation trajectory of key cells in the control samples. The bottom-right plot illustrates the differentiation trajectory of key cells in the MN samples. (c) Expression patterns of key genes in the seven differentiation states of key cells.
Figure 11
Figure 11
RT-qPCR validation of key genes. * indicates that p < 0.05, ** represents p < 0.01, “ns” represents no significant difference.

Similar articles

References

    1. Avasare R., Andeen N., Beck L. Novel Antigens and Clinical Updates in Membranous Nephropathy. Annu. Rev. Med. 2024;75:219–332. doi: 10.1146/annurev-med-050522-034537. - DOI - PubMed
    1. Prunotto M., Nachman P.H., Gillespie B.S., Beck L.H., Jr., Thompson A.M., Hu A.H., Stafford E.A., Tarnoff J.M., Rovin B.H. Designing clinical trials for the treatment of membranous nephropathy in the anti-PLA2R era: Results of a Nephcure membranous nephropathy workshop. Kidney Int. 2025;107:809–815. doi: 10.1016/j.kint.2024.09.020. - DOI - PubMed
    1. Storrar J., Gill-Taylor T., Chinnadurai R., Chrysochou C., Poulikakos D., Rainone F., Ritchie J., Lamerton E., Kalra P.A., Sinha S. A low rate of end-stage kidney disease in membranous nephropathy: A single centre study over 2 decades. PLoS ONE. 2022;17:e0276053. doi: 10.1371/journal.pone.0276053. - DOI - PMC - PubMed
    1. Glancy B. Visualizing Mitochondrial Form and Function within the Cell. Trends Mol. Med. 2020;26:58–70. doi: 10.1016/j.molmed.2019.09.009. - DOI - PMC - PubMed
    1. Li H., Zhou L., Zhou W., Zhang X., Shang J., Feng X., Yu L., Fan J., Ren J., Zhang R., et al. Decoding the mitochondrial connection: Development and validation of biomarkers for classifying and treating systemic lupus erythematosus through bioinformatics and machine learning. BMC Rheumatol. 2023;7:44. doi: 10.1186/s41927-023-00369-0. - DOI - PMC - PubMed

LinkOut - more resources