. 2025 Jun 15;15(12):1768.
doi: 10.3390/ani15121768.

Mulberry (Morus alba) Twig and Leaf Extracts Ameliorate Obesity-Related Metabolic Disorders via Gut Microbiota Modulation in High-Fat Diet-Fed Mice

Affiliations

Mulberry (Morus alba) Twig and Leaf Extracts Ameliorate Obesity-Related Metabolic Disorders via Gut Microbiota Modulation in High-Fat Diet-Fed Mice

Wei Qian et al. Animals (Basel). .

Abstract

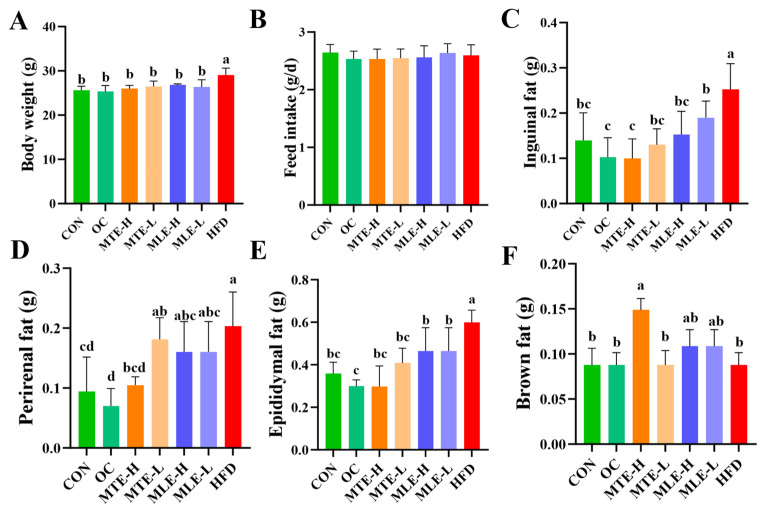
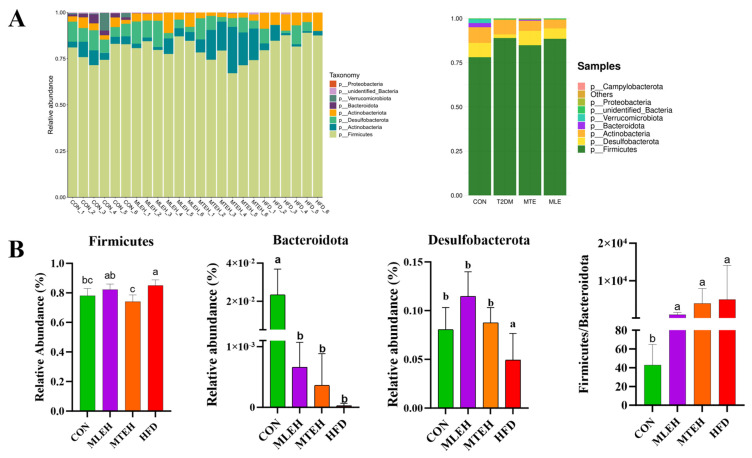
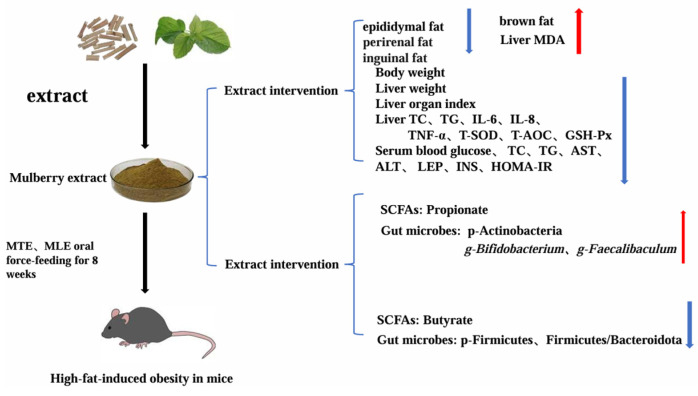
Mulberry (Morus alba) twigs and leaves, rich in flavonoids, polyphenols, polysaccharides, and alkaloids with multi-target regulatory properties on glucose/lipid metabolism, were evaluated for their anti-obesity effects using methanol-extracted twigs (MTE) and aqueous-extracted leaves (MLE) in high-fat diet (HFD)-induced obese mice. Both extracts significantly ameliorated obesity-related metabolic dysregulation, as evidenced by attenuated body weight gain, visceral fat accumulation, serum lipid profiles, homeostatic model assessment of insulin resistance (HOMA-IR), and hepatic inflammation compared to HFD controls (p < 0.05). Concurrently, MTE and MLE enhanced systemic antioxidant capacity and elevated high-density lipoprotein cholesterol (HDL-C) levels. Notably, high-dose MTE (MTEH, 1000 mg/kg) markedly reduced perirenal adiposity while increasing brown adipose tissue mass (p < 0.05). Mechanistic investigations revealed that MTEH reshaped gut microbiota composition by suppressing Firmicutes and Enterococcus, while enriching beneficial Faecalibaculum and Bifidobacterium spp. (p < 0.05). Furthermore, cecal short-chain fatty acid (SCFA) profiling demonstrated MTEH and MLEH-mediated metabolic reprogramming, characterized by increased propionic acid and decreased butyric acid, suggesting microbiota-dependent modulation of host energy metabolism. These findings collectively highlight the potential of mulberry extracts as multi-targeted nutraceuticals for obesity intervention via gut microbiota-SCFA axis regulation.

Keywords: glycolipid metabolism; gut microbiology; mulberry extract; obesity.


Conflict of interest statement

The authors declare no conflicts of interest.

Figures

Figure 1
Figure 1
Design of the experiment. Mulberry twig extract high dose, 1000 mg/kg group (MTEH); mulberry twig extract low dose, 500 mg/kg group (MTEL); mulberry leaf extract high dose, 1000 mg/kg group (MLEH); mulberry leaf extract high dose, 500 mg/kg group (MLEL); orlistat 200 mg/kg group (OC); blank control group (CON, normal diet + equal amount of distilled water); and high-fat diet feeding group (HFD, high-fat diet + equal amount of distilled water).
Figure 2
Figure 2
Effects of MTE and MLE interventions on fat accumulation in obese mice (n = 8/group). (A) Final body weight; (B) Feed intake; (C) Weights of inguinal fat; (D) Perirenal fat; (E) Epididymal fat; (F) Brown fat. Data were expressed as mean ± SD and analyzed by ordinary one-way ANOVA compared to the HFD group (model group). Different letters represent different significances (n = 8). Different letters above bars denote significant differences (p < 0.05, one-way ANOVA with Tukey’s post hoc test).
Figure 3
Figure 3
Effects of MTE and MLE on blood glucose and lipid levels in obese mice (n = 6/group). Serum (A) Cholesterol; (B) Triglycerides; (C) HDL Cholesterol; (D) LDL Cholesterol; (E) Insulin Resistance index; (F) Fasting blood glucose level. Data were expressed as mean ± SD and analyzed by ordinary one-way ANOVA compared to the HFD group (model group). Different letters represent different significances (n = 8). Different letters above bars denote significant differences (p < 0.05, one-way ANOVA with Tukey’s post hoc test).
Figure 4
Figure 4
Effect of MTE and MLE on serum hormone levels in obese mice (n = 6/group). Serum levels of (A) Leptin; (B) Insulin; (C) Adiponectin. Data were expressed as mean ± SD and analyzed by ordinary one-way ANOVA compared to the HFD group (model group). Different letters represent different significances (n = 8). Different letters above bars denote significant differences (p < 0.05, one-way ANOVA with Tukey’s post hoc test).
Figure 5
Figure 5
Effects of MTE and MLE on liver function and metabolic indexes of obese mice (n = 6/group). (A) Serum alanine aminotransferase; (B) Serum glutamate aminotransferase; (C) Hepatic cholesterol; (D) Hepatic weight; (E) Hepatic organ index; (F) Hepatic triglyceride levels. Data were expressed as mean ± SD and analyzed by ordinary one-way ANOVA compared to the HFD group (model group). Different letters represent different significances (n = 8). Different letters above bars denote significant differences (p < 0.05, one-way ANOVA with Tukey’s post hoc test).
Figure 6
Figure 6
Effects of MTE and MLE on liver inflammatory factors and oxidative stress indices in obese mice (n = 6/group). (A) Interleukin-8 (IL-8); (B) Interleukin-6 (IL-6); (C) Interleukin-17 (IL-17); (D) Tumor Necrosis Factor-α (TNF-α); (E) Malondialdehyde (MDA); (F) Total Superoxide Dismutase (T-SOD); (G) Glutathione Peroxidase (GSH-Px); (H) Total antioxidant capacity (T-AOC). Data were expressed as mean ± SD and analyzed by ordinary one-way ANOVA compared to the HFD group (model group). Different letters represent different significances (n = 8). Different letters above bars denote significant differences (p < 0.05, one-way ANOVA with Tukey’s post hoc test).
Figure 7
Figure 7
Effect of MTE and MLE interventions on liver lipid deposition profile. Representative images of liver morphology, H&E staining of liver tissue in CON, MTEL, MTEH, MLEH, MLEL, and HFD groups (original magnification ×20, original magnification ×40).
Figure 8
Figure 8
Effect of MTE and MLE interventions on liver lipid deposition profiles (n = 6/group). Data are presented as the mean ± SD (n = 6). Different letters above bars denote significant differences (p < 0.05, one-way ANOVA with Tukey’s post hoc test).
Figure 9
Figure 9
Effect of MTE and MLE on the diversity of intestinal flora in obese mice (n = 6/group). (A) Venn diagram; (B) PCoA analysis; (C) Alpha-diversity analysis (Chao1, Shannon and Simpson indices). ***, p < 0.001 vs. control group (one-way ANOVA with Tukey’s multiple comparisons test).
Figure 10
Figure 10
Effect of MTE and MLE on the composition of intestinal flora at the portal level in obese mice (n = 6/group). (A) Relative abundance of TOP 10 bacteria at the gate level for each sample and treatment group; (B) relative abundance and Firmicutes/Bacteroidota (F/B) ratio of bacteria differing at the gate level; data are presented as mean ± SD deviation, and different letters indicate statistical differences between the two data sets (p < 0.05).
Figure 11
Figure 11
Effect of MTE and MLE on gut flora composition at the genus level in obese mice (n = 6/group). (A) Relative abundance of genus-level TOP 10 bacteria; (B) linear discriminant effect size analysis (LefSe) to identify representative bacterial taxa at different taxonomic levels for each treatment group; (C) relative abundance of genus-level differential bacteria; data are presented as mean ± SD deviation, and different letters indicate statistical differences between the two data sets (p < 0.05).
Figure 12
Figure 12
Correlation analysis between genus-level gut microbes and short-chain fatty acids. Each grid represents the Spearman correlation coefficient between rows and columns. A red color indicates positive correlation and a blue color indicates negative correlation. Significance: * 0.01 < p < 0.05; ** p < 0.01.
Figure 13
Figure 13
Mechanisms of MTE and MLE in Attenuating Lipid Deposition in Obese Mice. MTE, mulberry twig extract; MLE, mulberry leaf extract;red arrows indicate an increase, blue arrows indicate a decrease.

Similar articles

References

    1. Xu J., Wu T., Lam S.M., Shui G., Yang S., Wang Y., Tao C. Heterogeneity of Intramuscular, Intermuscular, and Subcutaneous Fat in Laiwu Pigs: Insights from Targeted Lipidomics and Transcriptomics. Agriculture. 2024;14:658. doi: 10.3390/agriculture14050658. - DOI
    1. Fu Q., Wang P., Zhang Y., Wu T., Huang J., Song Z. Effects of Dietary Inclusion of Asiaticoside on Growth Performance, Lipid Metabolism, and Gut Microbiota in Yellow-Feathered Chickens. Animals. 2023;13:2653. doi: 10.3390/ani13162653. - DOI - PMC - PubMed
    1. Velázquez K.T., Enos R.T., Bader J.E., Sougiannis A.T., Carson M.S., Chatzistamou I., Carson J.A., Nagarkatti P.S., Nagarkatti M., Murphy E.A. Prolonged high-fat-diet feeding promotes non-alcoholic fatty liver disease and alters gut microbiota in mice. World J. Hepatol. 2019;11:619–637. doi: 10.4254/wjh.v11.i8.619. - DOI - PMC - PubMed
    1. Tan R., Dong H., Chen Z., Jin M., Yin J., Li H., Shi D., Shao Y., Wang H., Chen T., et al. Intestinal Microbiota Mediates High-Fructose and High-Fat Diets to Induce Chronic Intestinal Inflammation. Front. Cell Infect. Microbiol. 2021;11:654074. doi: 10.3389/fcimb.2021.654074. - DOI - PMC - PubMed
    1. Guan L., Zhang L., Gong D., Li P., Zhu S., Tang J., Du M., Zhang M., Zou Y. Genipin improves obesity through promoting bile secretion and changing bile acids composition in diet-induced obese rats. J. Pharm. Pharmacol. 2024;76:897–907. doi: 10.1093/jpp/rgae055. - DOI - PubMed

LinkOut - more resources