. 2025 Jun 9;12(6):624.
doi: 10.3390/bioengineering12060624.

Enhanced Aerosol Containment Performance of a Negative Pressure Hood with an Aerodynamic Cap Design: Multi-Method Validation Using CFD, PAO Particles, and Microbial Testing

Affiliations

Enhanced Aerosol Containment Performance of a Negative Pressure Hood with an Aerodynamic Cap Design: Multi-Method Validation Using CFD, PAO Particles, and Microbial Testing

Seungcheol Ko et al. Bioengineering (Basel). .

Abstract

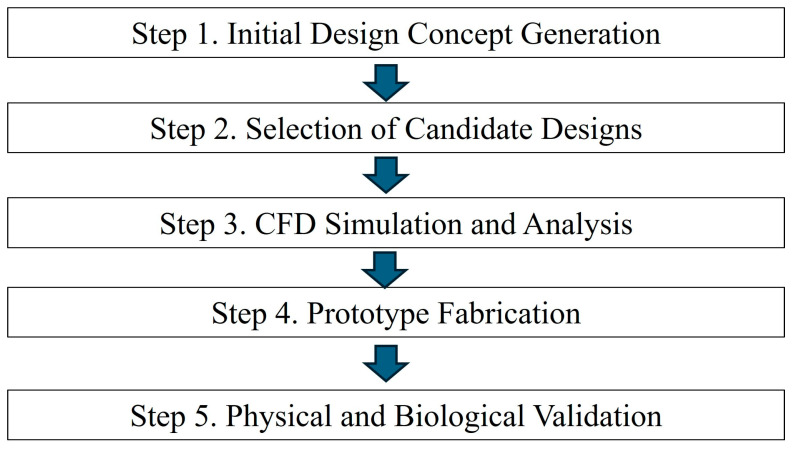
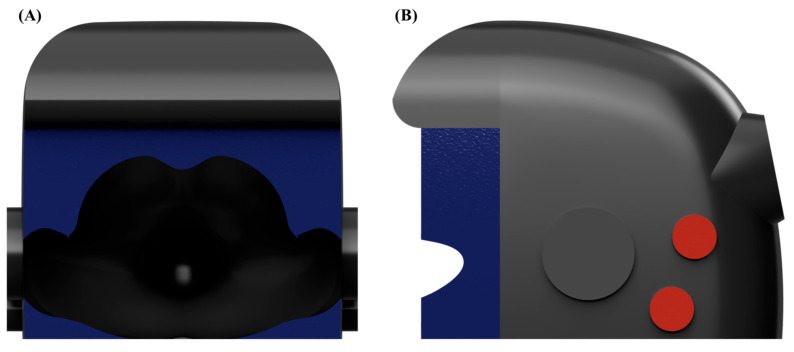
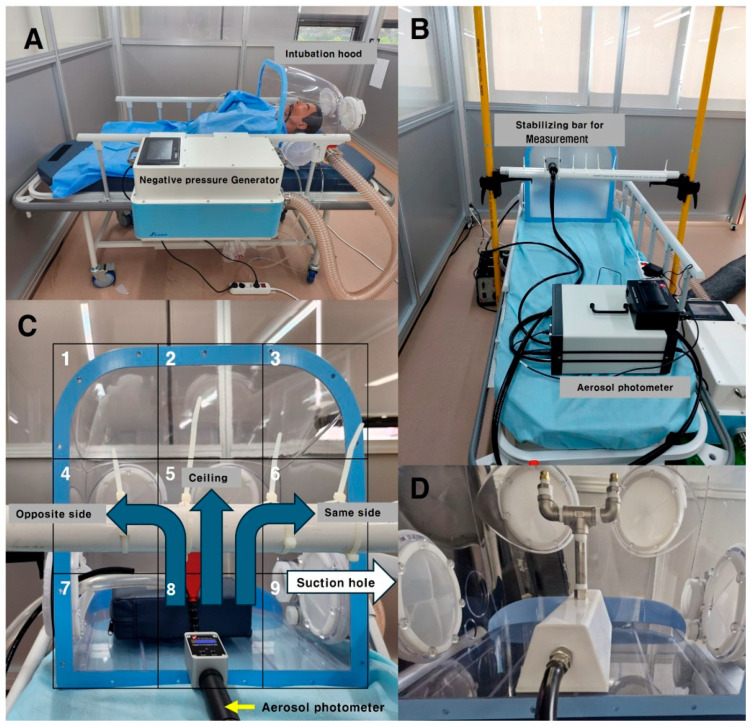
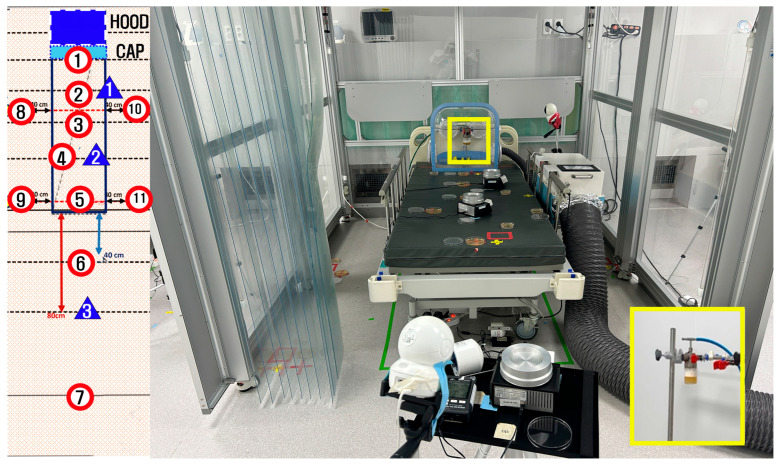
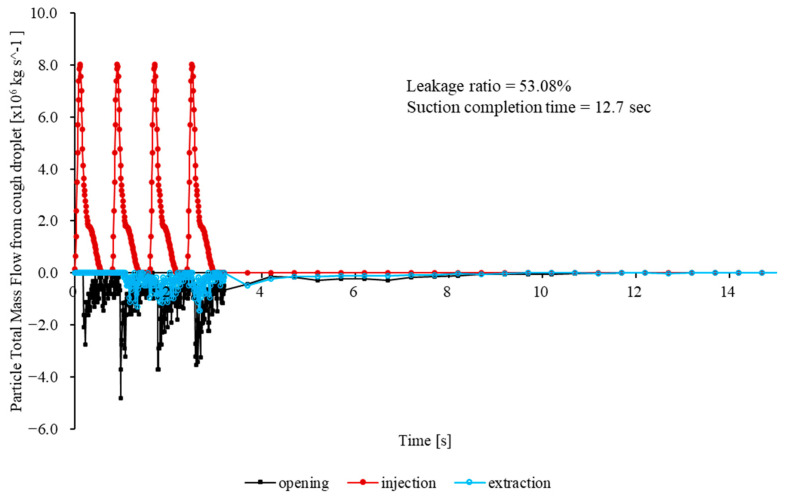
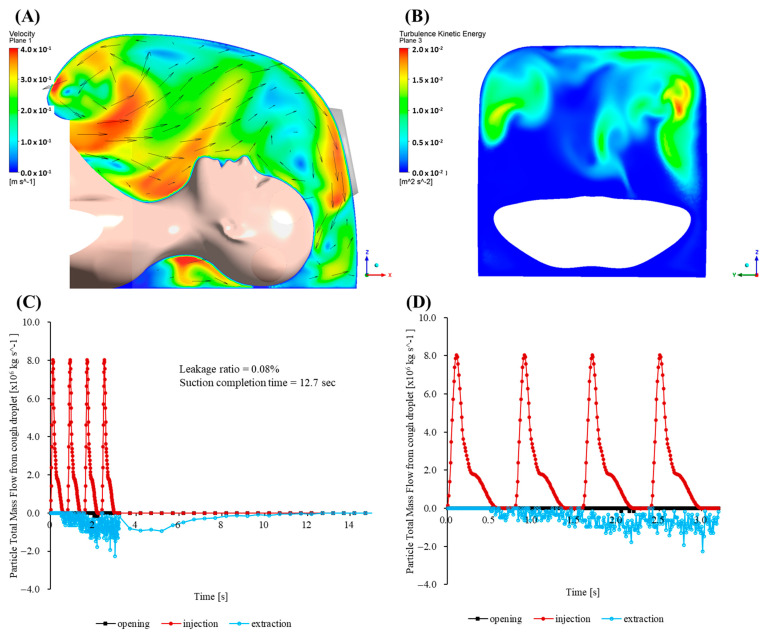
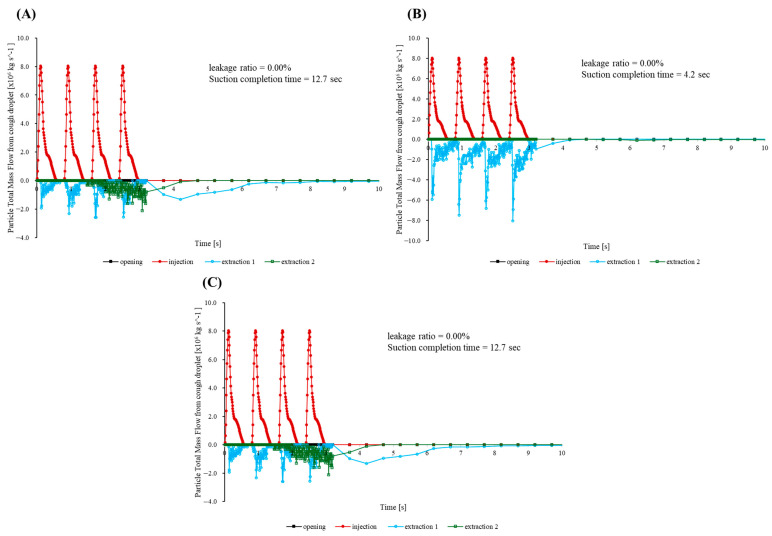
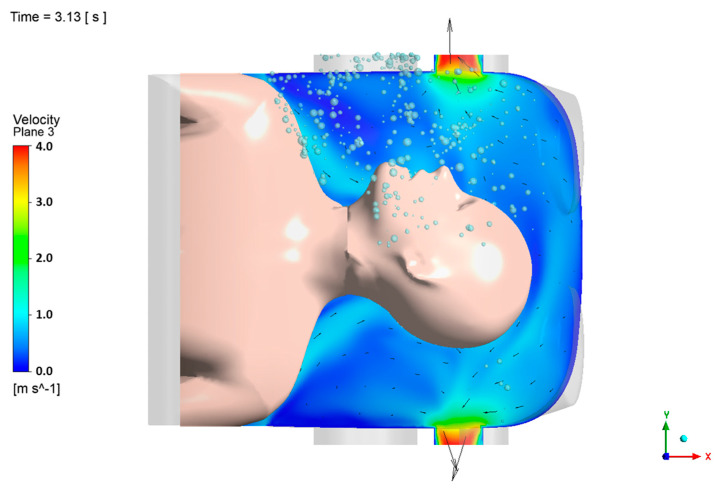
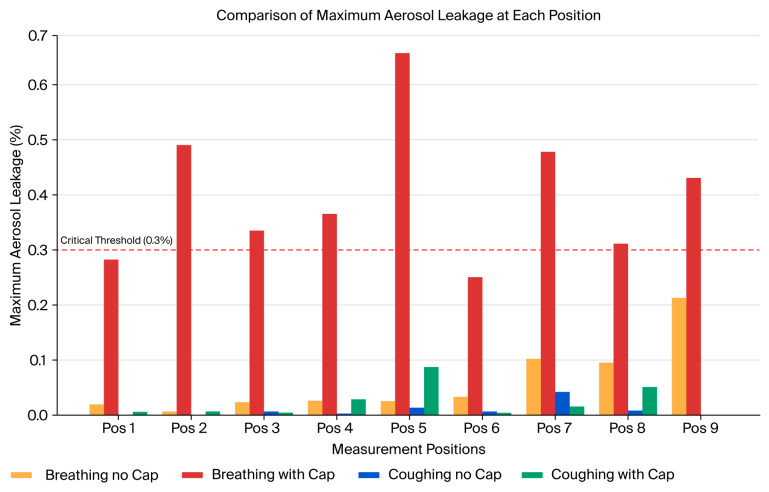
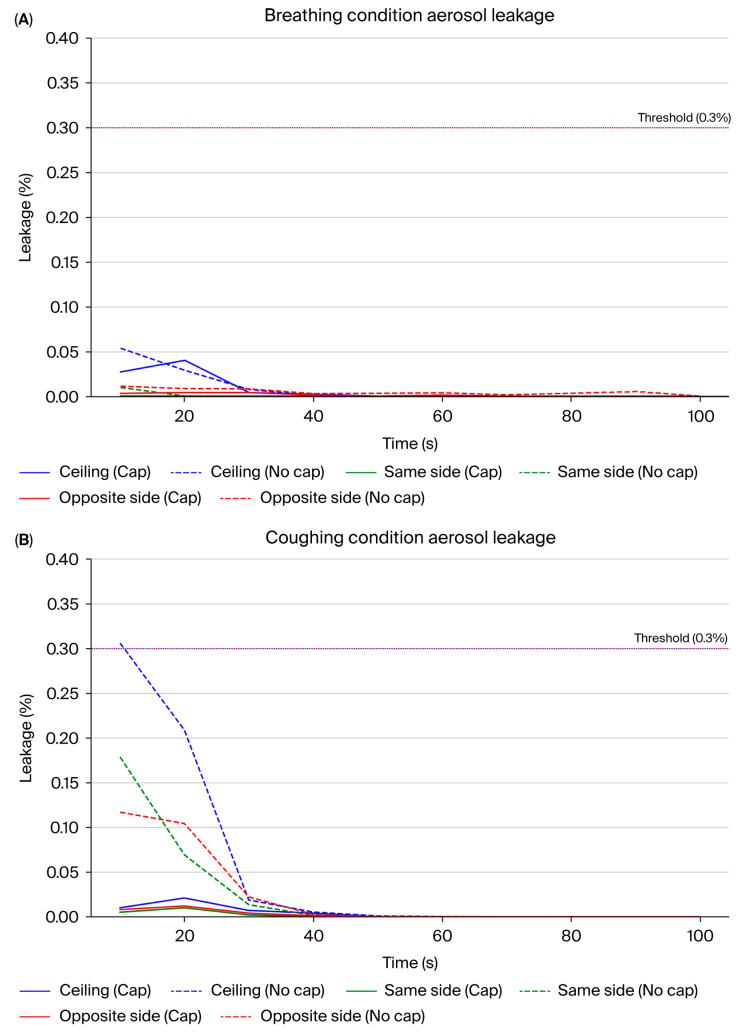
Healthcare providers performing aerosol-generating procedures (AGPs) face significant infection risks, emphasizing the critical need for effective aerosol containment systems. In this study, we developed and validated a negative pressure chamber enhanced with an innovative aerodynamic cap structure designed to optimize aerosol containment. Initially, computational fluid dynamics (CFD) simulations were performed to evaluate multiple structural improvement ideas, including air curtains, bidirectional suction, and aerodynamic cap structures. Among these, the aerodynamic cap was selected due to its superior predicted containment performance, practical feasibility, and cost-effectiveness. The CFD analyses employed realistic transient boundary conditions, precise turbulence modeling using the shear stress transport (SST) k-ω model, and detailed droplet evaporation dynamics under realistic humidity conditions. A full-scale prototype incorporating the selected aerodynamic cap was fabricated and evaluated using physical polyalphaolefin (PAO) particle leakage tests and biological aerosol validation with aerosolized Bacillus subtilis. For the physical leakage tests, the chamber opening was divided into nine sections, and the aerosol dispersion was tested in three distinct directions: ceiling-directed, toward the suction hole, and opposite the suction hole. These tests demonstrated significantly stabilized airflow and substantial reductions in aerosol leakage, consistently maintaining containment levels below the critical threshold of 0.3%, especially under transient coughing conditions. The biological aerosol experiments, conducted in a simulated emergency department environment, involved aerosolizing bacteria continuously for one hour. The results confirmed the effectiveness of the aerodynamic cap structure in achieving at least a one millionth (10-6) reduction in the aerosolized bacterial leakage compared to the control conditions. These findings highlight the importance and effectiveness of advanced CFD modeling methodologies in accurately predicting aerosol dispersion and improving containment strategies. Although further studies assessing the structural durability, long-term operational ease, and effectiveness against pathogenic microorganisms are required, the aerodynamic cap structure presents a promising, clinically practical infection control solution for widespread implementation during aerosol-generating medical procedures.

Keywords: aerosol transmission; computational fluid dynamics; intubation; respiratory infection.


Conflict of interest statement

Authors Kisub Sung and Jung-Woo Lee were employed by the company SS-ENG Co., Ltd. The funding sponsor, “The Ministry of Health and Welfare, Republic of Korea”, had no role in the design of the study; in the collection, analyses, or interpretation of data; in the writing of the manuscript; or in the decision to publish the results. The remaining authors declare that the research was conducted in the absence of any commercial or financial relationships that could be construed as a potential conflict of interest.

Figures

Figure 1
Figure 1
Overall validation flowchart.
Figure 2
Figure 2
Design of the negative pressure hood (A) and aerodynamic cap structure (B). (A) Design of the previously validated negative pressure hood [20]. (B) Newly introduced detachable aerodynamic cap structure designed to improve aerosol containment. (Left panel) Schematic design illustrating the structural integration of the cap (yellow line). (Right panel) Actual image of the installed aerodynamic cap structure on the negative pressure chamber.
Figure 3
Figure 3
Computational domain and boundary conditions for the CFD simulation. (A) Front view and (B) side view. Blue regions indicate the opening boundary conditions (relative pressure: 0 Pa), red region indicates the outlet (suction) boundary condition (relative pressure: −10 Pa), and dark gray regions indicate the wall boundary conditions with no-slip conditions applied.
Figure 4
Figure 4
(A) An example of an intubation hood and a negative pressure generator with a patient. (B) An aerosol photometer was used to measure the particle leakage from the intubation hood; a stabilizing bar was used to ensure consistent measurement locations for the detector. (C) The open area of the intubation hood was divided into nine sections (indicated by numbers 1–9), and the PAO particles were dispersed in three directions (indicated by blue arrows); the suction hole was located on the inside right lateral side of the intubation hood (indicated by white arrow). (D) The PAO aerosol was dispersed using an aerosol generator with a valve (developed in-house by our research team) [20].
Figure 5
Figure 5
Experimental setup for biological leakage testing using aerosolized Bacillus subtilis. The layout diagram (left) illustrates the positions used for bacterial sampling within the experimental room. The negative pressure chamber is represented by the blue rectangle labeled “Hood”, with the attached aerodynamic cap indicated by the adjacent light blue rectangle (“Cap”). Settling plates (red-circled numbers, positions 1–11) were strategically placed around the chamber to collect deposited bacteria, while airborne bacteria samples (blue triangles, positions 1–3) were collected using air samplers positioned at specific distances from the chamber. The photograph (right) shows the actual experimental arrangement, including the chamber, aerodynamic cap, settling plates, and air samplers. The inset image (yellow box) provides a close-up view of the nebulizer device used within the hood to aerosolize bacteria during the experiments. Air discharged from the negative pressure generator passed through a high-efficiency particulate air filter; however, to exclude potential contamination from any residual leakage through the filter, the filtered exhaust was guided outside the testing area using an external hose, as depicted in the main photograph.
Figure 6
Figure 6
Total particle mass flow rates at the mouth (red solid circles, injection), outlet (blue open circles, extraction), and opening (black solid squares, leakage) over 33.2 s for the baseline enclosure without the cap structure.
Figure 7
Figure 7
(A) Instantaneous velocity field for the cap-enhanced enclosure at t = 0.18 s. Colors indicate the velocity magnitude; vectors illustrate the downward deflection of the cough jet and the coherent inward flow that prevents outward leakage. (B) Map of the turbulent kinetic energy 5 mm inside the opening for the cap-enhanced enclosure, showing a spatially uniform low-intensity field (mean 3.1 × 10⁻³ m2/s2). (C) Particle total mass flow rate for the cap-enhanced enclosure: mouth injection (red solid circles), outlet extraction (blue open circles), and opening (black solid squares). (D) Particle total mass flow rate for the cap-enhanced enclosure (0–3 s).
Figure 8
Figure 8
Particle total mass flow rate during (A) bilateral suction, (B) suction that switches from front to rear, and (C) suction that switches from rear to front: mouth injection (red solid circles), outlet extraction 1 (blue open circles), outlet extraction 2 (green open squares), and opening (black solid squares).
Figure 9
Figure 9
Planar velocity field 5 mm above the enclosure floor for the bilateral suction case. Colors indicate the velocity magnitude; black vectors show a symmetric vortex pair that carries the cough jet downward and radially inward toward the cap throat, preventing outward recirculation.
Figure 10
Figure 10
Particle leakage over 90 s, measured at nine predefined sections around the chamber opening under breathing and coughing conditions, with or without the aerodynamic cap structure. All nine graphs collectively represent the entire open area of the hood, and each number indicates the corresponding location among the nine measurement positions previously illustrated in Figure 4C. (A) Breathing condition without aerodynamic cap. (B) Breathing condition with aerodynamic cap showing aerosol dispersion toward the ceiling (blue), suction (purple), and suction side (green). (C) Coughing without aerodynamic cap. (D) Coughing with aerodynamic cap showing aerosol dispersion toward the ceiling (sky blue) [20].
Figure 11
Figure 11
A summary and direct comparison of the maximum aerosol leakage levels recorded at each position across all the experimental conditions. Comparison of the maximum aerosol leakage measured at each of the nine designated positions within the chamber under four testing scenarios: breathing without cap, coughing without cap, breathing with cap, and coughing with cap. The red dashed line indicates the critical leakage threshold of 0.3%. Coughing without the cap notably exceeded this threshold, whereas breathing and coughing scenarios with the cap effectively maintained aerosol leakage below the critical limit, demonstrating enhanced aerosol containment.
Figure 12
Figure 12
PAO particle leakage comparison with and without the aerodynamic cap structure. The particle leakage rates (mean ± standard deviation) measured over 100 s are shown under breathing (A) and coughing (B) conditions. The measurements are further divided based on the leakage directions: ceiling (blue), same side as suction (green), and the opposite side to suction (red). Solid lines represent the leakage rates with the cap structure installed, whereas dashed lines represent the leakage rates without the cap. The horizontal purple dashed line represents the predefined critical threshold of 0.3% aerosol leakage. The results clearly show the efficacy of the cap in reducing both the mean leakage rates and their variability, which is especially notable under coughing conditions, confirming the significant improvement in aerosol containment capability provided by the aerodynamic cap.

Similar articles

References

    1. World Health Organization . Infection Prevention and Control During Health Care When Coronavirus Disease (COVID-19) Is Suspected or Confirmed. WHO; Geneva, Switzerland: 2021.
    1. Tran K., Cimon K., Severn M., Pessoa-Silva C.L., Conly J. Aerosol generating procedures and risk of transmission of acute respiratory infections to healthcare workers: A systematic review. PLoS ONE. 2012;7:e35797. doi: 10.1371/journal.pone.0035797. - DOI - PMC - PubMed
    1. Centers for Disease Control and Prevention . Prevention Interim Infection Prevention and Control Recommendations for Healthcare Personnel During the Coronavirus Disease 2019 (COVID-19) Pandemic. Centers for Disease Control and Prevention; Atlanta, GA, USA: 2022.
    1. Turer D.M., Good C.H., Schilling B.K., Turer R.W., Karlowsky N.R., Dvoracek L.A., Ban H., Chang J.S., Rubin J.P. Improved Testing and Design of Intubation Boxes During COVID-19 Pandemic. Ann. Emerg. Med. 2021;77:1–10. doi: 10.1016/j.annemergmed.2020.08.033. - DOI - PMC - PubMed
    1. Canelli R., Connor C.W., Gonzalez M., Nozari A., Ortega R. Barrier enclosure during endotracheal intubation. N. Engl. J. Med. 2020;382:1957–1958. doi: 10.1056/NEJMc2007589. - DOI - PMC - PubMed

LinkOut - more resources