

Non-Invasive Screening for Early Cognitive Impairment in Elderly Hyperuricaemic Men Using Transcranial Colour-Coded Duplex Sonography
- PMID: 40564841
- PMCID: PMC12192234
- DOI: 10.3390/diagnostics15121519
Non-Invasive Screening for Early Cognitive Impairment in Elderly Hyperuricaemic Men Using Transcranial Colour-Coded Duplex Sonography
Abstract
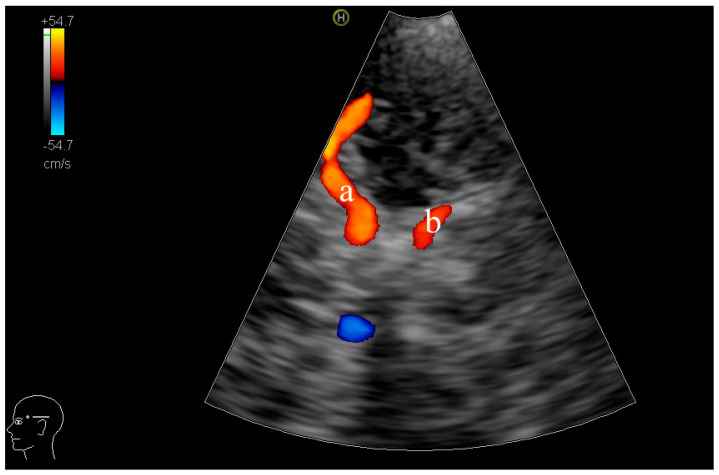
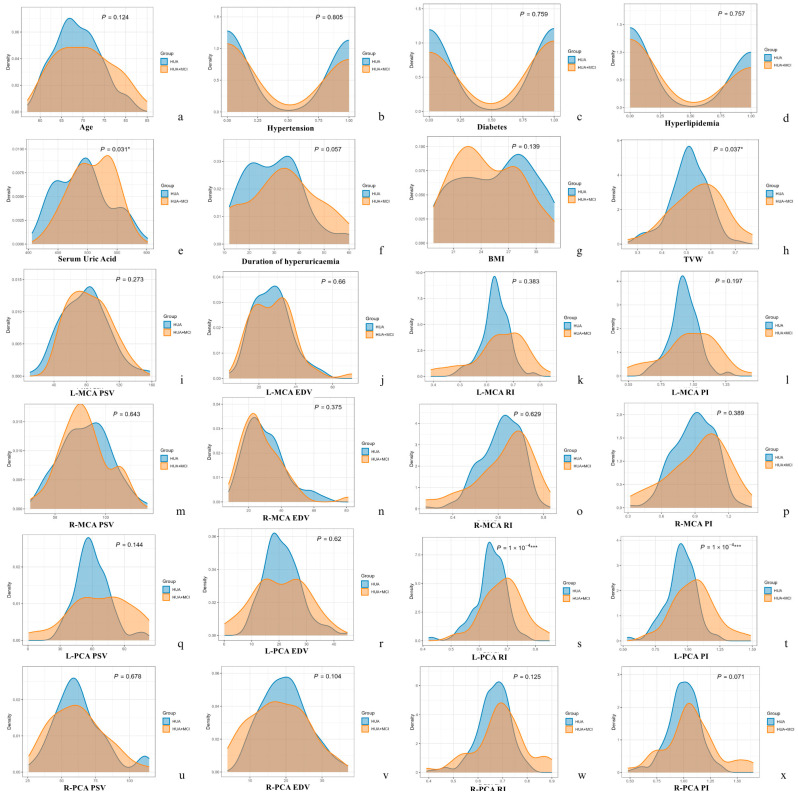
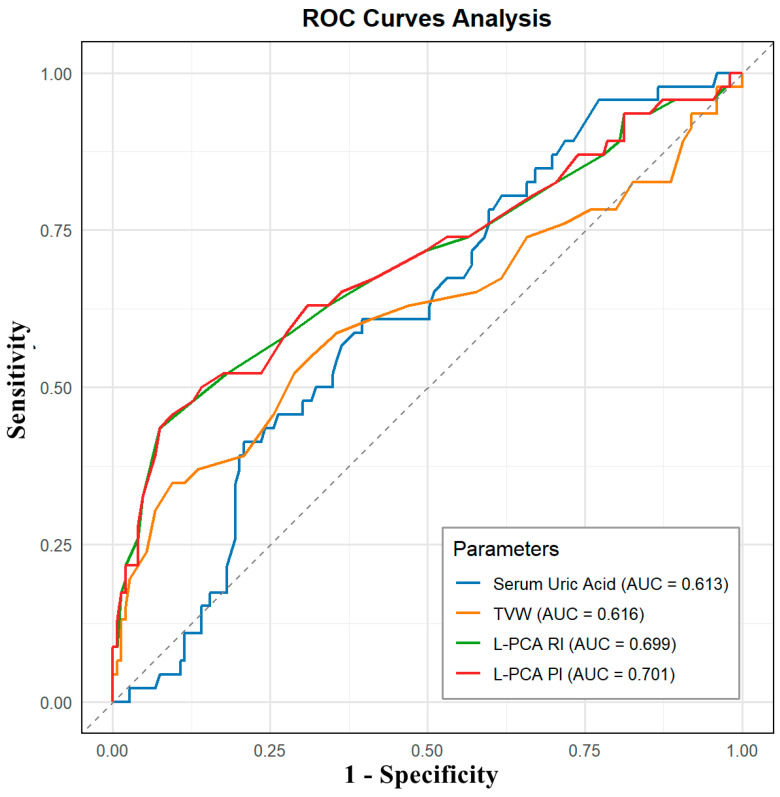
Objectives: Hyperuricaemia has been linked to cognitive decline, yet cerebral structural and haemodynamic changes in this population remain poorly defined. We evaluated transcranial colour-coded duplex (TCCD) sonography as a non-invasive screening tool for early mild cognitive impairment (MCI) in elderly hyperuricaemic men. Methods: In this cross-sectional study, 195 men aged ≥ 60 years with hyperuricaemia were stratified by the Montreal Cognitive Assessment (MoCA) into HUA + MCI (MoCA < 26, n = 46) and HUA (MoCA ≥ 26, n = 149) groups. TCCD measured third-ventricle width (TVW) and peak systolic/end-diastolic velocities to calculate resistive (RI) and pulsatility (PI) indices in the middle (MCA) and posterior (PCA) cerebral arteries. Serum uric acid was recorded. Kernel density plots and receiver operating characteristic (ROC) curves assessed diagnostic performance. Results: The HUA + MCI group exhibited higher serum uric acid (508.5 ± 36.3 vs. 492.9 ± 44.0 µmol/L; p = 0.031), greater TVW (0.55 ± 0.11 vs. 0.51 ± 0.08 cm; p = 0.037), and elevated left PCA RI (0.69 ± 0.07 vs. 0.64 ± 0.06) and PI (1.05 ± 0.17 vs. 0.95 ± 0.12; both p < 0.001). ROC analysis identified left PCA PI as the most specific marker (AUC = 0.701; specificity 90.6%; sensitivity 45.7%). Kernel density plots confirmed distinct distributions of key parameters. Conclusions: TCCD-detected ventricular enlargement and raised PCA pulsatility accurately distinguish MCI among hyperuricaemic men. As a non-invasive, accessible technique with high specificity, TCCD may complement MRI and cognitive testing in early screening of at-risk populations.
Keywords: cerebral haemodynamics; hyperuricaemia; mild cognitive impairment; third ventricle width; transcranial colour-coded duplex.
Conflict of interest statement
The authors declare no conflicts of interest.
Figures
Similar articles
-
Predicting cognitive decline: Deep-learning reveals subtle brain changes in pre-MCI stage.J Prev Alzheimers Dis. 2025 May;12(5):100079. doi: 10.1016/j.tjpad.2025.100079. Epub 2025 Feb 6. J Prev Alzheimers Dis. 2025. PMID: 39920001 Free PMC article.
-
CSF tau and the CSF tau/ABeta ratio for the diagnosis of Alzheimer's disease dementia and other dementias in people with mild cognitive impairment (MCI).Cochrane Database Syst Rev. 2017 Mar 22;3(3):CD010803. doi: 10.1002/14651858.CD010803.pub2. Cochrane Database Syst Rev. 2017. PMID: 28328043 Free PMC article.
-
Signs and symptoms to determine if a patient presenting in primary care or hospital outpatient settings has COVID-19.Cochrane Database Syst Rev. 2022 May 20;5(5):CD013665. doi: 10.1002/14651858.CD013665.pub3. Cochrane Database Syst Rev. 2022. PMID: 35593186 Free PMC article.
-
18F PET with flutemetamol for the early diagnosis of Alzheimer's disease dementia and other dementias in people with mild cognitive impairment (MCI).Cochrane Database Syst Rev. 2017 Nov 22;11(11):CD012884. doi: 10.1002/14651858.CD012884. Cochrane Database Syst Rev. 2017. PMID: 29164602 Free PMC article.
-
18F PET with florbetapir for the early diagnosis of Alzheimer's disease dementia and other dementias in people with mild cognitive impairment (MCI).Cochrane Database Syst Rev. 2017 Nov 22;11(11):CD012216. doi: 10.1002/14651858.CD012216.pub2. Cochrane Database Syst Rev. 2017. PMID: 29164603 Free PMC article.
References
-
- Chen C., Li X., Lv Y., Yin Z., Zhao F., Liu Y., Li C., Ji S., Zhou J., Wei Y., et al. High Blood Uric Acid Is Associated with Reduced Risks of Mild Cognitive Impairment Among Older Adults in China: A 9-Year Prospective Cohort Study. Front. Aging Neurosci. 2021;13:747686. doi: 10.3389/fnagi.2021.747686. - DOI - PMC - PubMed
Grants and funding
LinkOut - more resources
Full Text Sources
Research Materials
Miscellaneous
