. 2025 Jun 6;26(12):5431.
doi: 10.3390/ijms26125431.

Assessment of White Matter Changes Using Quantitative T1ρ Mapping in an Open-Field Low-Intensity Blast Mouse Model of Mild Traumatic Brain Injury (mTBI)

Affiliations

Assessment of White Matter Changes Using Quantitative T1ρ Mapping in an Open-Field Low-Intensity Blast Mouse Model of Mild Traumatic Brain Injury (mTBI)

Dina Moazamian et al. Int J Mol Sci. .

Abstract

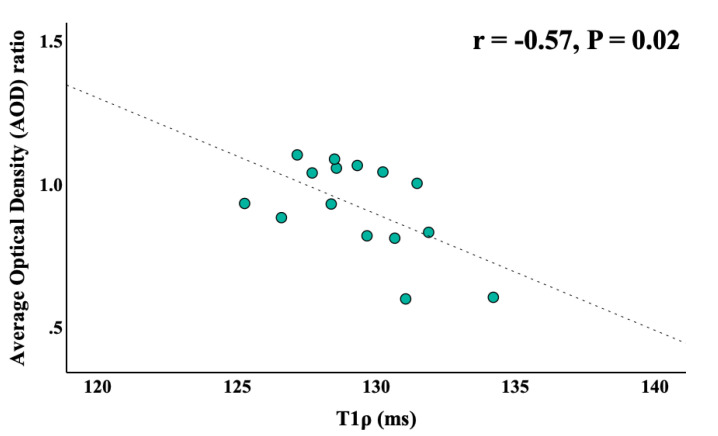
Blast-induced mild traumatic brain injury (mTBI) occurs when shock waves travel through blood vessels and cerebrospinal fluid, leading to cerebral demyelination, which results in cognitive impairments and neuropsychiatric issues that impact quality of life. This study aims to evaluate myelin changes in white matter in mice with mTBI induced by an open-field low-intensity blast (LIB) using a newly implemented 3D adiabatic T1ρ prepared fast spin echo (Adiab-T1ρ-FSE) sequence for quantitative T1ρ MRI mapping. Thirty male C57BL/6 mice, including 15 mTBI and 15 sham controls, were scanned on a 3T Bruker MRI scanner. Luxol fast blue (LFB) staining was performed to assess myelin content differences between the mTBI and sham control groups. A significantly higher T1ρ value in the medial corpus callosum (MCC) was found in mTBI mice compared to controls (126.8 ± 2.5 ms vs. 129.8 ± 2.5 ms; p < 0.001), consistent with the reduced myelin observed in LFB staining (0.80 ± 0.14 vs. 1.02 ± 0.06; p = 0.004). Moreover, a significant negative correlation between T1ρ and histological myelin content measurements was observed (r = -0.57, p = 0.02). Our findings demonstrate that T1ρ is a promising biomarker for detecting mTBI-associated demyelination in the brain.

Keywords: MRI; T1ρ; mTBI; myelin loss; open-field LIB.


Conflict of interest statement

There are no conflicts of interest to declare.

Figures

Figure 1
Figure 1
Representative T1ρ fitting curves (A,D) and pixel-wise T1ρ maps (B,E) as well as corresponding clinical T2-weighted fast spin echo (T2w-FSE) images (C,F) for an 8-week-old male sham control mouse (first row) and an mTBI mouse (second row). T2w-FSE images show no visible differences between sham control and mTBI mice. In contrast, the mTBI mouse exhibited a higher T1ρ value in the MCC compared to the sham control mouse (133.7 ± 7.4 ms vs. 122.0 ± 9.0 ms). MCC—medial corpus callosum; mTBI—mild traumatic brain injury; T2w-FSE—T2-weighted fast spin echo.
Figure 2
Figure 2
Bar-dot plot of T1ρ measurements comparing sham and mTBI groups. The mTBI group showed significantly higher T1ρ values than the sham group (129.8 ± 2.5 vs. 126.8 ± 2.5, p < 0.001, respectively). The edges of the box indicate the first and third IQR percentiles, respectively. mTBI—mild traumatic brain injury; IQR—interquartile range.
Figure 3
Figure 3
Representative brain LFB staining from a sham control mouse (A) and an mTBI mouse (B), along with a bar-dot plot of the AOD ratio measurements (C) in the MCC region for the sham and mTBI groups. The average AOD ratio in the MCC was significantly lower in mTBI mice compared to the sham group (0.80 ± 0.14 vs. 1.02 ± 0.06; p = 0.004) (C). The edges of the bar-dot plot box represent the first and third quartiles (IQR), respectively. LFB—Luxol Fast Blue; AOD—average optical density; MCC—middle corpus callosum, IQR—interquartile range.
Figure 4
Figure 4
Correlation between T1ρ and AOD ratio measurements in eight sham controls and seven mTBI mice. A significant negative correlation was observed in the MCC region (r = −0.57, p = 0.02). LFB—Luxol Fast Blue; AOD—average optical density; MCC—middle corpus callosum.
Figure 5
Figure 5
Experimental setup for the murine model of mTBI induced by open-field LIB exposure: (A) 350 g of C4 explosive placed 1 m above the ground and 3 m from the anesthetized mice, with the mice also positioned at 1 m in height. (B) Flush-mounted pressure sensor to measure head-on pressure. (C) Pencil probes to measure side-on pressure, with the mice housed in wire mesh to allow for unimpeded shock wave propagation. mTBI—mild traumatic brain injury; LIB—low-intensity blast.
Figure 6
Figure 6
Diagram of the 3D Adiab-T1ρ-FSE sequence. Following a train of AFP pulses, a 3D FSE sequence is employed for rapid data acquisition. The AFP pulses lock the magnetization vector into a rotated frame, generating T1ρ contrast. 3D—three dimensional; FSE—fast spin echo; AFP—adiabatic full passage; TSL—time-of-spin-lock; TR—repetition time.

Similar articles

References

    1. Tovar M.A., Bell R.S., Neal C.J. Epidemiology of Blast Neurotrauma: A Meta-Analysis of Blast Injury Patterns in the Military and Civilian Populations. World Neurosurg. 2021;146:308–314.e3. doi: 10.1016/j.wneu.2020.11.093. - DOI - PubMed
    1. Mahoney S.O., Chowdhury N.F., Ngo V., Imms P., Irimia A. Mild Traumatic Brain Injury Results in Significant and Lasting Cortical Demyelination. Front. Neurol. 2022;13:854396. doi: 10.3389/fneur.2022.854396. - DOI - PMC - PubMed
    1. Walz W. Traumatic Brain Injury. Springer; Berlin/Heidelberg, Germany: 2024. - DOI
    1. National Academies of Sciences, Engineering, and Medicine. Board on Health Care Services. Committee on the Review of the Department of Veterans Affairs Examinations for Traumatic Brain Injury . Diagnosis and Assessment of Traumatic Brain Injury. National Academies Press; Washington, DC, USA: 2019.
    1. Irimia A., Van Horn J.D. Functional Neuroimaging of Traumatic Brain Injury: Advances and Clinical Utility. Neuropsychiatr. Dis. Treat. 2015;11:2355–2365. doi: 10.2147/NDT.S79174. - DOI - PMC - PubMed

LinkOut - more resources