. 2025 Jun 6;26(12):5450.
doi: 10.3390/ijms26125450.

Fecal Microbiota Transplantation from Mice Receiving Magnetic Mitohormesis Treatment Reverses High-Fat Diet-Induced Metabolic and Osteogenic Dysfunction

Affiliations

Fecal Microbiota Transplantation from Mice Receiving Magnetic Mitohormesis Treatment Reverses High-Fat Diet-Induced Metabolic and Osteogenic Dysfunction

Jun Kit Craig Wong et al. Int J Mol Sci. .

Abstract

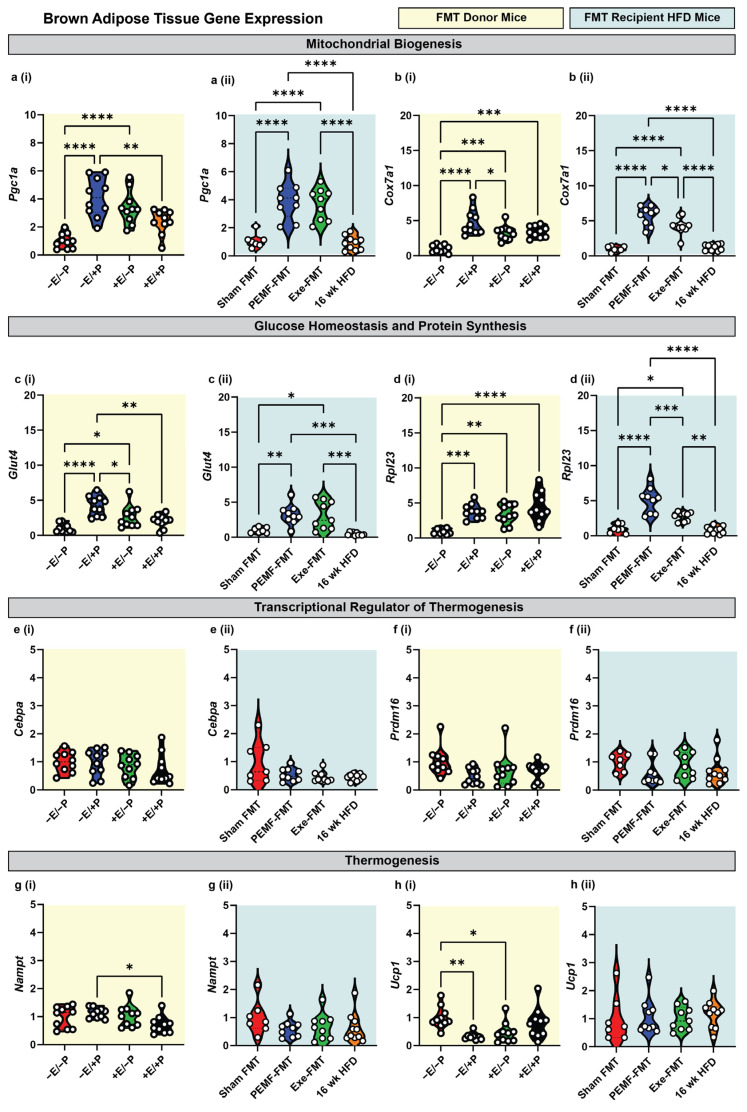
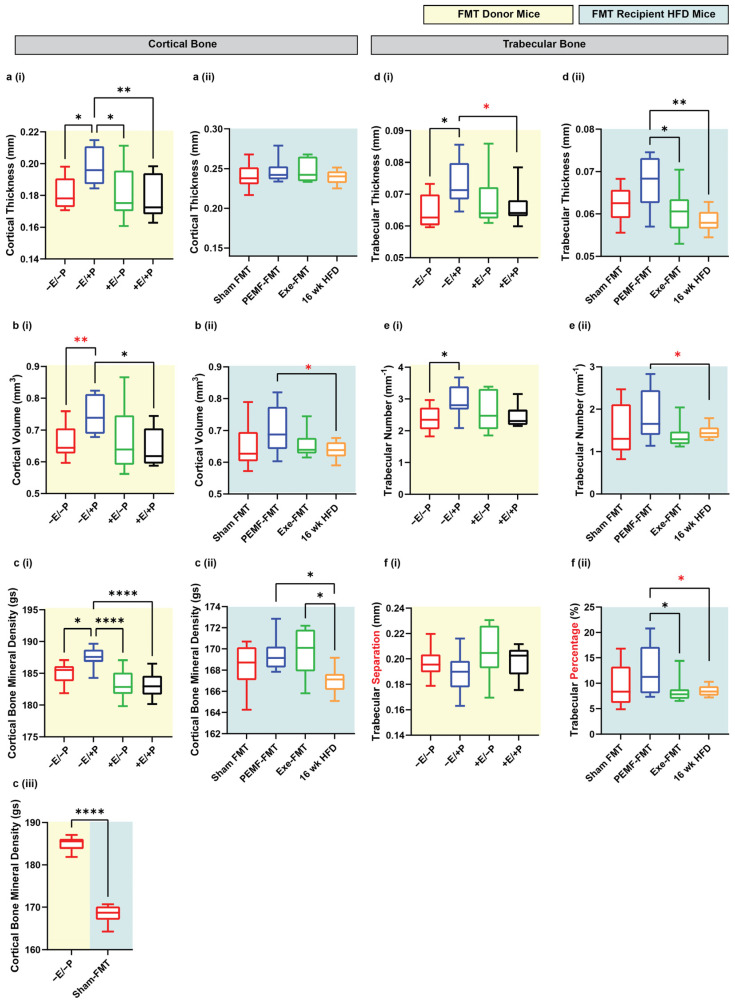
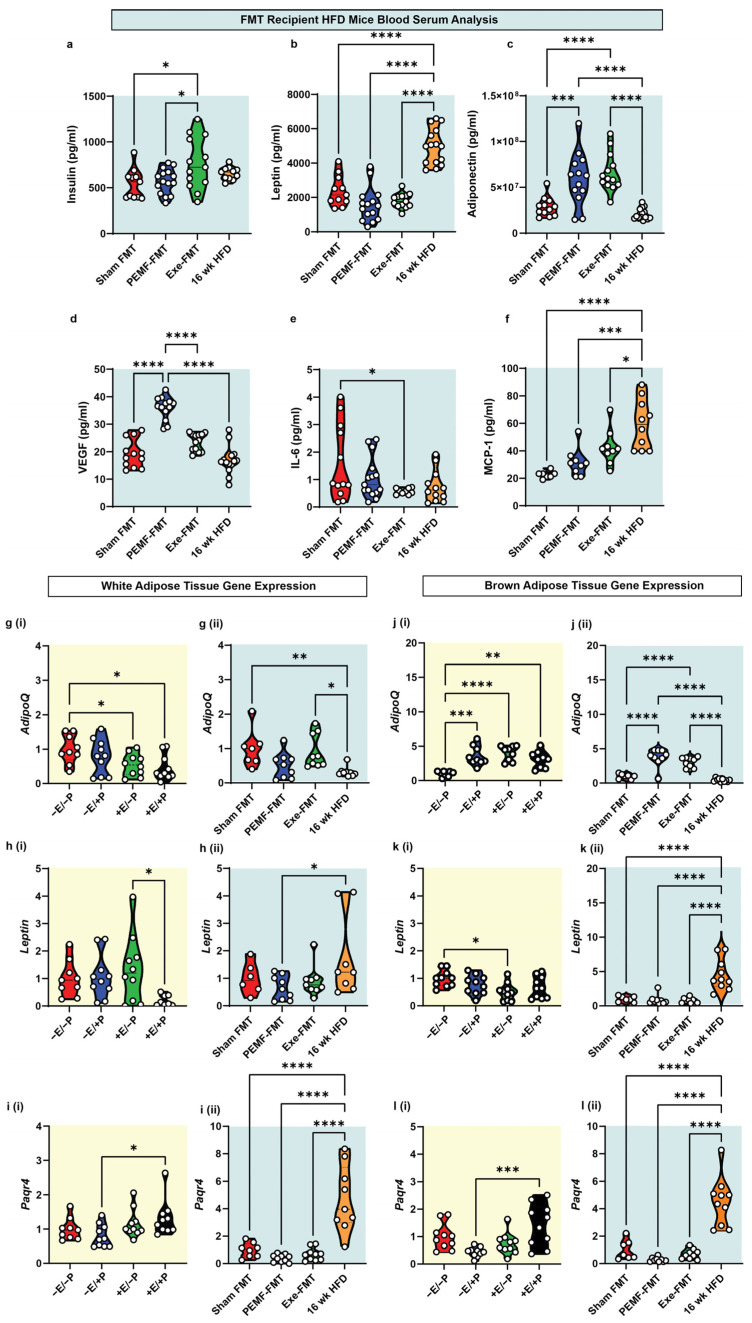
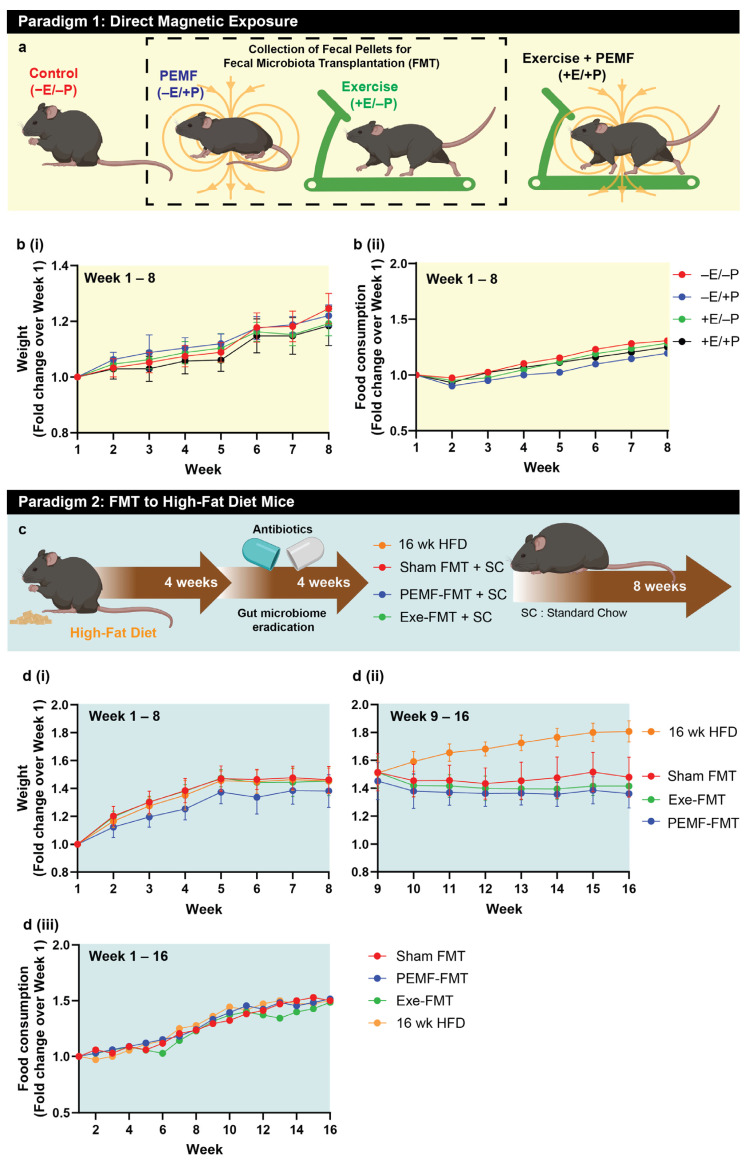
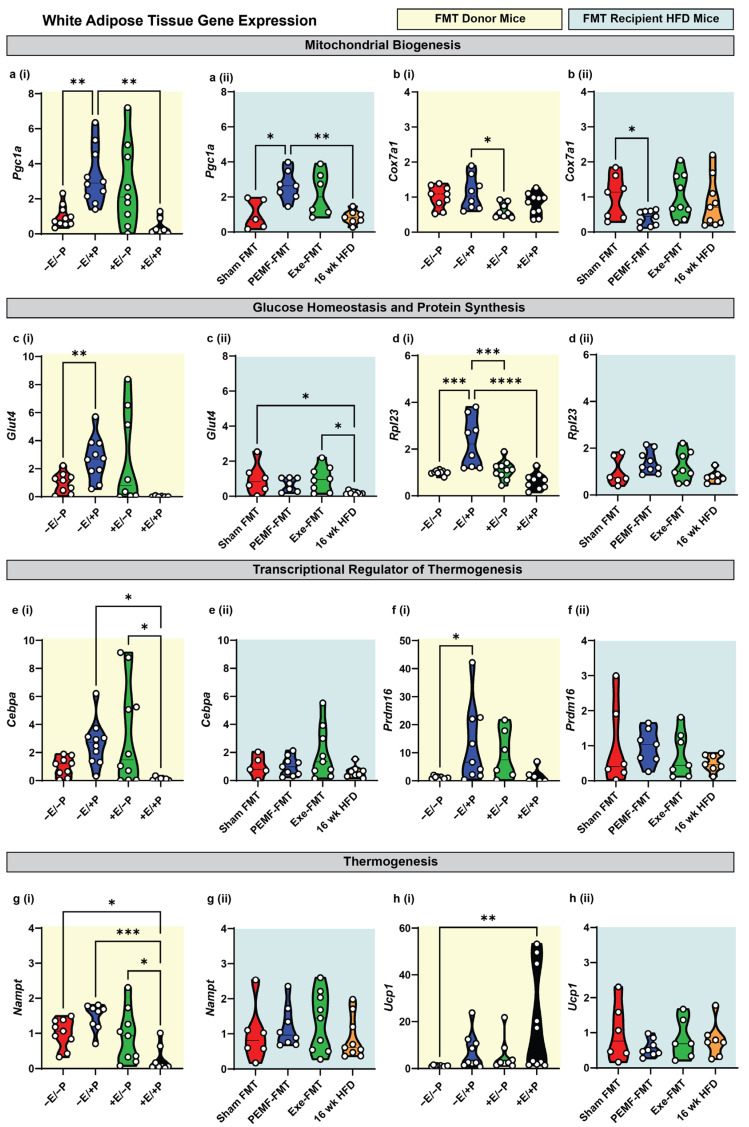
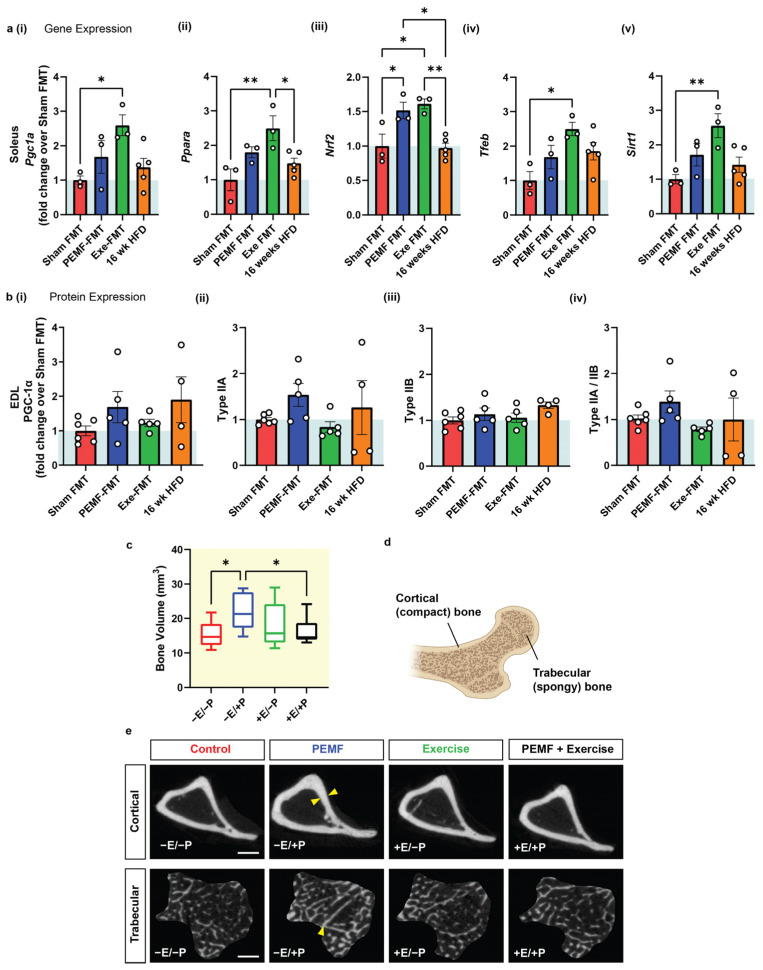
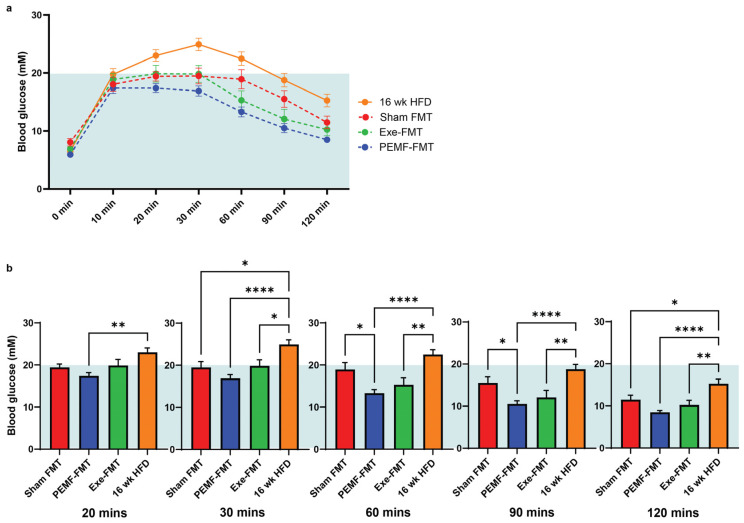
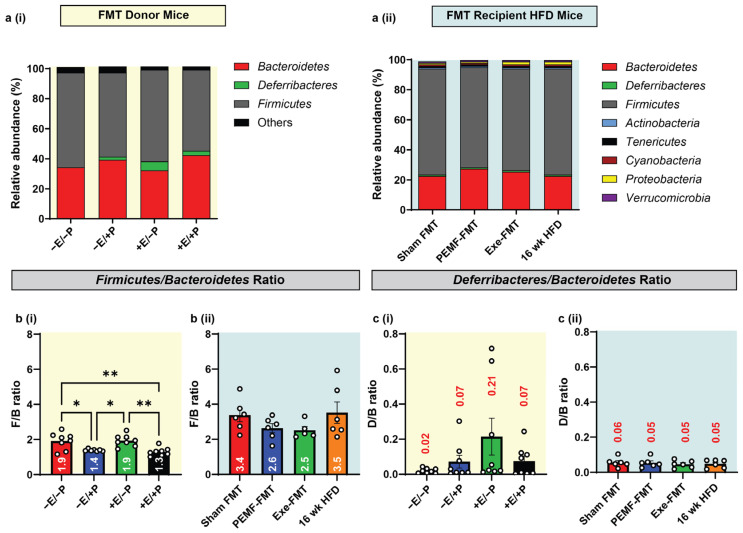
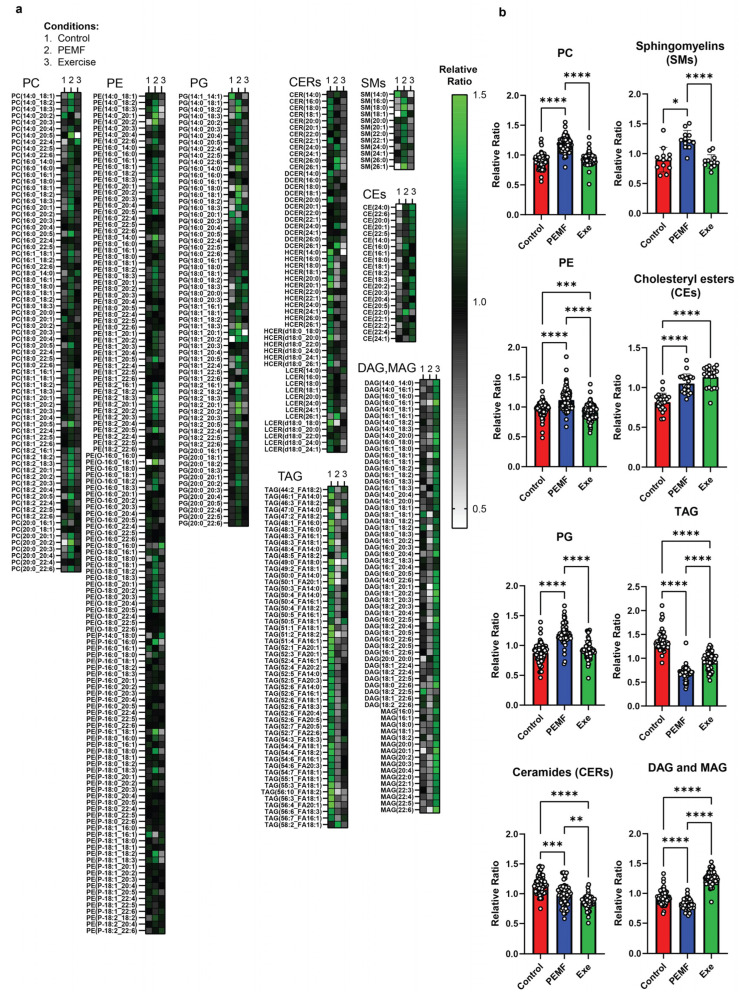
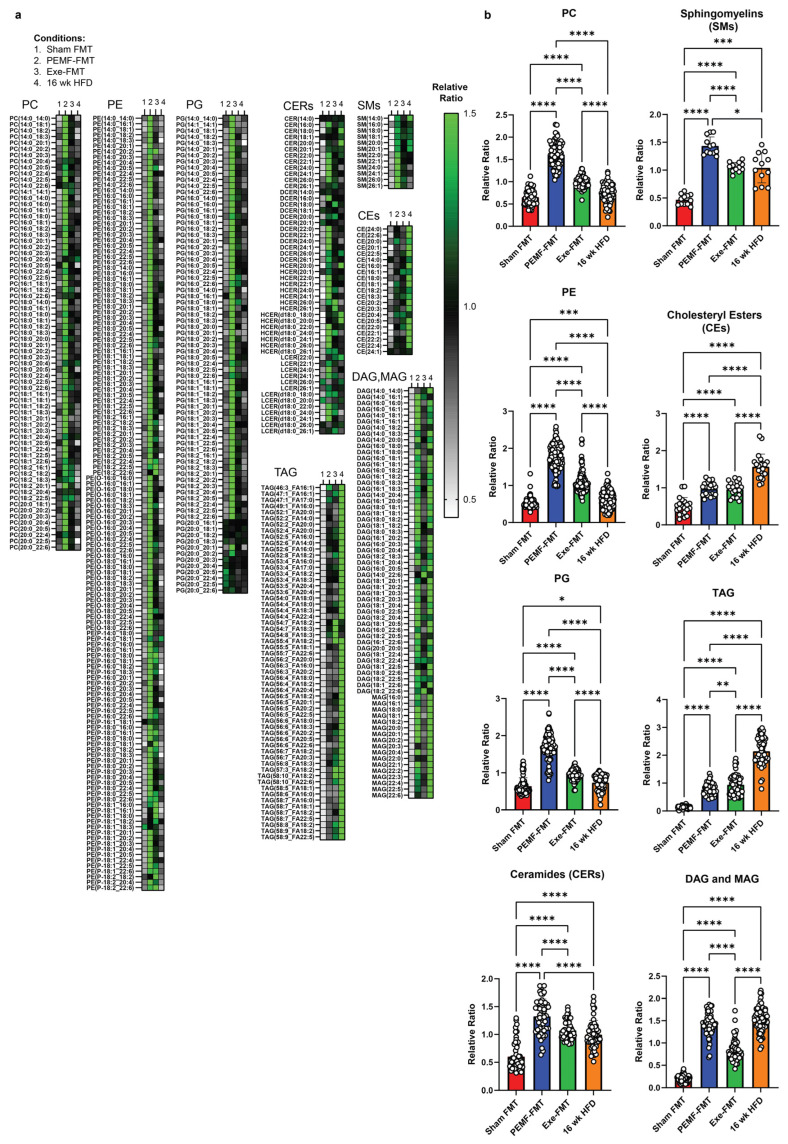
This study compared the metabolic consequences of fecal microbiota transplantation (FMT) from donor mice that had been either administered pulsed electromagnetic field (PEMF) therapy or exercised to recipient mice fed a high-fat diet (HFD). Eight weeks of PEMF treatment (10 min/week) enhanced PGC-1α-associated mitochondrial and metabolic gene expression in white and brown adipose to a greater degree than eight weeks of exercise (30-40 min/week). FMT from PEMF-treated donor mice recapitulated these adipogenic adaptations in HFD-fed recipient mice more faithfully than FMT from exercised donors. Direct PEMF treatment altered hepatic phospholipid composition, reducing long-chain ceramides (C16:0) and increasing very long-chain ceramides (C24:0), which could be transferred to PEMF-FMT recipient mice. FMT from PEMF-treated mice was also more effective at recovering glucose tolerance than FMT from exercised mice. PEMF treatment also enhanced bone density in both donor and HFD recipient mice. The gut Firmicutes/Bacteroidetes (F/B) ratio was lowest in both the directly PEMF-exposed and PEMF-FMT recipient mouse groups, consistent with a leaner phenotype. PEMF treatment, either directly applied or via FMT, enhanced adipose thermogenesis, ceramide levels, bone density, hepatic lipids, F/B ratio, and inflammatory blood biomarkers more than exercise. PEMF therapy may represent a non-invasive and non-strenuous method to ameliorate metabolic disorders.

Keywords: PEMF therapy; ceramides; gut microbiome; non-alcoholic fatty liver disease (NAFLD); non-alcoholic steatohepatitis (NASH); obesity; osteogenesis.


Conflict of interest statement

A.F.O. is an inventor of patent WO 2019/17863 A1, System and Method for Applying Pulsed Electromagnetic Fields, and is a co-founder of QuantumTx Pte. Ltd. Other authors declare that they do not have competing interests.

Figures

Figure 3
Figure 3
Modulation of metabolic genes in brown adipose tissue of donor and FMT recipient HFD mice. Gene expression analysis 2(−ΔΔCT) of mitochondrial biogenesis markers: (a) Pgc1a and (b) Cox7a1; glucose homeostasis/protein synthesis markers: (c) Glut4 and (d) Rpl23; transcriptional regulators of thermogenesis: (e) Cebpa and (f) Prdm16; and thermogenesis effectors: (g) Nampt and (h) Ucp1. Yellow backgrounds (i) indicate FMT donors (paradigm 1; E = exercise; P = PEMF) and light blue backgrounds (ii) indicate FMT recipients (paradigm 2; Exe = exercise). Each white dot within the violin plots represents an individual animal. Statistical significance was determined by a one-way ANOVA with Sidak’s post hoc test (* p < 0.05, ** p < 0.01, *** p < 0.001, and **** p < 0.0001).
Figure 5
Figure 5
Changes in bone indices in FMT donor and recipient HFD mice. Cortical and trabecular tibial indices were analyzed in (i) FMT donor mice (yellow background) and (ii) FMT recipient HFD mice (light blue background). Parameters included the following: (a) cortical thickness (mm), (b) cortical volume (mm3), (c) cortical BMD (g/cm3), (d) trabecular thickness (mm), (e) trabecular number (/mm), and (f) either (i) trabecular separation (mm) for donors or (ii) trabecular percentage (%) for recipients. (c) (iii) Comparison between donor (−E/−P) and Sham FMT recipient mice from panels (c) (i,ii), highlighting differences in cortical BMD. Data represents n = 8–10 mice per group. All analyses were performed using a one-way ANOVA with Sidak’s multiple comparisons test (* p < 0.05, ** p < 0.01, and **** p < 0.0001). Red asterisks denote significant inter-group differences determined by Student’s t-tests (* p < 0.05, ** p < 0.01). E = exercise and P = PEMF.
Figure 6
Figure 6
Adipokine and adipokine-related gene expression. Violin plots showing the absolute abundance of (a) insulin, (b) leptin, (c) adiponectin, (d) VEGF-A, (e) IL-6 (multiplex), and (f) MCP-1 (ELISA) from the blood plasma of recipient mice. WAT gene expression of (g) AdipoQ, (h) Leptin, and (i) Paqr4 of (i) FMT donor and (ii) FMT recipient mice. BAT gene expression of (j) AdipoQ, (k) Leptin, and (l) Paqr4 of (i) FMT donor and (ii) FMT recipient mice. The white dots in the violin plots represent individual animals of n = 6–10 per group. Statistical analysis was determined by a one-way ANOVA with Sidak’s multiple comparisons tests (* p < 0.05, ** p < 0.01, *** p < 0.001, and **** p < 0.0001). (E = exercise; P = PEMF).
Figure 1
Figure 1
Study design and workflow. (a) Paradigm 1 consisted of C57BL/6 mice undertaking 8-week interventions including the following: red—no treatment (−E/−P); blue—PEMF exposure (−E/+P; 1.5 mT for 10 min weekly); green—exercise (+E/−P; twice weekly); or black—combined treatments (+E/+P). Fecal/cecal samples were collected from PEMF and exercise groups for subsequent fecal microbiota transplantation (FMT). Line graphs from the mice of paradigm 1 showing weight gain (b(i)) and food consumption (b(ii)) as a fold change from baseline (n = 10 mice per group). (c) Paradigm 2 involved recipient mice being fed a high-fat diet (HFD) for 8 weeks (including 4 weeks of antibiotics) before receiving twice-weekly oral gavages of donor microbiota (PEMF-FMT (n = 15) or Exe-FMT (n = 13)) or saline (Sham FMT (n = 12)) for 8 weeks on standard chow. One group of mice was maintained on the HFD during the FMT intervention period (n = 15). (d) Body weight changes in recipient and mice maintained on HFD (i) before and (ii) after commencement of FMT. All weight changes are given as fold change relative to week 1. (iii) Line graph shows the food consumption of mice in paradigm 2 over 16 weeks.
Figure 2
Figure 2
Modulation of metabolic genes in white adipose tissue of donor and FMT recipient HFD mice. Gene expression analysis 2(−ΔΔCT) of mitochondrial biogenesis markers: (a) Pgc1a and (b) Cox7a1; glucose homeostasis/protein synthesis markers: (c) Glut4 and (d) Rpl23; transcriptional regulators of thermogenesis: (e) Cebpa and (f) Prdm16; and thermogenesis effectors: (g) Nampt and (h) Ucp1. Yellow backgrounds (i) indicate FMT donors (paradigm 1; E = exercise; P = PEMF) and light blue backgrounds (ii) indicate FMT recipients (paradigm 2; Exe = exercise). Each white dot within the violin plots represents an individual animal. Statistical significance was determined by a one-way ANOVA with Sidak’s post hoc test (* p < 0.05, ** p < 0.01, *** p < 0.001, and **** p < 0.0001).
Figure 4
Figure 4
Muscle phenotype analysis and bone volume of FMT donor and recipient HFD mice. (a) Bar charts showing soleus 2(−ΔΔCT) gene expression of (i) Pgc1a (ii) Ppara, (iii) Nrf2, (iv) Tfeb, and (v) Sirt1 in FMT recipients. (b) Relative EDL muscle protein analysis of (i) PGC-1α, (ii) Type IIA, (iii) Type IIB, and (iv) Type IIA/IIB fiber type expression in FMT recipients. The white dots in the violin plots represent individual data points, with panel (a) showing measurements pooled across animals (n = 3–5 mice per group) and panel (b) displaying values from individual animals (n = 4–6 mice per group). (c) Bone analysis of donor mice showing the bone volume of the tibia (expressed as mm3) in control (−E/−P), PEMF-exposed (−E/+P), exercised (+E/−P), and combined treatment (+E/+P) mice (n = 10 mice per group). (d) Illustration showing cortical (compact) bone and trabecular (spongy) bone. (e) Representative CT images of cortical and trabecular bone under the different treatment conditions. Yellow arrows indicate regions of bone thickening. The quantification of cortical and trabecular bone indices is presented in Figure 5. (E = exercise; P = PEMF). Scale bar = 500 µM. Statistical analysis was performed using a one-way ANOVA and multiple comparisons test. Statistical significance is denoted by * p < 0.05 and ** p < 0.01, with the error bars representing the standard error of the mean.
Figure 7
Figure 7
Glucose tolerance analysis of FMT recipient HFD mice. Glucose metabolism was assessed through (a) 120 min glucose tolerance curves and (b) time-stratified blood glucose levels (mM). The yellow background represents analyses of the FMT donor; the light blue background represents the analyses of the FMT recipient HFD. Data represents the average of n = 12–15 individual mice. Statistical analysis was determined by a one-way ANOVA with Sidak’s multiple comparisons tests (* p < 0.05, ** p < 0.01, and **** p < 0.0001). (E = exercise; P = PEMF).
Figure 8
Figure 8
Gut microbiota diversity and composition in donor and recipient mice. (a) Phylum-level relative abundance of microbial communities in fecal and cecal samples of (i) FMT donor and (ii) FMT recipient mice. (b) Firmicutes/Bacteroidetes (F/B ratio) and (c) Deferribacteres/Bacteroidetes (D/B ratio) from (i) FMT donor and (ii) FMT recipient HFD mice. Statistical analysis was performed using a one-way ANOVA with Sidak’s multiple comparisons tests, with * p < 0.05 and ** p < 0.01. The white dots in the violin plots represent individual animals, with n = 4–8 mice per group. Also see Table 1 (located at the end of the discussion). (E = exercise; P = PEMF).
Figure 9
Figure 9
Hepatic lipid profiles from donor mice. LC-GC/MS analyses of individual liver lipid subspecies within a lipid class expressed as a relative ratio (n = 5 mice per group). (a) Heatmap depiction of phospholipids (PC, PE, and PG), sphingolipids (CERs and SMs), cholesteryl esters (CEs), and neutral lipids (TAG, DAG, and MAG). (b) Bar charts display the mean relative ratio of all lipid subspecies combined, while white dots represent the average relative ratios of individual lipid subspecies from 5 animals per treatment group. Statistical analysis was determined using a one-way ANOVA with Tukey multiple comparisons test. Significant differences between treatment groups are denoted as * p < 0.05, ** p < 0.01, *** p < 0.001, and **** p < 0.0001.
Figure 10
Figure 10
Hepatic lipid profiles from HFD recipient mice. LC-GC/MS analysis of liver lipids with each subspecies within a lipid class expressed as a relative ratio (n = 4–6 mice per group). (a) Heatmap visualization of phospholipids (PC, PE, and PG), sphingolipids (CERs and SMs), cholesteryl esters (CEs), and neutral lipids (TAG, DAG, and MAG). (b) Bar charts display the mean relative ratio of all lipid subspecies combined, while white dots represent the average relative ratios of individual lipid subspecies from 4-6 animals per treatment group. Statistical analysis was performed by comparing the mean of relative ratios using a one-way ANOVA with Tukey multiple comparisons test. Significant differences between treatment groups are denoted as * p < 0.05, ** p < 0.01, *** p < 0.001, and **** p < 0.0001.

Similar articles

References

    1. Sabaratnam R., Wojtaszewski J.F.P., Hojlund K. Factors mediating exercise-induced organ crosstalk. Acta Physiol. 2022;234:e13766. doi: 10.1111/apha.13766. - DOI - PubMed
    1. Suriano F., Van Hul M., Cani P.D. Gut microbiota and regulation of myokine-adipokine function. Curr. Opin. Pharmacol. 2020;52:9–17. doi: 10.1016/j.coph.2020.03.006. - DOI - PubMed
    1. Pace L.A., Crowe S.E. Complex Relationships Between Food, Diet, and the Microbiome. Gastroenterol. Clin. N. Am. 2016;45:253–265. doi: 10.1016/j.gtc.2016.02.004. - DOI - PMC - PubMed
    1. Lynch S.V., Pedersen O. The Human Intestinal Microbiome in Health and Disease. N. Engl. J. Med. 2016;375:2369–2379. doi: 10.1056/NEJMra1600266. - DOI - PubMed
    1. Li S., Mao Y., Zhou F., Yang H., Shi Q., Meng B. Gut microbiome and osteoporosis: A review. Bone Jt. Res. 2020;9:524–530. doi: 10.1302/2046-3758.98.BJR-2020-0089.R1. - DOI - PMC - PubMed

LinkOut - more resources