

RNA-Seq Uncovers Association of Endocrine-Disrupting Chemicals with Hub Genes and Transcription Factors in Aggressive Prostate Cancer
- PMID: 40564927
- PMCID: PMC12192892
- DOI: 10.3390/ijms26125463
RNA-Seq Uncovers Association of Endocrine-Disrupting Chemicals with Hub Genes and Transcription Factors in Aggressive Prostate Cancer
Abstract
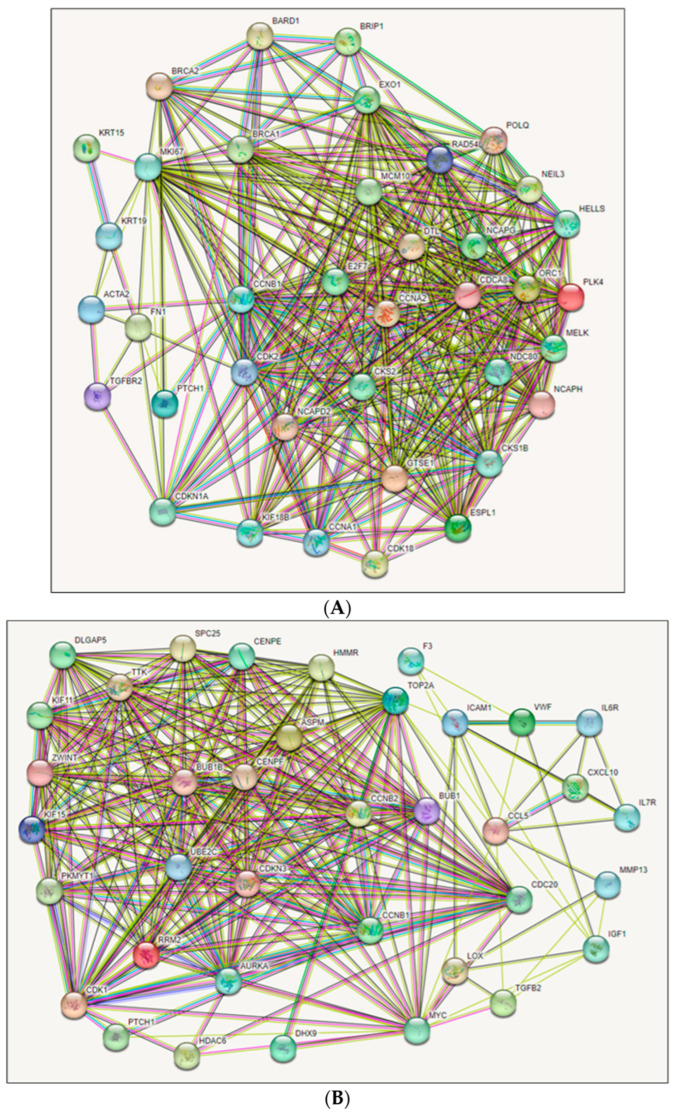
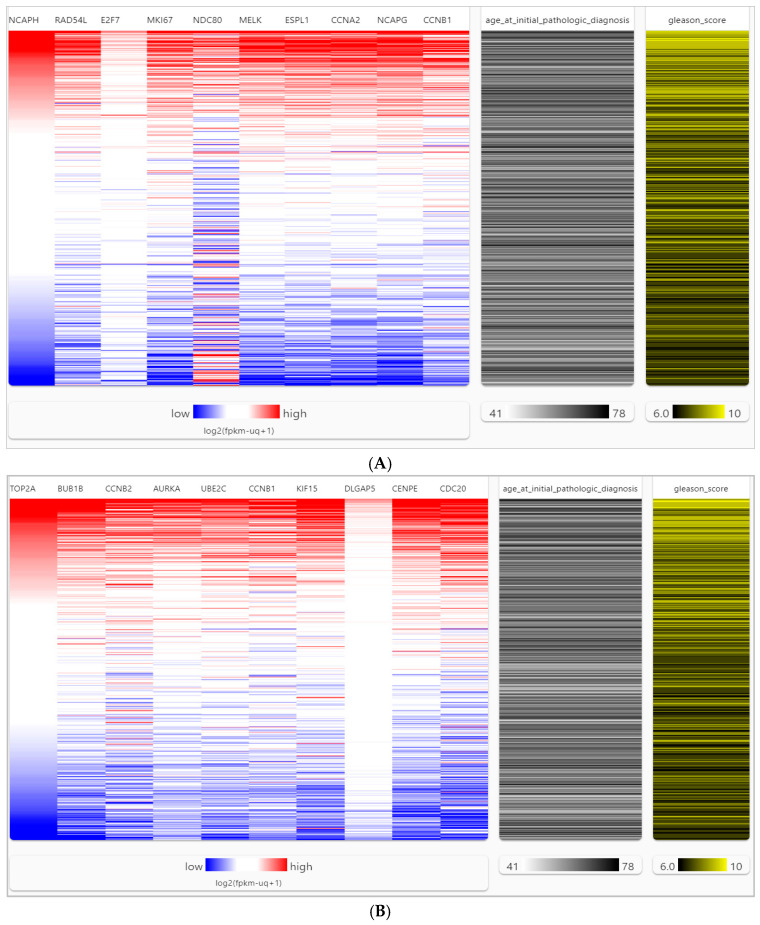
This study analyzes publicly available RNA-seq data to comprehensively include the complex heterogeneity of prostate cancer (PCa) etiology. It combines prostate and prostate cancer (PCa) cell lines, representing primary PCa cells, Gleason scores, ages, and PCa of different racial origins. Additionally, some cell lines were exposed to endocrine-disrupting chemicals (EDCs). The research aims to identify hub genes and transcription factors (TFs) of the prostate carcinogenesis pathway as molecular targets for clinical investigations to elucidate EDC-induced aggressiveness and to develop potential biomarkers for their exposure risk assessments. PCa cells rely on androgen receptor (AR)-mediated signaling to survive, develop, and function. Fifteen various RNA-seq datasets were normalized for distribution, and the significance (p-value < 0.05) threshold of differentially expressed genes (DEGs) was set based on |log2FC| ≥ 2 change. Through integrated bioinformatics, we applied cBioPortal, UCSC-Xena, TIMER2.0, and TRRUST platforms, among others, to associate hub genes and their TFs based on their biologically meaningful roles in aggressive prostate carcinogenesis. Among all RNA-Seq datasets, we found 75 overlapping DEGs, with BUB1B (32%) and CCNB1 (29%) genes exhibiting the highest degree of mutation, amplification, and deletion. EDC-associated CCNB1, BUB1B, and CCNA2 in PCa cells exposed to EDCs were consistently shown to be associated with high Gleason scores (≥4 + 3) and in the >60 age group of patients. Selected TFs (E2F4, MYC, and YBX1) were also significantly associated with DEGs (NCAPG, MKI67, CCNA2, CCNB1, CDK1, CCNB2, AURKA, UBE2C, BUB1B) and influenced the overall survival (p-value < 0.05) of PCa cases. This is one of the first comprehensive studies combining 15 publicly available RNA-seq datasets to demonstrate the association of EDC-associated hub genes and their TFs aligning with the aggressive carcinogenic pathways in the higher age group (>60 years) of patients. The findings highlight the potential of these hub genes as candidates for further studies to develop molecular biomarkers for assessing the EDC-related PCa risk, diagnosing PCa aggressiveness, and identifying therapeutic targets.
Keywords: RNA-seq; androgen receptor; differentially expressed genes; endocrine-disrupting chemicals; environmental carcinogenesis; environmental health risk assessment; prostate cancer; transcription factors.
Conflict of interest statement
The authors declare that they have no conflicts of interest.
Figures


Similar articles
-
Endocrine Disrupting Chemicals Influence Hub Genes Associated with Aggressive Prostate Cancer.Int J Mol Sci. 2023 Feb 6;24(4):3191. doi: 10.3390/ijms24043191. Int J Mol Sci. 2023. PMID: 36834602 Free PMC article.
-
Identifying possible hub genes and biological mechanisms shared between bladder cancer and inflammatory bowel disease using machine learning and integrated bioinformatics.J Cancer Res Clin Oncol. 2023 Dec;149(18):16885-16904. doi: 10.1007/s00432-023-05266-0. Epub 2023 Sep 23. J Cancer Res Clin Oncol. 2023. PMID: 37740761 Free PMC article.
-
Cohesive data analysis for the identification of prognostic hub genes and significant pathways associated with HER2 + and TN breast cancer types.Sci Rep. 2025 Jul 2;15(1):23675. doi: 10.1038/s41598-025-94084-0. Sci Rep. 2025. PMID: 40604083 Free PMC article.
-
Systemic pharmacological treatments for chronic plaque psoriasis: a network meta-analysis.Cochrane Database Syst Rev. 2017 Dec 22;12(12):CD011535. doi: 10.1002/14651858.CD011535.pub2. Cochrane Database Syst Rev. 2017. Update in: Cochrane Database Syst Rev. 2020 Jan 9;1:CD011535. doi: 10.1002/14651858.CD011535.pub3. PMID: 29271481 Free PMC article. Updated.
-
Systemic pharmacological treatments for chronic plaque psoriasis: a network meta-analysis.Cochrane Database Syst Rev. 2021 Apr 19;4(4):CD011535. doi: 10.1002/14651858.CD011535.pub4. Cochrane Database Syst Rev. 2021. Update in: Cochrane Database Syst Rev. 2022 May 23;5:CD011535. doi: 10.1002/14651858.CD011535.pub5. PMID: 33871055 Free PMC article. Updated.
References
-
- Tagai E.K., Miller S.M., Kutikov A., Diefenbach M.A., Gor R.A., Al-Saleem T., Chen D.Y., Fleszar S., Roy G. Prostate Cancer Patients’ Understanding of the Gleason Scoring System: Implications for Shared Decision-Making. J. Cancer Educ. 2018;34:441–445. doi: 10.1007/s13187-018-1320-1. - DOI - PMC - PubMed
MeSH terms
Substances
LinkOut - more resources
Full Text Sources
Medical
Research Materials
Miscellaneous
