. 2025 Jun 7;26(12):5473.
doi: 10.3390/ijms26125473.

Uridine, a Therapeutic Nucleoside, Exacerbates Alcoholic Liver Disease via SRC Kinase Activation: A Network Toxicology and Molecular Dynamics Perspective

Affiliations

Uridine, a Therapeutic Nucleoside, Exacerbates Alcoholic Liver Disease via SRC Kinase Activation: A Network Toxicology and Molecular Dynamics Perspective

Zhenyu Liu et al. Int J Mol Sci. .

Abstract

This study looked into the underlying mechanisms and causal relationship between alcoholic liver disease (ALD) and the blood metabolite uridine using a variety of analytical methods, such as Mendelian randomization and molecular dynamics simulations. We discovered uridine to be a possible hepatotoxic agent aggravating ALD by using Mendelian randomization (MR) analysis with genome-wide association study (GWAS) data from 1416 ALD cases and 217,376 controls, as well as with 1091 blood metabolites and 309 metabolite concentration ratios as exposure factors. According to network toxicology analysis, uridine interacts with important targets such as SRC, FYN, LYN, ADRB2, and GSK3B. The single-cell RNA sequencing analysis of ALD tissues revealed that SRC was upregulated in hepatocytes and activated hepatic stellate cells. Subsequently, we determined the stable binding between uridine and SRC through molecular docking and molecular dynamics simulation (RMSD = 1.5 ± 0.3 Å, binding energy < -5.0 kcal/mol). These targets were connected to tyrosine kinase activity, metabolic reprogramming, and GPCR signaling by Gene Ontology (GO) and KEGG studies. These findings elucidate uridine's role in ALD progression via immunometabolic pathways, offering novel therapeutic targets for precision intervention. These findings highlight the necessity of systems biology frameworks in drug safety evaluation, particularly for metabolites with dual therapeutic and toxicological roles.

Keywords: alcoholic liver disease; mendelian randomization; molecular dynamics simulation; network toxicology; single-cell RNA sequencing.


Conflict of interest statement

The authors declare that they have no competing interests.

Figures

Figure 1
Figure 1
A flowchart of this study. Using Mendelian randomization (MR) analysis with GWAS data (1416 ALD cases/217,376 controls) and 1091 blood metabolites/309 metabolite ratios, uridine was identified as a hepatotoxic agent aggravating ALD. Network toxicology linked uridine to SRC/FYN/LYN/ADRB2/GSK3β; single-cell analysis revealed SRC upregulation in hepatocytes. Molecular docking/dynamics (50 ns) confirmed stable uridine–SRC binding (RMSD = 1.5 ± 0.3 Å; binding energy < −5.0 kcal/mol). GO/KEGG analyses associated targets with tyrosine kinase activity, metabolic reprogramming, and GPCR signaling, elucidating uridine’s immunometabolic role in ALD progression.
Figure 2
Figure 2
Mendelian randomization analysis of 1091 serum metabolite levels and 309 metabolite level ratios with ALD. This study employed an inverse-variance-weighted (IVW) Mendelian randomization analysis to evaluate the causal relationships between genetic proxies for serum metabolites and ALD. Specifically, uridine levels showed a significant positive correlation with ALD risk. Among other metabolite-related genetic proxies, phenylalanine levels and stachydrine demonstrated negative and positive associations with ALD risk, respectively. All analyses integrated instrumental variable effect sizes using the IVW method, with results presented as odds ratios (ORs), 95% confidence intervals (CIs), and p-values.
Figure 3
Figure 3
Mendelian randomization (MR) analysis of serum uridine levels on ALD. (A) Summary table of MR results indicating significant positive associations between elevated uridine levels and ALD risk using the weighted median, IVW, and weighted mode methods; (B) forest plot of leave-one-out sensitivity analysis showing individual SNP effects (e.g., rs12289224, rs4401730) on the uridine–ALD association, presented as β-values with 95% confidence intervals (CIs); (C) scatter plot of the effects of uridine-associated SNPs on ALD risk evaluated by five MR methods (IVW, MR-Egger, simple mode, weighted median, and weighted mode), with the x-axis and y-axis representing SNP effect sizes (β) on uridine levels and ALD risk, respectively; The arrow in the figure represents the visual depiction of the OR value, with the base of the arrow being the minimum value of the 95% Cl and the tip of the arrow being the maximum value of the 95% Cl.
Figure 4
Figure 4
Integrated multi-database analysis of the molecular mechanisms linking uridine and ALD. (A) Venn diagram shows the target genes of uridine predicted by ChEMBL, STITCH, and SwissTargetPrediction databases, taking and summing the predictions; (B) Venn diagram illustrates the target genes of ALD predicted by GeneCards, OMIM, and TTD databases, taking and summing the predictions; (C) Venn diagram illustrates the overlapping target genes of uridine and ALD; (D) global topology of the protein–protein interaction (PPI) network; (EG) node centrality analysis: key proteins were identified based on node degree (E), closeness centrality (F), and betweenness centrality (G), with SRC ranking within the top 5% across all three metrics, indicating its hub status; (H,I) using the MCODE plugin in Cytoscape to score 48 core genes, with Module 1 (score = 12.8, (H)) and Module 2 (score = 9.6, (I)).
Figure 5
Figure 5
The expression characteristics of 48 core genes were determined by GO enrichment analysis and KEGG enrichment analysis, and the expression characteristics of SRC, LYN, FYN, GSK3B, and ADRB2 were determined by single-cell transcriptome sequencing analysis. (A) GO enrichment analysis demonstrates significant enrichment in biological processes and molecular functions such as G protein-coupled receptor (GPCR) signaling regulation and kinase activity. (B) KEGG enrichment analysis reveals that the hub genes are primarily associated with nucleotide metabolism, the cGMP-PKG signaling pathway, and cancer-related pathways. The color gradient represents the significance level of the p-value. (C) Based on the t-SNE algorithm, the dimensionality reduction analysis of cell types was carried out, and the horizontal axis (tSNE_1) and vertical axis (tSNE_2) showed the distribution of different cell types. (D) SRC, GSK3B, ADRB2, FYN, and LYN gene expression characteristics: purple dots represent the average expression level (color intensity) and expression percentage (dot size) of genes in various cell types, while dark large dots indicate high expression levels and widespread expression. Note: GSK3B is a gene name, and the protein product is GSK3β.
Figure 6
Figure 6
Molecular docking analysis of uridine with key targets. (A) GSK3β and uridine molecular docking macro and micro diagrams; (B) FYN and uridine molecular docking macro and micro diagrams; (C) LYN and uridine molecular docking macro and micro diagrams; (D) SRC and uridine molecular docking macro and micro diagrams; (E) ADRB2 and uridine molecular docking macro and micro diagrams.
Figure 7
Figure 7
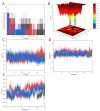
Molecular dynamics analysis of uridine–SRC kinase binding stability. (A) Hydrogen bond occupancy highlights GLU-95 stabilizing uridine’s ribose oxygen. (B) Free energy landscape along PC1/PC2 dimensions reveals dominant low-energy conformational state. (C) Rg (10.6 ± 0.2 Å) stabilization indicates kinase domain compaction. (D) RMSD convergence (1.5 ± 0.3 Å post 20 ns) confirms structural equilibration. (E) SASA (4000 ± 400 Å2) stabilization indicates kinase domain compaction. The red and blue in the image represent SRC and uridine.

Similar articles

References

    1. Roerecke M., Vafaei A., Hasan O.S.M., Chrystoja B.R., Cruz M., Lee R., Neuman M.G., Rehm J. Alcohol Consumption and Risk of Liver Cirrhosis: A Systematic Review and Meta-Analysis. Am. J. Gastroenterol. 2019;114:1574–1586. doi: 10.14309/ajg.0000000000000340. - DOI - PMC - PubMed
    1. Armstrong L.E., Guo G.L. Understanding Environmental Contaminants’ Direct Effects on Non-alcoholic Fatty Liver Disease Progression. Curr. Environ. Health Rep. 2019;6:95–104. doi: 10.1007/s40572-019-00231-x. - DOI - PMC - PubMed
    1. Alengebawy A., Abdelkhalek S.T., Qureshi S.R., Wang M.Q. Heavy Metals and Pesticides Toxicity in Agricultural Soil and Plants: Ecological Risks and Human Health Implications. Toxics. 2021;9 doi: 10.3390/toxics9030042. - DOI - PMC - PubMed
    1. Song H., Zhou H., Yang S., He C. Combining mendelian randomization analysis and network toxicology strategy to identify causality and underlying mechanisms of environmental pollutants with glioblastoma: A study of Methyl-4-hydroxybenzoate. Ecotoxicol. Environ. Saf. 2024;287:117311. doi: 10.1016/j.ecoenv.2024.117311. - DOI - PubMed
    1. Qu T., Sun Q., Tan B., Wei H., Qiu X., Xu X., Gao H., Zhang S. Integration of network toxicology and transcriptomics reveals the novel neurotoxic mechanisms of 2, 2′, 4, 4′-tetrabromodiphenyl ether. J. Hazard. Mater. 2024;486:136999. doi: 10.1016/j.jhazmat.2024.136999. - DOI - PubMed

MeSH terms

LinkOut - more resources