. 2025 Jun 8;26(12):5497.
doi: 10.3390/ijms26125497.

Transglutaminase 2 Stimulates Cell Proliferation and Modulates Transforming Growth Factor-Beta Signaling Pathway Independently of Epithelial-Mesenchymal Transition in Hepatocellular Carcinoma Cells

Affiliations

Transglutaminase 2 Stimulates Cell Proliferation and Modulates Transforming Growth Factor-Beta Signaling Pathway Independently of Epithelial-Mesenchymal Transition in Hepatocellular Carcinoma Cells

Hiromi Yamaguchi et al. Int J Mol Sci. .

Abstract

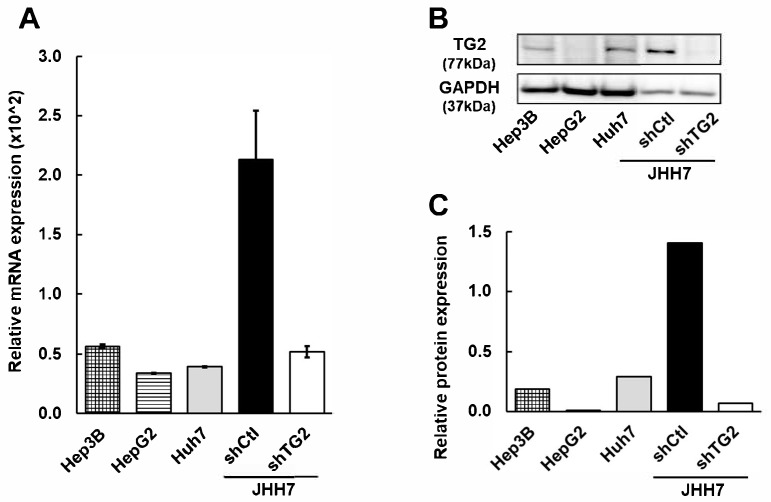
Transglutaminase 2 (TG2) is a multifunctional protein and plays a role in cancer progression. We previously identified TG2 as an early-recurrence biomarker in hepatocellular carcinoma (HCC). TG2-knockdown (shTG2) and control (shCtl) HCC cell lines were used for comparative analyses to clarify the molecular mechanisms underlying the contribution of this protein to HCC malignancy. The proliferation of shTG2 cells was slightly but significantly decreased compared with that of shCtl cells. Differential gene expression profiling based on GeneChip arrays revealed the enrichment of the PI3K-Akt signaling pathway and showed that the expression of Dickkopf-1 and -3 (DKK1 and DKK3, respectively), inhibitors and modulators of the Wnt/β-catenin signaling pathway, was increased in shTG2 cells. The expression of epithelial-mesenchymal transition (EMT)-related genes was similar in both shCtl and shTG2 cells before and after TGF-β1 treatment, even though TGF-β1 markedly upregulated TG2. Thus, TG2 may contribute to cancer malignancy via the stimulation of cell proliferation signaling, such as PI3K-Akt and Wnt/β-catenin signaling, but not EMT. This effect might be further enhanced by humoral factors such as TGF-β1 from the tumor microenvironment.

Keywords: PI3K-Akt signaling; TGF-β1; Wnt/β-catenin signaling; epithelial–mesenchymal transition; hepatocellular carcinoma; transglutaminase 2; tumor microenvironment.


Conflict of interest statement

The authors declare no conflicts of interest.

Figures

Figure 1
Figure 1
TG2 expression in HCC cell lines. (A) Relative mRNA expression level of TG2. The quantity of TG2 mRNA was normalized against that of GAPDH and is shown in bar graph (mean ± SD). (B) Western blot image of TG2. GAPDH was used as loading control. (C) Relative protein expression of TG2. Intensity of Western blot image of TG2 was normalized against that of GAPDH and was expressed as arbitrary unit.
Figure 2
Figure 2
Cell proliferation and migration ability of shCtl and shTG2 cells. (A) Cell viability assay was performed with alamarBlue reagent, and the obtained fluorescence values were normalized against those of day 0. Mean ± SD of nine replicates is shown. *, p < 0.0001. (B) Representative images of in vitro scratch wound healing assay. (C) Bar graph of migration rate. Migration rate was analyzed by using MRI Wound Healing Tool from ImageJ MRI Wound Healing Tool (RRID:SCR_025260, version 1.52a) and mean ± SD of three replicates is shown. NS, not significant.
Figure 3
Figure 3
Comprehensive analysis of differentially expressed genes in shCtl and shTG2 cells. (A) Flowchart of GeneChip Human Genome U133 Plus 2.0 Array analysis. From 54,613 probe sets, probes present in at least one cell line were chosen for further analysis. More than 1500 differentially expressed genes were selected for pathway analysis. (B) Enriched pathways identified by using DAVID platform. The top 6 pathways with p-value < 0.05 and FDR q-value < 0.25 are displayed as a bar graph, with the x-axis representing −Log10(p-value) and the y-axis showing KEGG pathway names. (C) mRNA expression of differentially expressed genes in shCtl and shTG2 cells. TaqMan qPCR data (relative expression level, normalized against GAPDH) are shown in a bar graph (mean ± SD).
Figure 4
Figure 4
mRNA and protein expression of TGF-β1-induced TG2 and EMT-related genes. (A) mRNA expression of TG2 gene in shCtl and shTG2 cells in absence (−) or presence (+) of TGF-β1. Quantity of TG2 mRNA normalized against that of GAPDH is shown in bar graph (mean ± SD). (B) mRNA expression of EMT-related genes in shCtl and shTG2 cells without (−) or with (+) TGF-β1. Quantity of mRNAs was normalized against GAPDH and is shown in bar graph (mean ± SD). (C) Representative images of immunofluorescence for TG2 (green) and N-cadherin (red) without (−) or with (+) TGF-β1 in shCtl and shTG2 cells. Cell nuclei were visualized by using DAPI. (D) Representative phalloidin staining images without (−) or with (+) TGF-β1 in shCtl and shTG2 cells.
Figure 5
Figure 5
Clinical prognosis and pathway analysis of high-TG2 HCC and high-TGF-β1/high-TG2 HCC in TCGA cohort. (A) Schematic illustration showing classification of HCC cases. In total, 366 HCC cases were classified into groups as depicted based on gene expression data from TCGA database. (B) Kaplan–Meier curve of OS rate between high-TG2 (n = 119) and low-TG2 (n = 118) HCC groups. (C) GSEA between high-TG2 (n = 120) and low-TG2 (n = 120) HCC groups. Top five gene sets were determined according to FWER p-values. (D) Kaplan–Meier curve of OS rate among high-TGF-β1/high-TG2 (n = 28), high-TGF-β1/low-TG2 (n = 28), low-TGF-β1/high-TG2 (n = 36), and low-TGF-β1/low-TG2 (n = 37) HCC groups. (E) GSEA between high-TGF-β1/high-TG2 (n = 28) and low-TGF-β1/low-TG2 (n = 38) HCC groups. Top five gene sets were determined according to FWER p-values.

Similar articles

References

    1. Sung H., Ferlay J., Siegel R.L., Laversanne M., Soerjomataram I., Jemal A., Bray F. Global Cancer Statistics 2020: GLOBOCAN Estimates of Incidence and Mortality Worldwide for 36 Cancers in 185 Countries. CA Cancer J. Clin. 2021;71:209–249. doi: 10.3322/caac.21660. - DOI - PubMed
    1. Singal A.G., Lampertico P., Nahon P. Epidemiology and Surveillance for Hepatocellular Carcinoma: New Trends. J. Hepatol. 2020;72:250–261. doi: 10.1016/j.jhep.2019.08.025. - DOI - PMC - PubMed
    1. Teng W., Wu T.-C., Lin S.-M. Hepatocellular Carcinoma Systemic Treatment 2024 Update: From Early to Advanced Stage. Biomed. J. 2024;540:100815 - PubMed
    1. Yamaguchi H., Kuroda K., Sugitani M., Takayama T., Hasegawa K., Esumi M. Transglutaminase 2 Is Upregulated in Primary Hepatocellular Carcinoma with Early Recurrence as Determined by Proteomic Profiles. Int. J. Oncol. 2017;50:1749–1759. doi: 10.3892/ijo.2017.3917. - DOI - PubMed
    1. Nurminskaya M.V., Belkin A.M. Cellular Functions of Tissue Transglutaminase. Int. Rev. Cell Mol. Biol. 2012;294:1–97. - PMC - PubMed

MeSH terms

Substances

Grants and funding

LinkOut - more resources