. 2025 Jun 9;26(12):5507.
doi: 10.3390/ijms26125507.

Omega-3 Fatty Acids Mitigate Long-Lasting Disruption of the Endocannabinoid System in the Adult Mouse Hippocampus Following Adolescent Binge Drinking

Affiliations

Omega-3 Fatty Acids Mitigate Long-Lasting Disruption of the Endocannabinoid System in the Adult Mouse Hippocampus Following Adolescent Binge Drinking

Maitane Serrano et al. Int J Mol Sci. .

Abstract

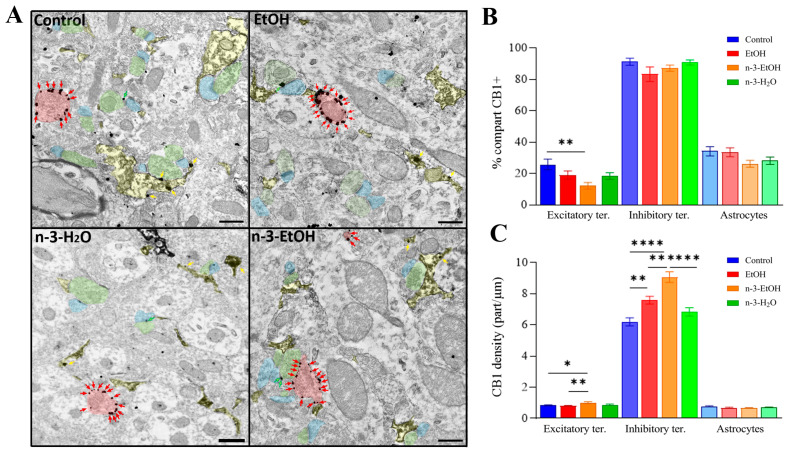
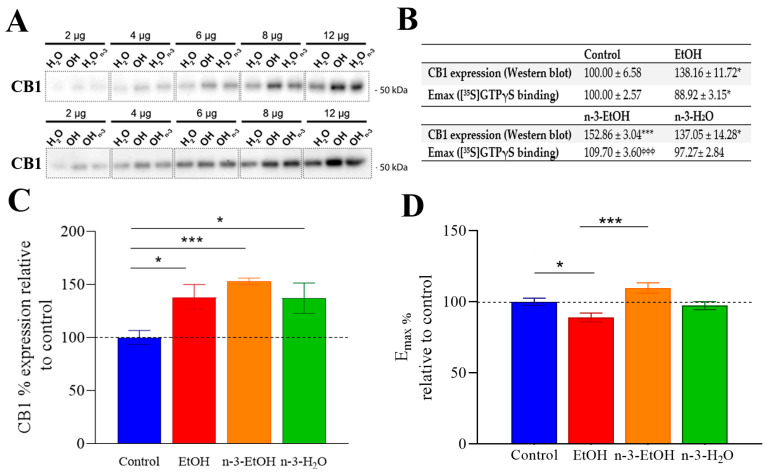
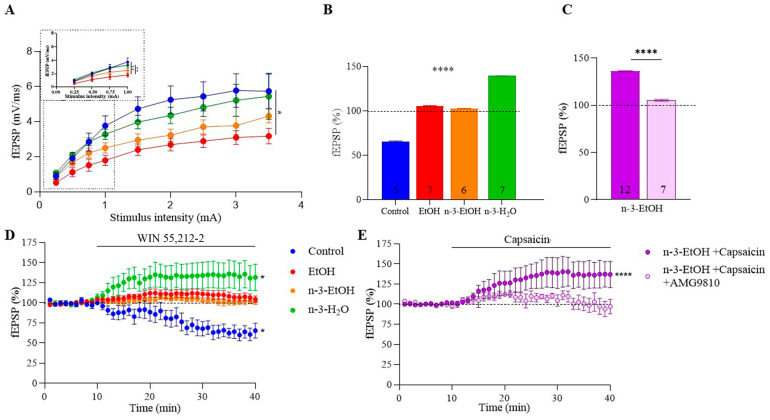
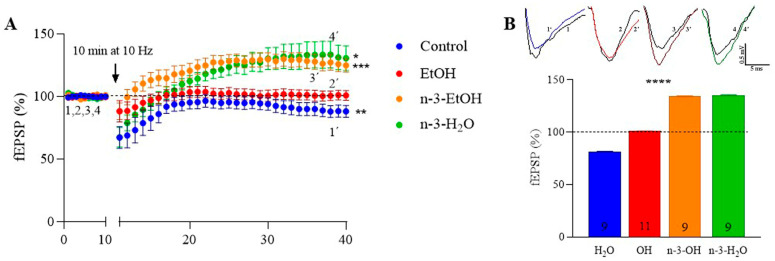
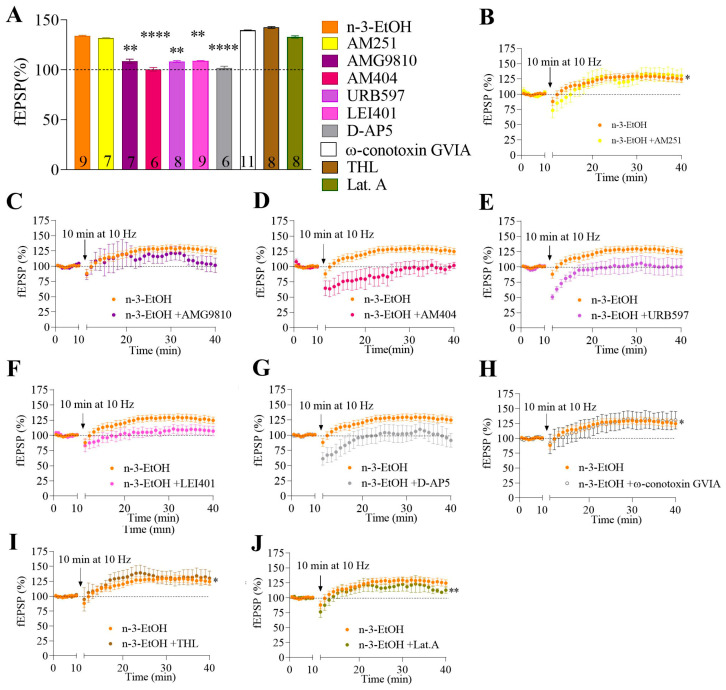
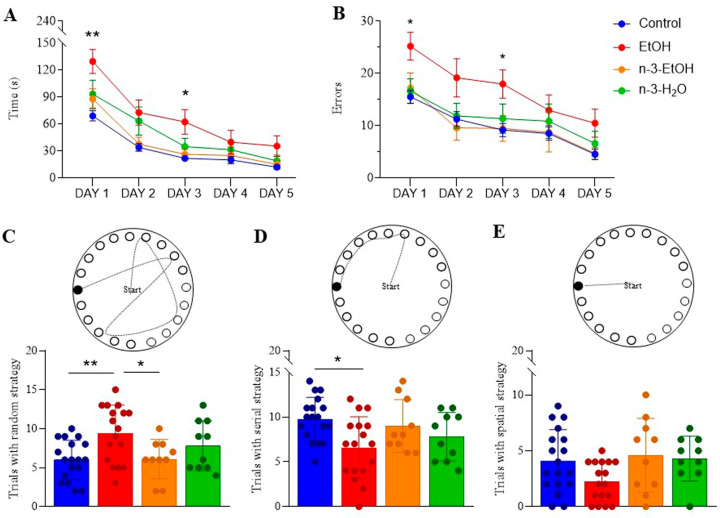
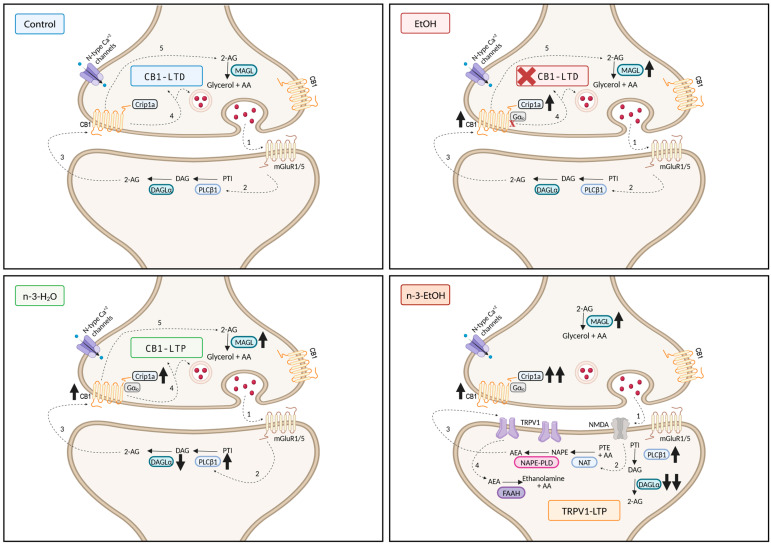
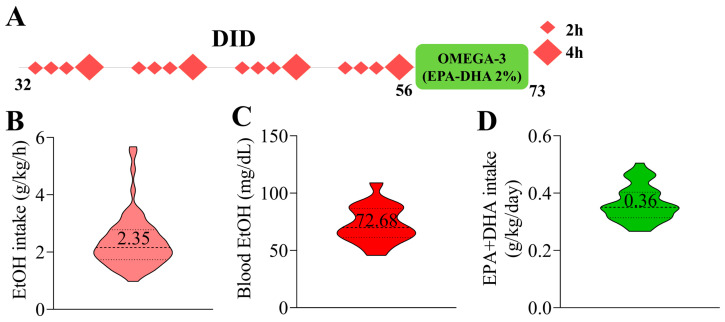
Adolescent binge drinking has lasting behavioral consequences by disrupting the endocannabinoid system (ECS) and depleting brain omega-3. The natural accumulation of omega-3 fatty acids in cell membranes is crucial for maintaining the membrane structure, supporting interactions with the ECS, and restoring synaptic plasticity and cognition impaired by prenatal ethanol (EtOH) exposure. However, it remains unclear whether omega-3 supplementation can mitigate the long-term effects on the ECS, endocannabinoid-dependent synaptic plasticity, and cognition following adolescent binge drinking. Here, we demonstrated that omega-3 supplementation during EtOH withdrawal increases CB1 receptors in hippocampal presynaptic terminals of male mice, along with the recovery of receptor-stimulated [35S]GTPγS binding to Gαi/o proteins. These changes are associated with long-term potentiation (LTP) at excitatory medial perforant path (MPP) synapses in the dentate gyrus (DG), which depends on anandamide (AEA), transient receptor potential vanilloid 1 (TRPV1), and N-methyl-D-aspartate (NMDA) receptors. Finally, omega-3 intake following binge drinking reduced the time and number of errors required to locate the escape box in the Barnes maze test. Collectively, these findings suggest that omega-3 supplementation restores Barnes maze performance to levels comparable to those of control mice after adolescent binge drinking. This recovery is likely mediated by modulation of the hippocampal ECS, enhancing endocannabinoid-dependent excitatory synaptic plasticity.

Keywords: CB1 receptor; alcohol; hippocampus; memory; polyunsaturated fatty acids; synaptic plasticity.


Conflict of interest statement

The authors declare no conflicts of interest.

Figures

Figure 1
Figure 1
Immunoelectron localization of CB1 receptors in the middle third of the DG in control, EtOH, n-3-EtOH and n-3-H2O mice. (A) CB1 receptors were identified in terminals forming symmetric synapses (red shading and arrows), terminals forming asymmetric synapses (green shading and arrows) with dendrites (blue shading) and astrocytic membranes (yellow shading and arrows). (B) Percentage of CB1 receptor-positive profiles (excitatory terminals: n-3-EtOH vs. control p = 0.0037). (C) CB1 receptor density (particles/µm) in excitatory terminals (n-3-EtOH vs. control p = 0.0132; n-3-EtOH vs. EtOH p = 0.0015), inhibitory terminals (EtOH vs. control p = 0.0031; n-3-EtOH vs. control p < 0.0001; n-3-EtOH vs. EtOH p = 0.0012; n-3-H2O vs. n-3-EtOH p < 0.0001), and GLAST-stained astrocytes. Results are presented as means ± SEMs (see Supplementary Table S1). Statistical analysis of data used two-way ANOVA with Tukey’s multiple comparison tests: * p < 0.05, ** p < 0.01, **** p < 0.0001. Scale bars: 200 nm.
Figure 2
Figure 2
CB1 receptor expression and coupling to Gαi/o in hippocampal synaptosomes from control, EtOH, n-3-EtOH and n-3-H2O mice. (A) Representative Western blot with increasing amounts of synaptosomal protein (2, 4, 6, 8, and 12 µg per lane). Protein loading was verified using Coomassie Brilliant Blue gel staining. The molecular weight of the immunoreactive band was determined using standard markers (indicated in the figure), and protein migration corresponded to the expected molecular mass (CB1, 52.8 kDa). H2O, OH, H2On-3 and OHn-3 correspond to control, EtOH, n-3-H2O and n-3-EtOH groups, respectively. (B) Analysis of CB1 relative expression and coupling to Gαi/o. CB1 expression values represent the means ± SEs of slopes (normalized to the control) obtained by linear regression analysis (see Supplementary Figure S2), and the Emax values represent the means ± SEs obtained from complete concentration–response curves (see Supplementary Figure S1). Both expression and Emax values were obtained from independent experiments using synaptosomal membranes prepared from three fractionation procedures, including hippocampal pools from at least six adult mice. (C) Histogram of relative CB1 expression (EtOH vs. control p = 0.0245; n-3-EtOH vs. control p = 0.0006; n-3-H2O vs. control p = 0.0476). (D) Histogram of Emax of CP 55,940-stimulated [35S]GTPγS binding (EtOH vs. control p = 0.0445; n-3-EtOH vs. EtOH p = 0.0006). The statistical significance was determined using the extra-sum-of-squares F test (F) method: * p < 0.05 and *** p < 0.001 compared to control; ϕϕϕ p < 0.001 compared to EtOH.
Figure 3
Figure 3
Omega-3 supplementation ameliorates the EtOH impact on the excitatory MPP synaptic transmission. (A) Input–output curves showing mean fEPSP areas (mV/ms) plotted against stimulation intensities in hippocampi of control (n = 13), EtOH (n = 17), n-3-EtOH (n = 20), and n-3-H2O (n = 21) mice (EtOH vs. control p = 0.0284). (B) Summary bar graphs of the WIN 55-212-2 effect (5 µM) on fEPSPs in control, EtOH, n-3-EtOH and n-3-H2O mice (EtOH vs. control p < 0.0001; n-3-EtOH vs. control p < 0.0001; n-3-H2O vs. control p < 0.0001; n-3-H2O vs. EtOH p < 0.0001; n-3-H2O vs. n-3-EtOH p < 0.0001). (C) Summary bar graphs for n-3-EtOH + capsaicin (1 µM) and n-3-EtOH + capsaicin (1 µM) + AMG9810 (3 µM) (n-3-EtOH+capsaicin+AMG9810 vs. n-3-EtOH+capsaicin p < 0.0001). (D) Time-course plot of the WIN 55,212-2 effect on fEPSPs in control (response vs. baseline p = 0.0373), EtOH, n-3-EtOH and n-3-H2O mice (response vs. baseline p = 0.0361). (E) Time-course plot of the capsaicin effect (1 µM) and AMG9810 (3 µM) on fEPSPs in n-3-EtOH (n-3-EtOH+capsaicin response vs. baseline p < 0.0001). Numbers in the bars are individual experiments. All data are presented as mean ± SEM and analyzed using two-way ANOVA and Tukey’s multiple comparison test (A,B), unpaired t-test (C) or paired t-test (D,E). Significant differences: * p < 0.05; ** p < 0.01,**** p < 0.0001.
Figure 4
Figure 4
Omega-3-enriched diet potentiates MPP synaptic plasticity impaired by EtOH consumption during adolescence. (A) Effect of low-frequency stimulation (LFS; 10 min, 10 Hz) on fEPSPs in control (81.25 ± 0.46 **; response vs. baseline p = 0.0082), EtOH (101.00 ± 0.15), n-3-EtOH (134.20 ± 0.50 ***; response vs. baseline p = 0.0004) and n-3-H2O mice (135.40 ± 0.46 *; response vs. baseline p = 0.0181). Data are presented as mean ± SEM and analyzed using paired t-tests or the Wilcoxon test. Significance levels: * p < 0.05, ** p < 0.01, *** p < 0.001 compared to baseline. (B) Top: Superimposed traces of averaged fEPSPs from the last 10 min illustrating the LFS effect. Bottom: Summary bar graph showing MPP-LTD and MPP-LTP in control, EtOH, n-3-EtOH and n-3-H2O groups (EtOH vs. control p < 0.0001; n-3-EtOH vs. control p < 0.0001; n-3-H2O vs. control p < 0.0001; n-3-H2O vs. EtOH p < 0.0001; n-3-H2O vs. n-3-EtOH p < 0.0001). Numbers in the bars represent individual experiments. Data are expressed as mean ± SEM and analyzed using two-way ANOVA followed by Tukey’s multiple comparison test. Significance level: **** p < 0.0001.
Figure 5
Figure 5
The MPP-LTP in n-3-EtOH mice is mediated by TRPV1, NMDA, and AEA. (A) The summary bar graph illustrates the effects of various pharmacological compounds (see the table in Section 4.7) on MPP-LTP: n-3-EtOH, n-3-EtOH + AM251 (4 µM), n-3-EtOH + AMG9810 (3 µM) (n-3-EtOH + AMG9810 vs. n-3-EtOH p = 0.0014), n-3-EtOH + AM404 (30 µM) (n-3-EtOH + AM404 vs. n-3-EtOH p < 0.0001), n-3-EtOH + URB597 (2 µM) (n-3-EtOH+URB597 vs. n-3-EtOH p = 0.0036), n-3-EtOH + LEI401 (10 µM) (n-3-EtOH+LEI401 vs. n-3-EtOH p = 0.0078), n-3-EtOH + D-AP5 (50 µM) (n-3-EtOH+D-AP5 vs. n-3-EtOH p < 0.0001), n-3-EtOH + ω-conotoxin GVIA (1 µM), n-3-EtOH + THL (10 µM), and n-3-EtOH + latrunculin A (500 µM). Numbers in the bars indicate individual experiments. Data are presented as mean ± SEM and analyzed using Dunn’s test. Significant differences versus n-3-EtOH LTP: ** p < 0.01, **** p < 0.0001. Time-course plots in n-3-EtOH mice in the absence or presence of (B) AM251 (response vs. baseline p = 0.0263), (C) AMG9810, (D) AM404, (E) URB597, (F) LEI401, (G) D-AP5, (H) ω-conotoxin GVIA (response vs. baseline p = 0.0425), (I) THL (response vs. baseline p = 0.0189), and (J) latrunculin A (response vs. baseline p = 0.0078). Data are presented as mean ± SEM and analyzed by paired t-test or Wilcoxon test, depending on the data distribution. Significant differences vs. baseline: * p < 0.05; ** p < 0.01.
Figure 6
Figure 6
Barnes maze performance of control (n = 18), EtOH (n = 17), n-3-EtOH (n = 10) and n-3-H2O (n = 10) mice: (A) Time required (day 1: EtOH vs. control p = 0.0025; day 3: EtOH vs. control p = 0.0414) and (B) number of errors (day 1: EtOH vs. control p = 0.0217; day 3: EtOH vs. control p = 0.0300) to locate the escape box over five days of testing. Data are presented as mean ± SEM and analyzed using two-way ANOVA followed by Tukey’s multiple comparison test. Significance levels: * p < 0.05, ** p < 0.01 compared to control. (C) Random (EtOH vs. control p = 0.0046; n-3-EtOH vs. EtOH p = 0.0259), (D) serial (EtOH vs. control p = 0.0141), and (E) spatial strategies used by each experimental group. Data are expressed as mean ± SEM and analyzed using two-way ANOVA followed by Tukey’s multiple comparison test. Significance levels: * p < 0.05, ** p < 0.01.
Figure 7
Figure 7
Summary of the main findings in the context of our previous reports [3,28,29]: Under physiological conditions (Control), LFS (10 Hz, 10 min) induces CB1-dependent LTD at excitatory MPP synapses in the DG. This form of synaptic plasticity requires the activation of group I mGluRs (1), which triggers the production of 2-AG by PLCβ1 and DAGLα (2), which then acts retrogradely on presynaptic CB1 receptors (3), leading to LTD (4). 2-AG is subsequently degraded by MAGL (5). Binge drinking during adolescence (EtOH) leads, after a period of abstinence, to an increase in CB1 receptors (↑), Crip1a (↑) and MAGL (↑) in synaptosomes, resulting in the abolishment of CB1-LTD and impaired cognitive performance in the Barnes maze test. Omega-3 supplementation during abstinence (n-3-EtOH) also increases CB1 receptors (↑), Crip1a (↑↑), MAGL (↑), and PLCβ1 (↑), while drastically decreasing DAGLα (↓↓) in synaptosomes. These changes in the ECS are associated with glutamate-activated NMDA receptors (1), which trigger AEA production (2) and postsynaptic TRPV1 activation (3). This leads to TRPV1-dependent LTP at the MPP synapses, resulting in a recovery of Barnes maze performance to levels comparable to control mice. AEA is subsequently degraded by FAAH (4). Omega-3 supplementation (n-3-H2O) also increases CB1 receptors (↑), Crip1a (↑), MAGL (↑), and PLCβ1 (↑), while decreasing DAGLα (↓) in synaptosomes. These changes in ECS components correlate with LTP at the MPP synapses. However, in contrast to n-3-EtOH, this form of synaptic plasticity is dependent on group I mGluRs (1), 2-AG synthesis (2), and CB1 receptors (3), ultimately leading to LTP (4). Subsequently, 2-AG is degraded by MAGL (5). Created in BioRender. Administrator, S. (2025) https://BioRender.com/g04m048 (accessed on 24 January 2025).
Figure 8
Figure 8
Schematic representation of the experimental timeline, total EtOH intake, BEC, and EPA+DHA intake. (A) Male C57BL/6J mice were subjected to a 4 week DID protocol during adolescence (PND 32–56). The mice were given free access to 20% (v/v) EtOH each week for 2 and 4 h. During withdrawal (PND 56–73), half of the mice were provided with an omega-3-enriched diet. (B) The total EtOH intake was 2.35 ± 0.11 g/kg/h (n = 18). (C) The BEC measured on the final day of EtOH exposure was 72.68 ± 3.78 mg/dL (n = 18). (D) The average daily intake of EPA+DHA was 0.36 ± 0.01 g/kg/day (n = 30).

Similar articles

References

    1. Cservenka A., Brumback T. The burden of binge and heavy drinking on the brain: Effects on adolescent and young adult neural structure and function. Front. Psychol. 2017;8:1111. doi: 10.3389/fpsyg.2017.01111. - DOI - PMC - PubMed
    1. Kang E., Yun B., Cha J., Suk H.I., Shin E.K. Neurodevelopmental imprints of sociomarkers in adolescent brain connectomes. Sci. Rep. 2024;14:20921. doi: 10.1038/s41598-024-71309-2. - DOI - PMC - PubMed
    1. Peñasco S., Rico-Barrio I., Puente N., Fontaine C.J., Ramos A., Reguero L., Gerrikagoitia I., Rodríguez de Fonseca F., Suárez J., Barrondo S., et al. Intermittent ethanol exposure during adolescence impairs cannabinoid type 1 receptor-dependent long-term depression and recognition memory in adult mice. Neuropsychopharmacology. 2020;45:309–318. doi: 10.1038/s41386-019-0530-5. - DOI - PMC - PubMed
    1. Kunos G. Interactions between alcohol and the endocannabinoid system. Alcohol Clin. Exp. Res. 2020;44:790–805. doi: 10.1111/acer.14306. - DOI - PMC - PubMed
    1. Navarrete F., García-Gutiérrez M.S., Gasparyan A., Navarro D., López-Picón F., Morcuende A., Femenía T., Manzanares J. Biomarkers of the endocannabinoid system in substance use disorders. Biomolecules. 2022;12:396. doi: 10.3390/biom12030396. - DOI - PMC - PubMed

MeSH terms

LinkOut - more resources