. 2025 Jun 12;26(12):5626.
doi: 10.3390/ijms26125626.

Radiation Promotes Acute and Chronic Damage to Adipose Tissue

Affiliations

Radiation Promotes Acute and Chronic Damage to Adipose Tissue

Kia T Liermann-Wooldrik et al. Int J Mol Sci. .

Abstract

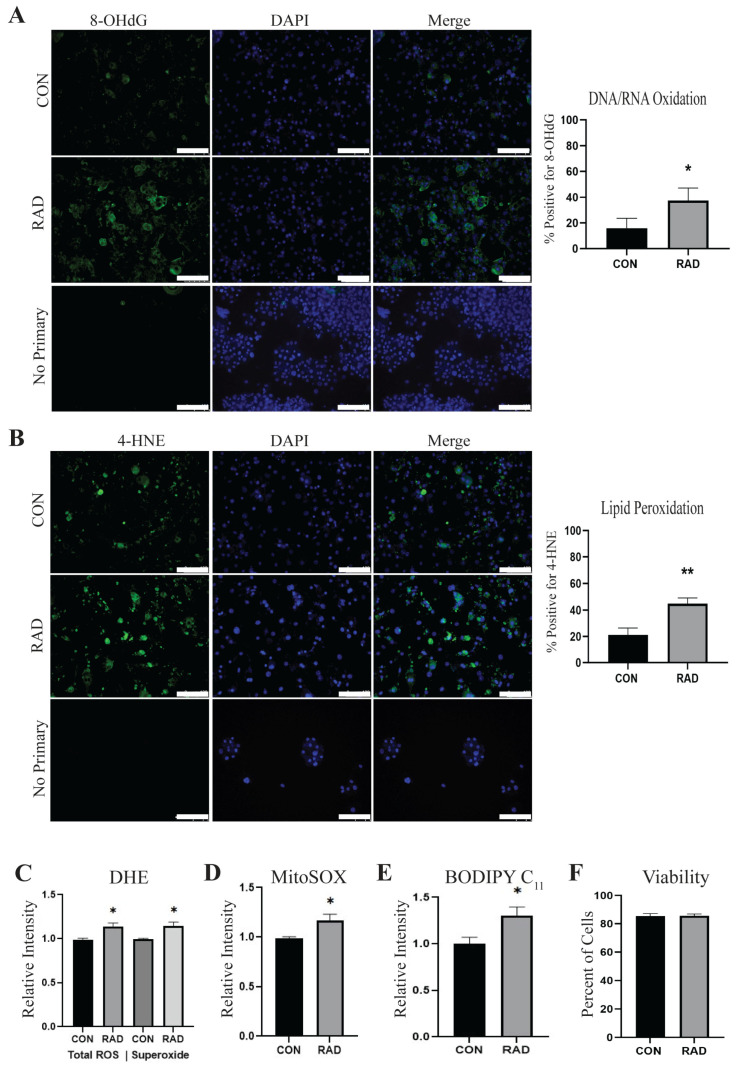
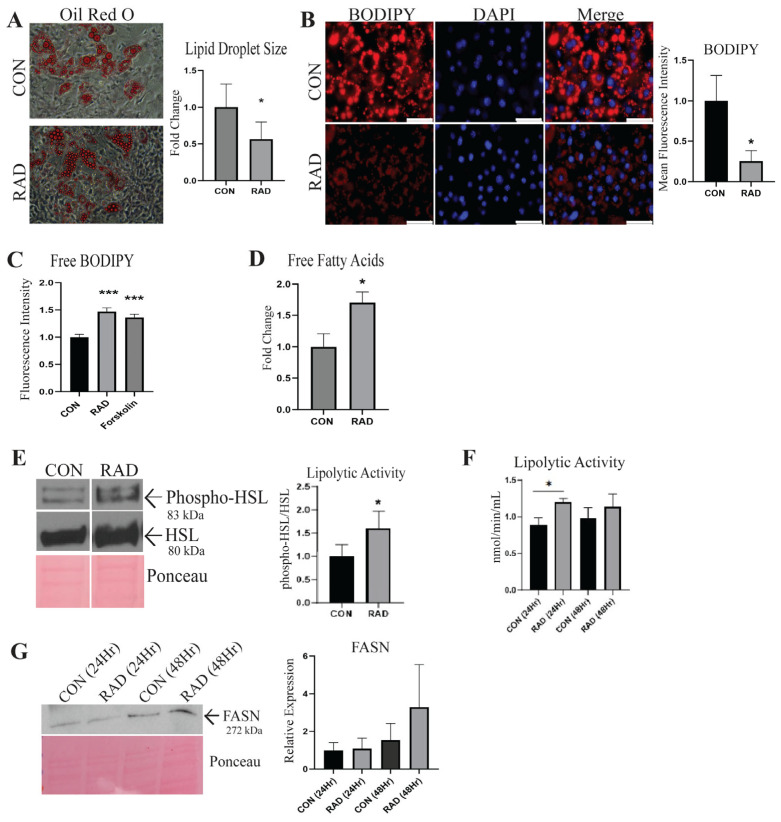
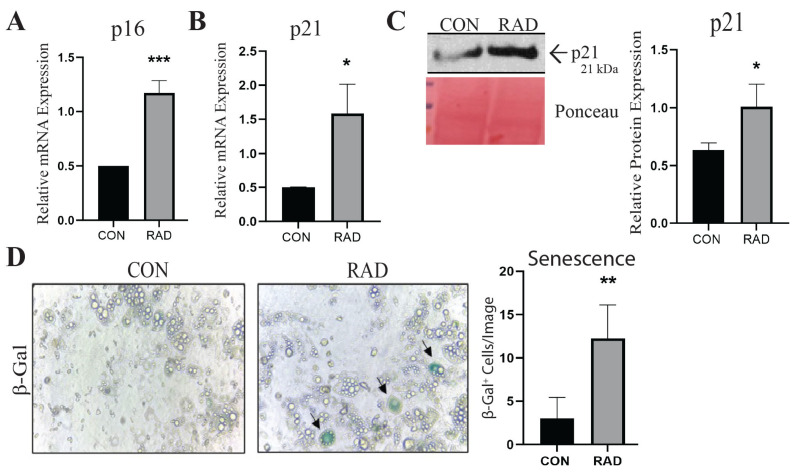
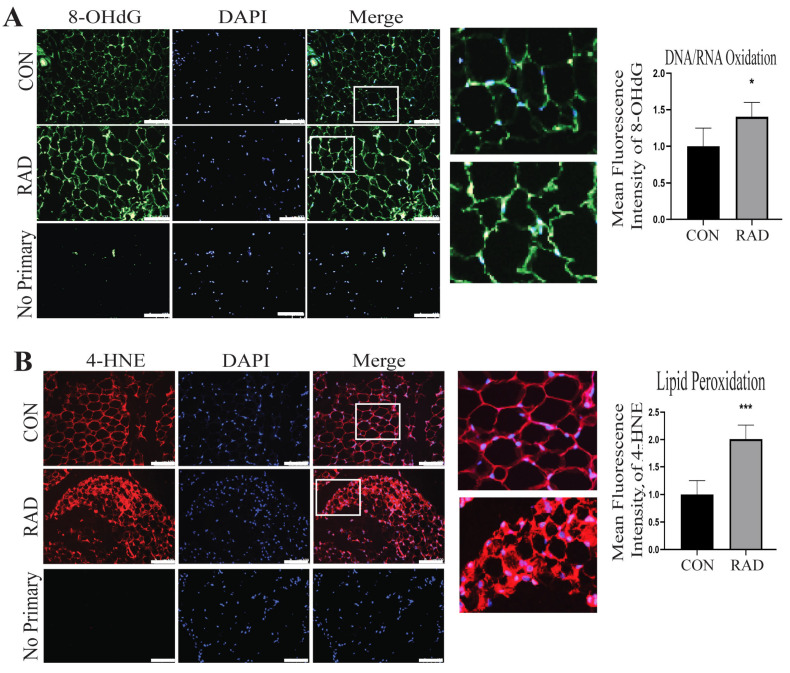
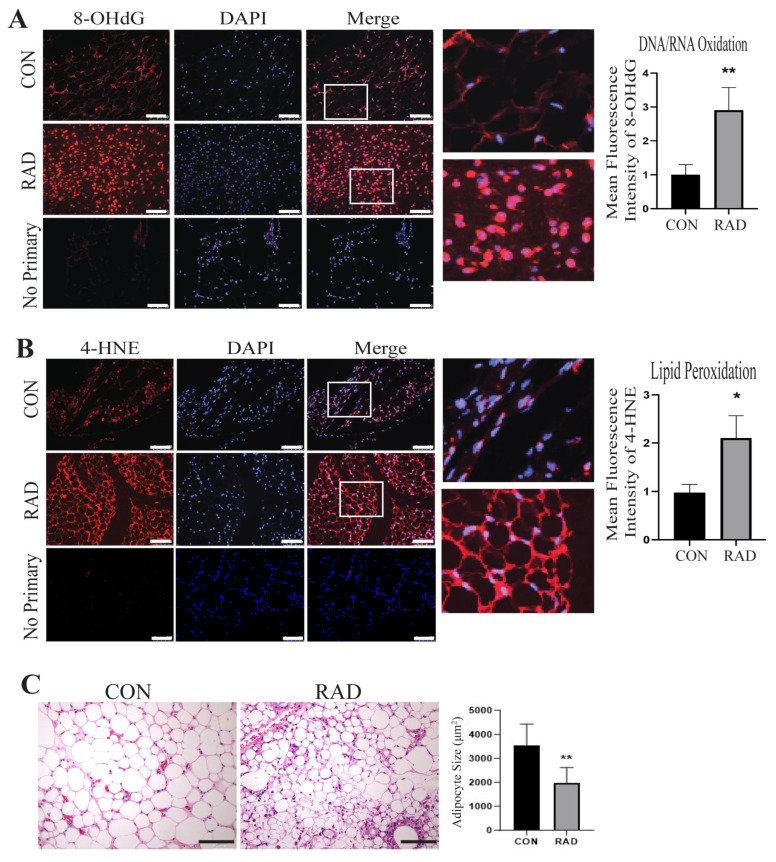
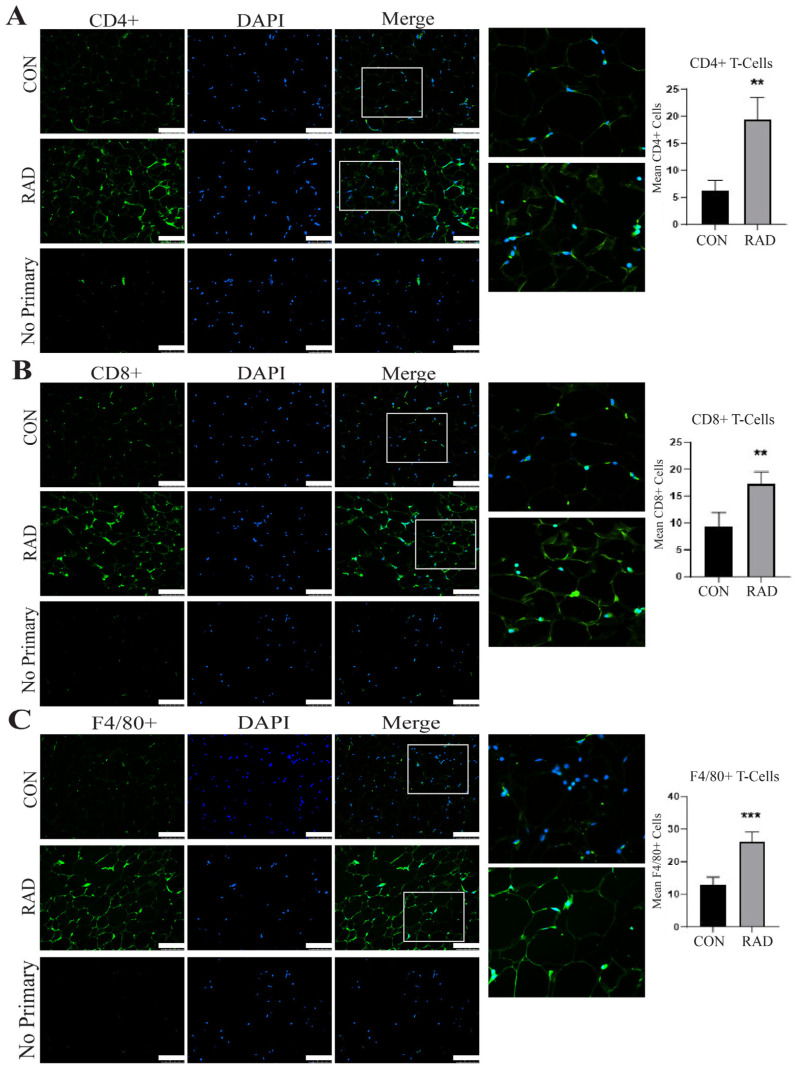
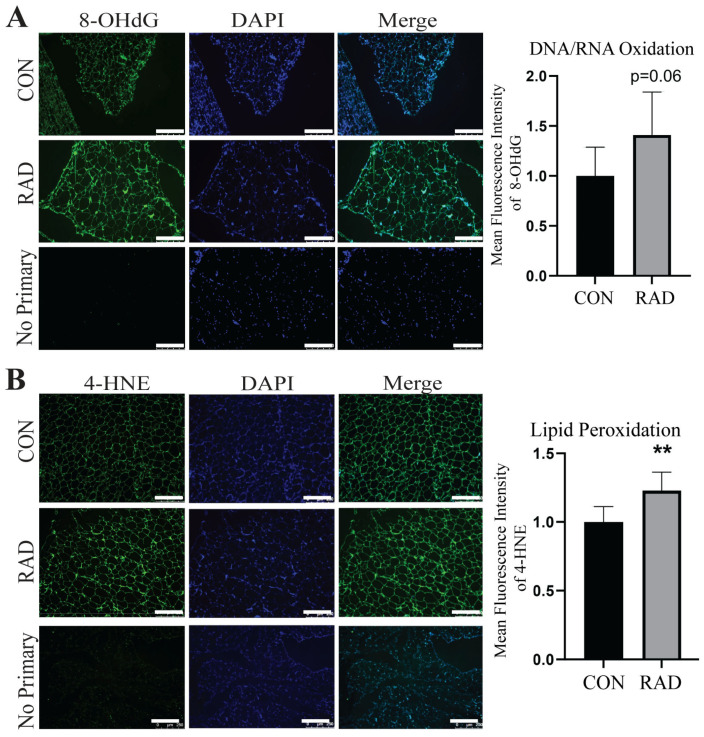
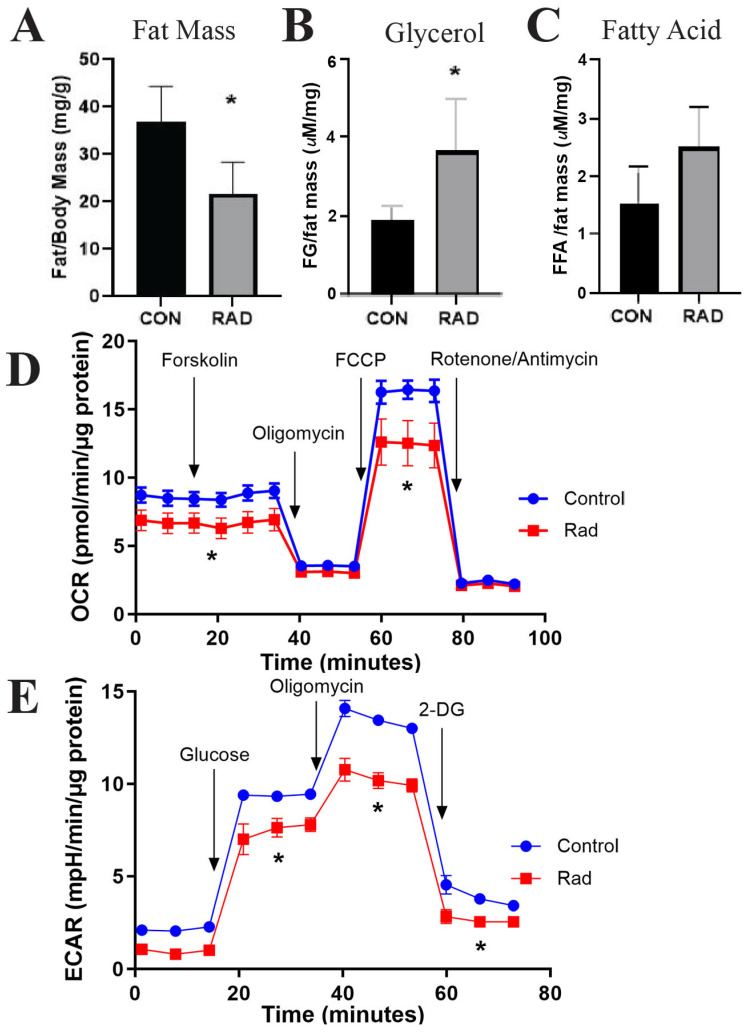
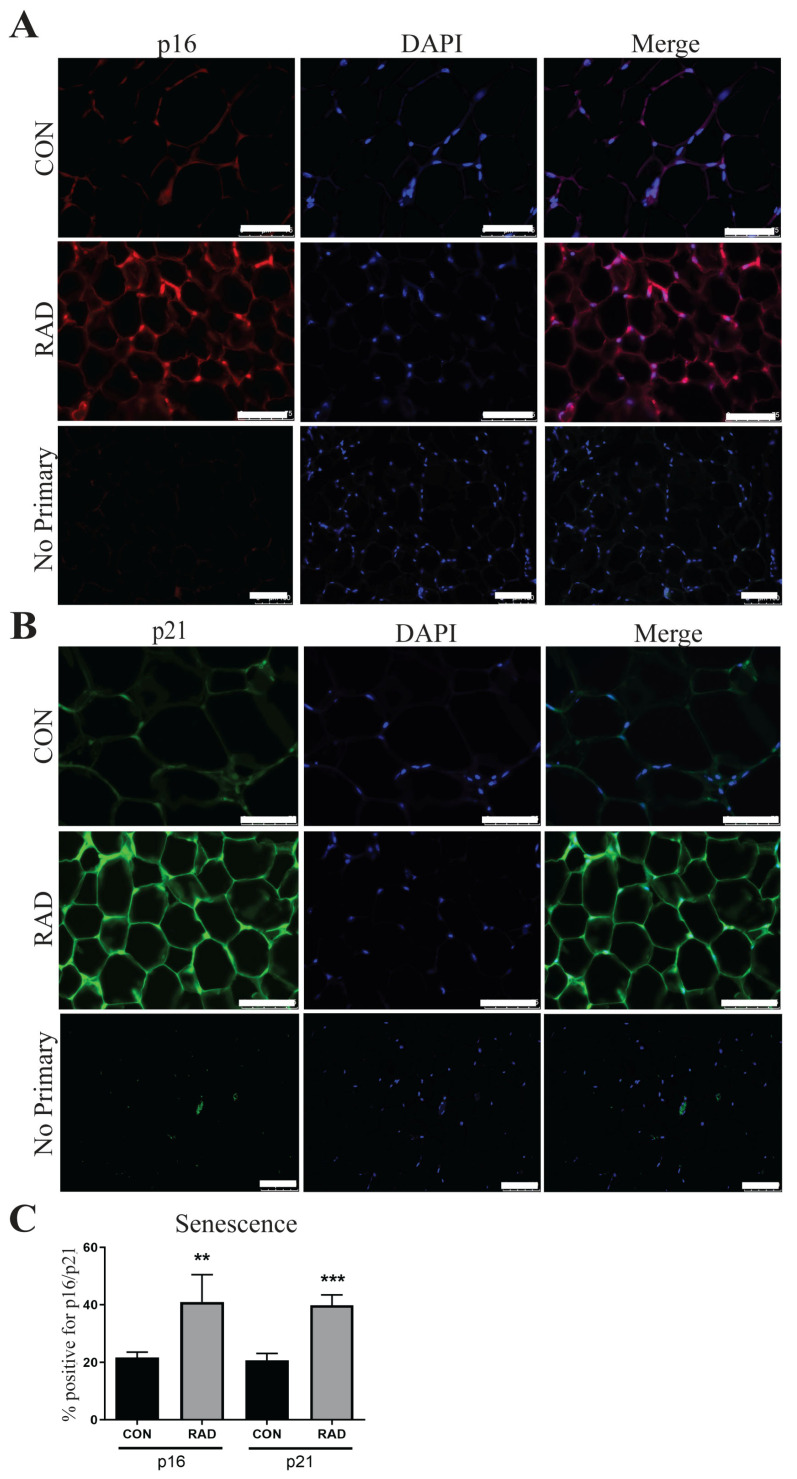
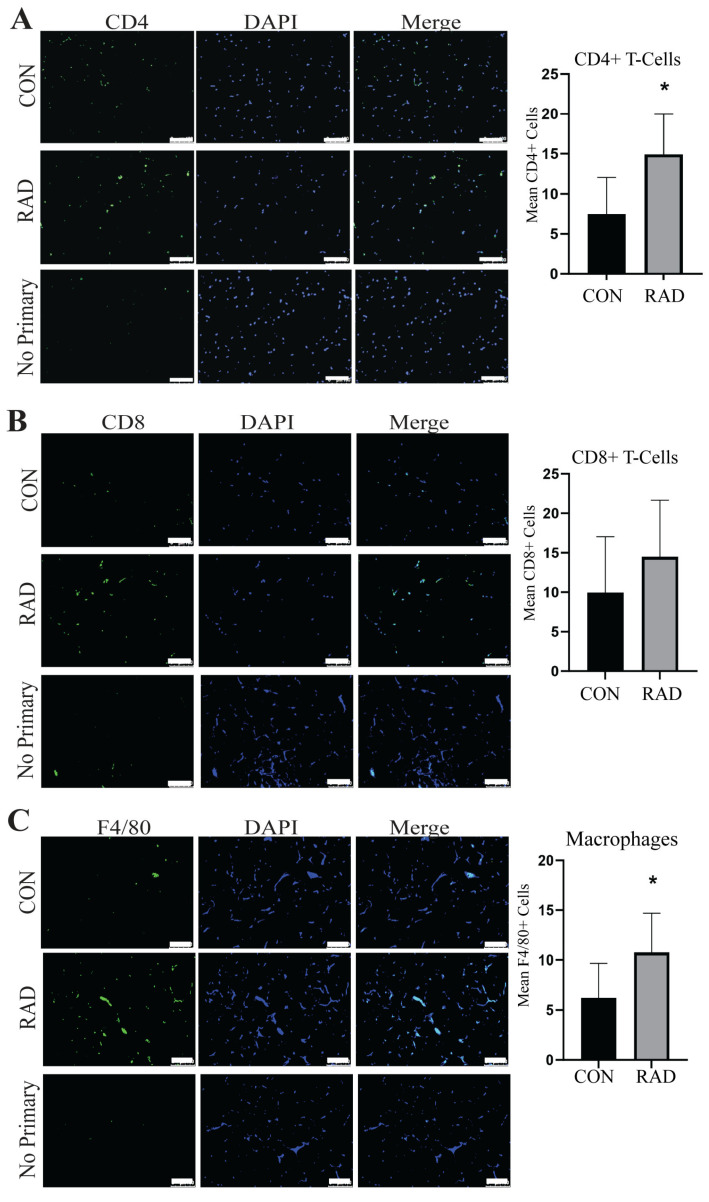
Radiotherapy is commonly used for treating various types of cancer. In addition, adipose tissue is not routinely spared during typical radiation treatment. Although radiation is known to induce metabolic effects in patients, the effects of radiation therapy on adipose tissue have not been elucidated. Currently, few studies have investigated the impact of radiation exposure on adipose tissue, and these have primarily involved whole-body irradiation. This study aimed to understand the acutely persistent damage caused by clinically relevant radiation doses in adipocytes. Specifically, in vitro and in vivo, irradiated adipocytes increased reactive oxygen species (ROS) and lipid peroxidation levels and elevated lipolytic activity compared to unirradiated adipocytes. RNA sequencing also revealed the upregulation of senescence and inflammation pathways. We observed an increase in macrophage and T-cell accumulation at both 1 and 6 months after radiation exposure using in vivo models. Many of the changes observed in irradiated adipose tissue, including oxidative stress, metabolic dysfunction, inflammation, and senescence, are consistent with those observed in adipose tissue from obese patients, in which obesity is a known driver of many cancers. As adipose tissue damage is maintained chronically, protecting adipose tissue from the harmful effects of radiation exposure may improve radiation-induced toxicity and reduce cancer recurrence and progression.

Keywords: adipose tissue; inflammation; metabolism; oxidative stress; radiation; senescence.


Conflict of interest statement

The authors declare no conflicts of interest.

Figures

Figure 1
Figure 1
Radiation causes oxidative stress in 3T3-L1 adipocytes. 3T3-L1 adipocytes were irradiated with 0 Gy (CON) or 3 Gy for 3 days (RAD). (A) Two days after radiation, adipocytes were fixed and stained for 8-OHdG, a marker of DNA/RNA oxidation (green) or DAPI (blue), and (B) 4-HNE, an indication of lipid peroxidation (green). (C) Total ROS and superoxide levels were quantified in adipocytes 48 h following radiation or sham via DHE staining. (D) MitoSOX staining was used to quantify mitochondrial superoxide, and (E) BODIPY C11 to quantify lipid peroxidation in CON and RAD adipocytes 48 h post-radiation. (F) Viability was not altered in adipocytes treated with radiation. Six random fields of view per independent replicate (n = 3) were averaged for quantification. The white bar represents 100 µm. * and ** indicate a significant difference (p ≤ 0.05 and p ≤ 0.01, respectively; n = 3) from the control.
Figure 2
Figure 2
Radiation causes metabolic dysfunction in adipocytes. (A) Oil Red O was used to stain neutral lipids within adipocytes treated with 0 Gy (CON) or 3 Gy (RAD) and to quantify lipid droplet size (red color indicates lipids, average of 100 lipid droplets/image, 4 images/biological replicate, n = 3). Image was taken at 30× magnification. (B) BODIPY (red stain) was used to stain and quantify lipids within the CON and RAD adipocytes. (C) Quantification of BODIPY fluorescence in the medium of CON and RAD adipocytes 48 h post-radiation. The white bar represents 100 µm. (D) Quantification of free fatty acids found within the conditioned media of CON and RAD adipocytes 72 h post-radiation. (E) Representative western blots of phospho-HSL (Ser565), total HSL, and Ponceau, a loading control. Lipolytic activity was measured by normalizing the densitometry of phospho-HSL to total HSL. (F) Lipolytic activity of CON and RAD adipocytes 24 and 48 h after radiation. (G) Representative blots with loading control (Ponceau). FASN (normalized to Ponceau) was measured by western blotting in adipocytes 24 and 48 h after radiation. * and *** indicate a significant difference (p ≤ 0.05 and p ≤ 0.01, respectively; n = 3) from the control, as measured using Student’s t-test.
Figure 3
Figure 3
Irradiated adipocytes undergo cellular senescence 7 days after radiation exposure. (A) RT-PCR was used to measure the presence and relative abundance of p16 and (B) p21 mRNA expression in unirradiated (CON) and irradiated (RAD) and 3T3 adipocytes. (C) Representative western blots and quantification of p21 protein expression (normalized to ponceau, loading control) in CON and RAD adipocytes. (D) Representative images and quantification of β-Gal staining in CON and RAD adipocytes. Image was taken at 30× magnification. In the representative images, black arrows point toward β-Gal+ cells. *, **, and *** indicate significant differences (p ≤ 0.05, 0.01, and 0.001, respectively; n = 3) compared to the control, as measured using Student’s t-test.
Figure 4
Figure 4
In vivo, irradiated adipose tissue acutely sustains oxidative damage. To assess radiation-induced oxidative damage in murine adipose tissue, mice were irradiated with 7.5 Gy of radiation for 5 days (RAD) or 0 Gy (CON). Adipose tissue was harvested one month post-radiation. (A) Adipose tissue sections were stained for 8-OHdG, an indicator of DNA/RNA oxidation (green color), and (B) 4-HNE, an indicator of lipid peroxidation (red color, 5 images/mouse, 5 mice/group). White box is the area that is magnified 10× and shown at the immediate right. * and *** indicates a significant difference (p ≤ 0.05 and p ≤ 0.001, respectively) compared to the control. The white bar represents a distance of 100 µm.
Figure 5
Figure 5
Two months post-radiation, adipose tissues exhibit signs of oxidative damage. To assess radiation-induced oxidative damage in murine adipose tissue, mice were irradiated with 7.5 Gy of radiation for 5 days (RAD) or 0 Gy (CON). Adipose tissue was harvested two months post-radiation. (A) Adipose tissue sections were stained for 8-OHdG, (red color) an indicator of DNA/RNA oxidation, DAPI is stained in blue, and (B) 4-HNE, an indicator of lipid peroxidation (red color) (5 images/mouse, 5 mice/group). The white bar represents a distance of 100 µm. White box is the area that is magnified 10× and shown at the immediate right. (C) Adipose tissue slides were stained with H&E. A total of 150 adipocytes/images were traced and size-quantified (5 images/mouse, 5 mice/group). The black bar represents 100 µm. * and ** indicates a significant difference (p ≤ 0.05 and p ≤ 0.01, respectively) compared to the control.
Figure 6
Figure 6
Radiation increases immune infiltration acutely in murine adipose tissue. Adipose tissue was collected one month after the mice were irradiated with 7.5 Gy × 5 days (RAD) or unirradiated (CON). Immunofluorescence staining was completed to quantify immune infiltration. (A) CD4+ T-cells (green staining) DAPI is blue stain, (B) CD8+ T-cells (green staining), and (C) F4/80+ cells (green staining) were quantified in 5 images per mouse and 5 mice per group. White box is the area that is magnified 10× and shown at the immediate right. The white bar represents a distance of 100 µm. ** and *** indicate a significant difference (p ≤ 0.01 and p ≤ 0.001, respectively) compared to the control.
Figure 7
Figure 7
Radiation causes chronic oxidative damage to adipose tissue. The mice received 7.5 Gy of radiation for 5 days to the pelvis (RAD) and control (CON) 6 months post-radiation. (A) Representative images and adipose tissue sections stained with 8-OHdG, an indicator of DNA/RNA oxidative damage, and quantification (8-OHdG = green, DAPI = blue). (B) Representative images of adipose tissue sections stained with 4-HNE, an indicator of lipid peroxidation, and quantification (4-HNE = green, DAPI = blue). Six or more images were randomly collected and analyzed per mouse (n = 5 mice/group). The white bar indicates 250 µm. ** = p ≤ 0.01.
Figure 8
Figure 8
Metabolic dysfunction is observed in irradiated adipose tissue. The mice were exposed to 7.5 Gy of pelvic radiation for 5 days. (A) Six months after radiation, the mass of the adipose tissue (mg) was collected and normalized to body mass (g). (B) Free glycerol and (C) free fatty acids were measured and quantified from the mice’s serum. (D) Oxygen consumption rate (OCR) and (E) extracellular acidification rate (ECAR) were quantified via Seahorse from adipocytes isolated from control and irradiated murine adipose tissues. n = 5 mice/group and * indicates a significant difference (p ≤ 0.05) compared to the control.
Figure 9
Figure 9
Markers of senescence remain elevated in irradiated adipose tissue 6 months after radiation exposure. (A) Representative images of adipose tissue sections from control and irradiated mice were collected and stained for p16, an indicator of senescence (p16 = red, DAPI = blue). (B) Adipose tissue sections were stained for p21, a senescence marker (p21 = green, DAPI = blue). (C) Quantification of p16 and p21. Each group represents a minimum of six fields/mouse, 5 mice/group. The white bar represents 100 µm. ** and *** indicates significant difference (p ≤ 0.01 and p ≤ 0.001) from the control.
Figure 10
Figure 10
Immune infiltration remains present in adipose tissue 6 months after radiation exposure, 7.5 Gy for 5 days. (A) Representative images and quantification of adipose tissues stained for CD4+ T-cells (green staining) and DAPI blue staining in unirradiated (CON) and irradiated (RAD) adipose tissue sections collected from the mice 6 months after exposure to pelvic radiation. (B) CD8+ T-cell (green staining) and (C) F4/80+ macrophage (green staining) in CON and RAD adipose tissue 6 months post-radiation. A minimum of six fields/mouse were analyzed at random from the positive staining (≥6 fields/mouse, 8 mice/group). The white bar represents 100 µm and * indicates a significant difference (p ≤ 0.05) from the control.

Similar articles

Cited by

References

    1. Emont M.P., Jacobs C., Essene A.L., Pant D., Tenen D., Colleluori G., Di Vincenzo A., Jorgensen A.M., Dashti H., Stefek A., et al. A single-cell atlas of human and mouse white adipose tissue. Nature. 2022;603:926–933. doi: 10.1038/s41586-022-04518-2. - DOI - PMC - PubMed
    1. Kershaw E.E., Flier J.S. Adipose tissue as an endocrine organ. J. Clin. Endocrinol. Metab. 2004;89:2548–2556. doi: 10.1210/jc.2004-0395. - DOI - PubMed
    1. Kahn S.E., Hull R.L., Utzschneider K.M. Mechanisms linking obesity to insulin resistance and type 2 diabetes. Nature. 2006;444:840–846. doi: 10.1038/nature05482. - DOI - PubMed
    1. Oikonomou E.K., Antoniades C. The role of adipose tissue in cardiovascular health and disease. Nat. Rev. Cardiol. 2019;16:83–99. doi: 10.1038/s41569-018-0097-6. - DOI - PubMed
    1. Duval C., Thissen U., Keshtkar S., Accart B., Stienstra R., Boekschoten M.V., Roskams T., Kersten S., Muller M. Adipose tissue dysfunction signals progression of hepatic steatosis towards nonalcoholic steatohepatitis in C57BL/6 mice. Diabetes. 2010;59:3181–3191. doi: 10.2337/db10-0224. - DOI - PMC - PubMed

Substances

LinkOut - more resources