. 2025 Jun 13;26(12):5666.
doi: 10.3390/ijms26125666.

Genome-Wide Characterization and Expression Profile of the Jumonji-C Family Genes in Populus alba × Populus glandulosa Reveal Their Potential Roles in Wood Formation

Affiliations

Genome-Wide Characterization and Expression Profile of the Jumonji-C Family Genes in Populus alba × Populus glandulosa Reveal Their Potential Roles in Wood Formation

Zhenghao Geng et al. Int J Mol Sci. .

Abstract

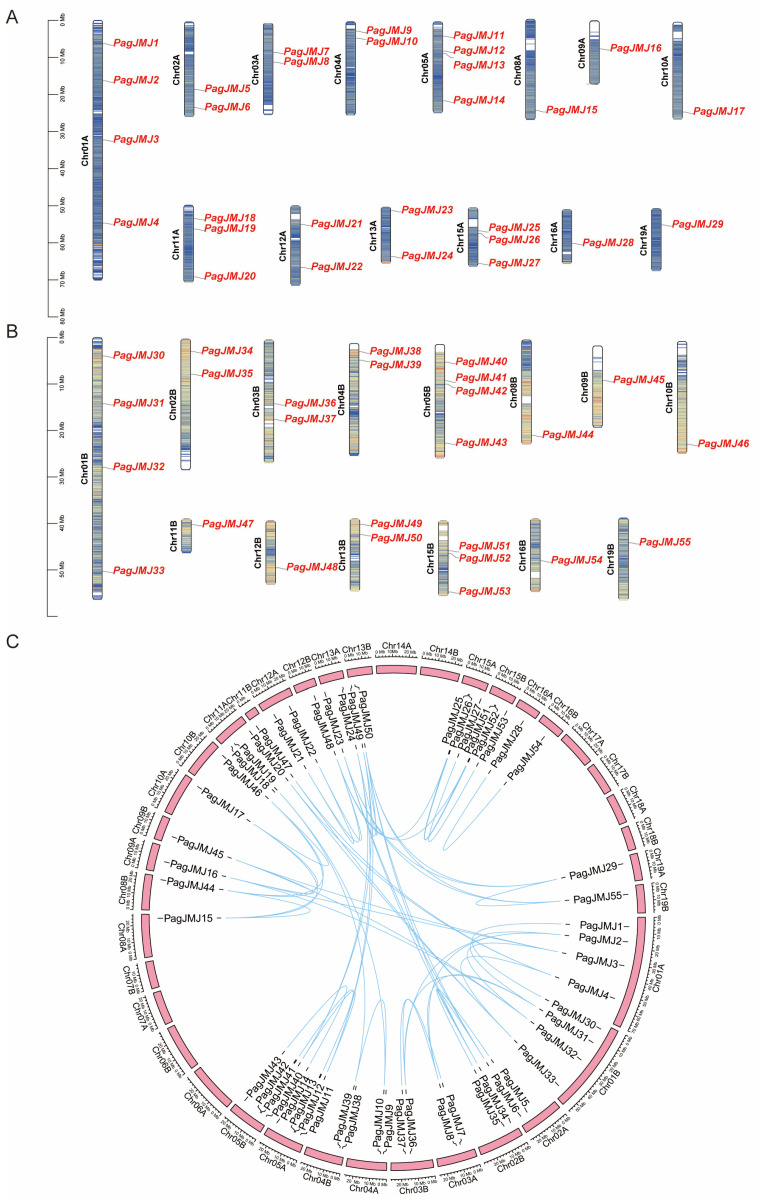
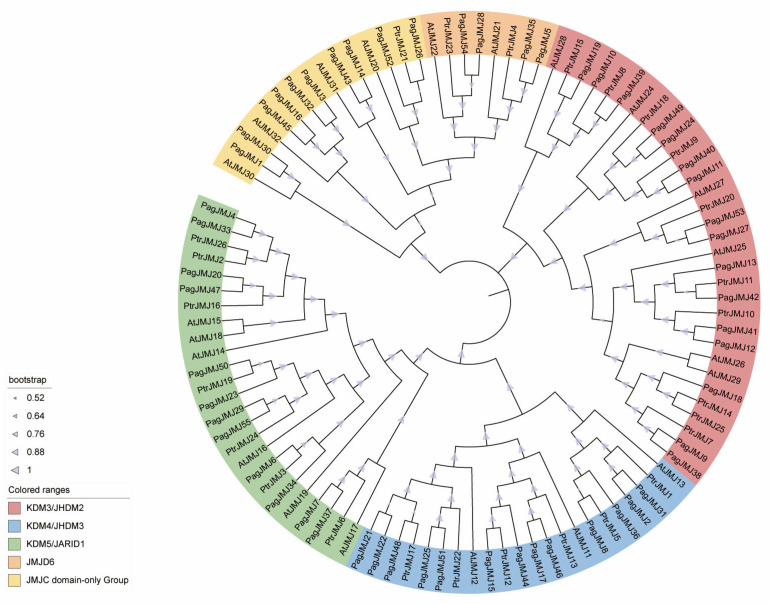
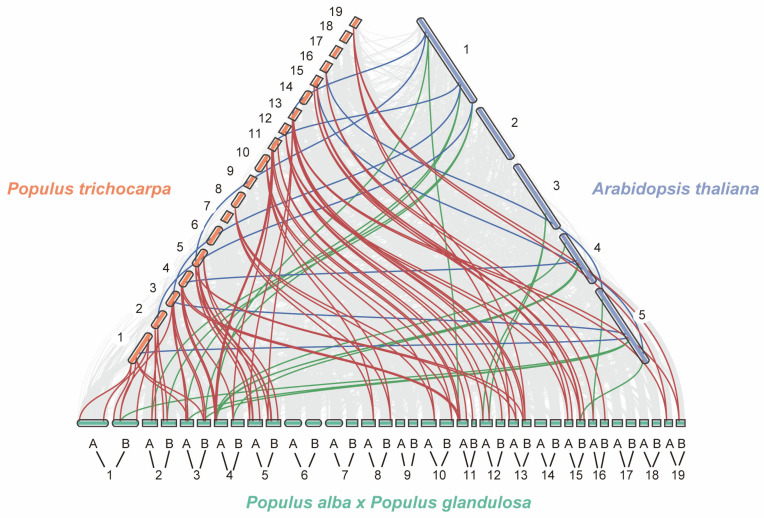
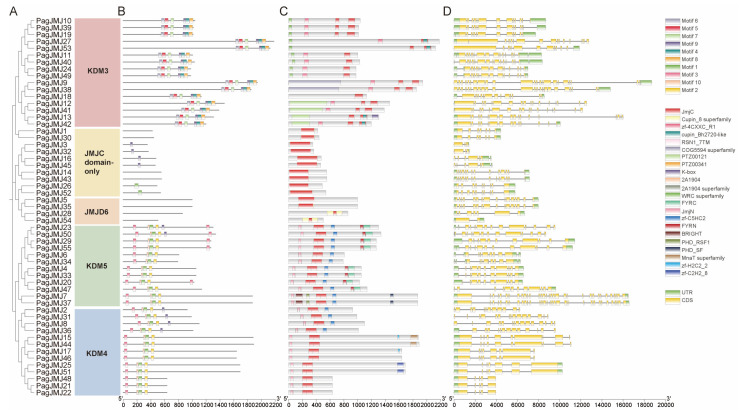
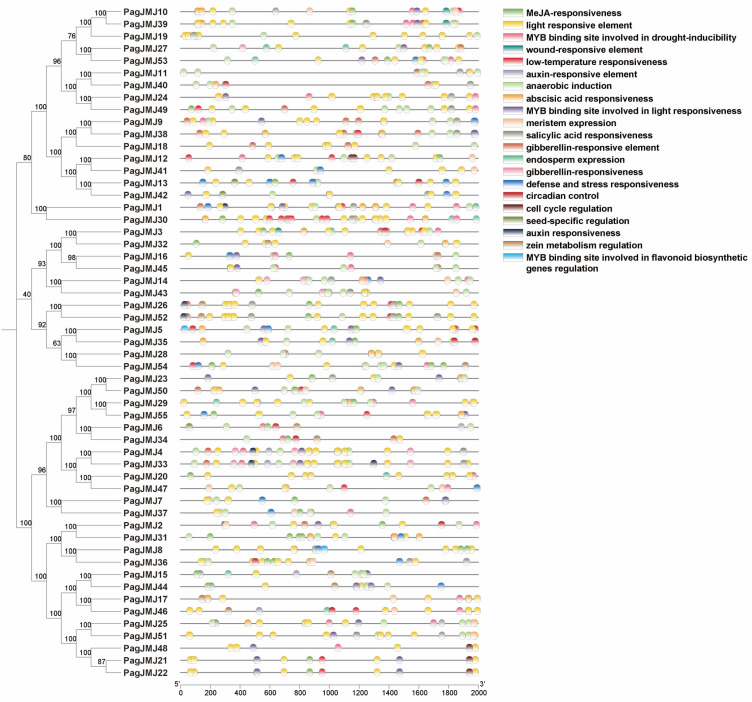
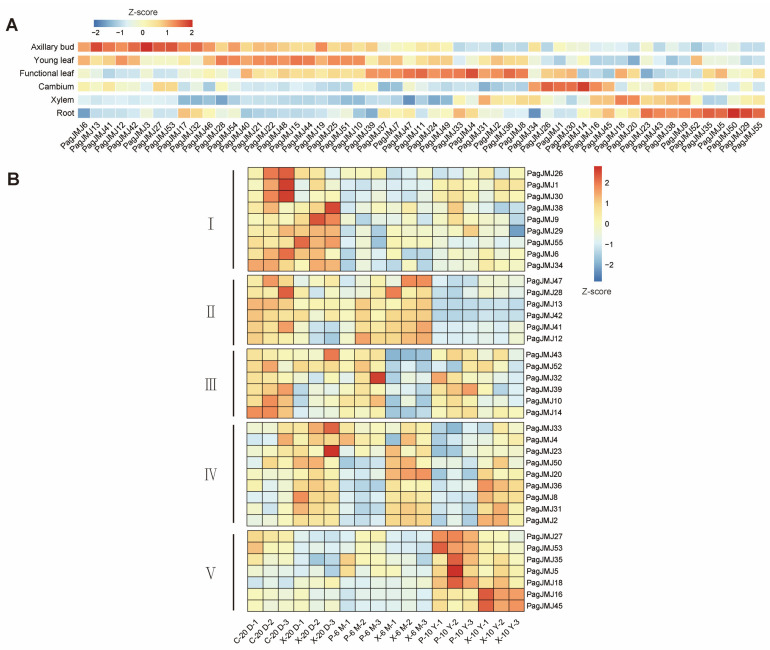
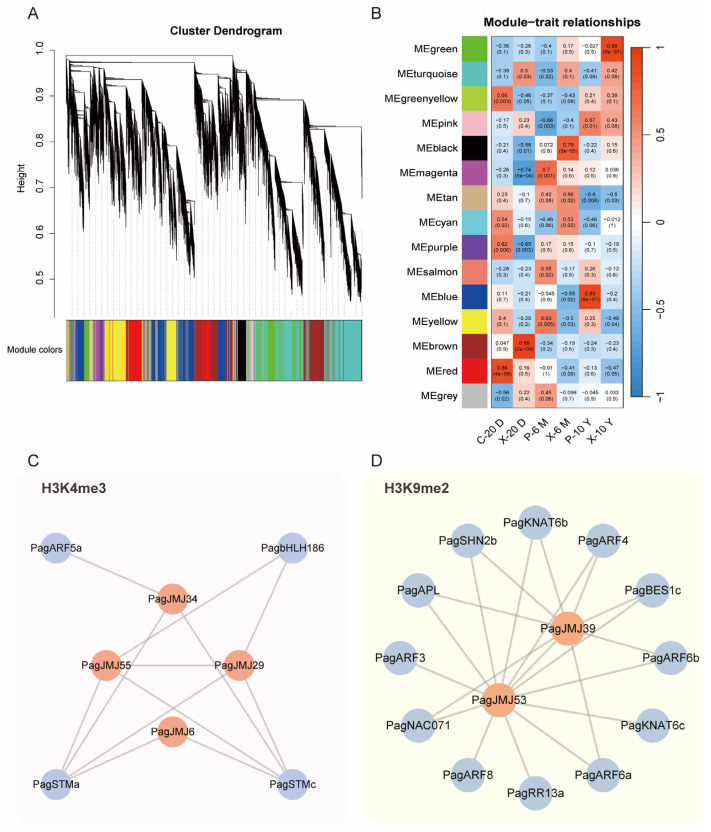
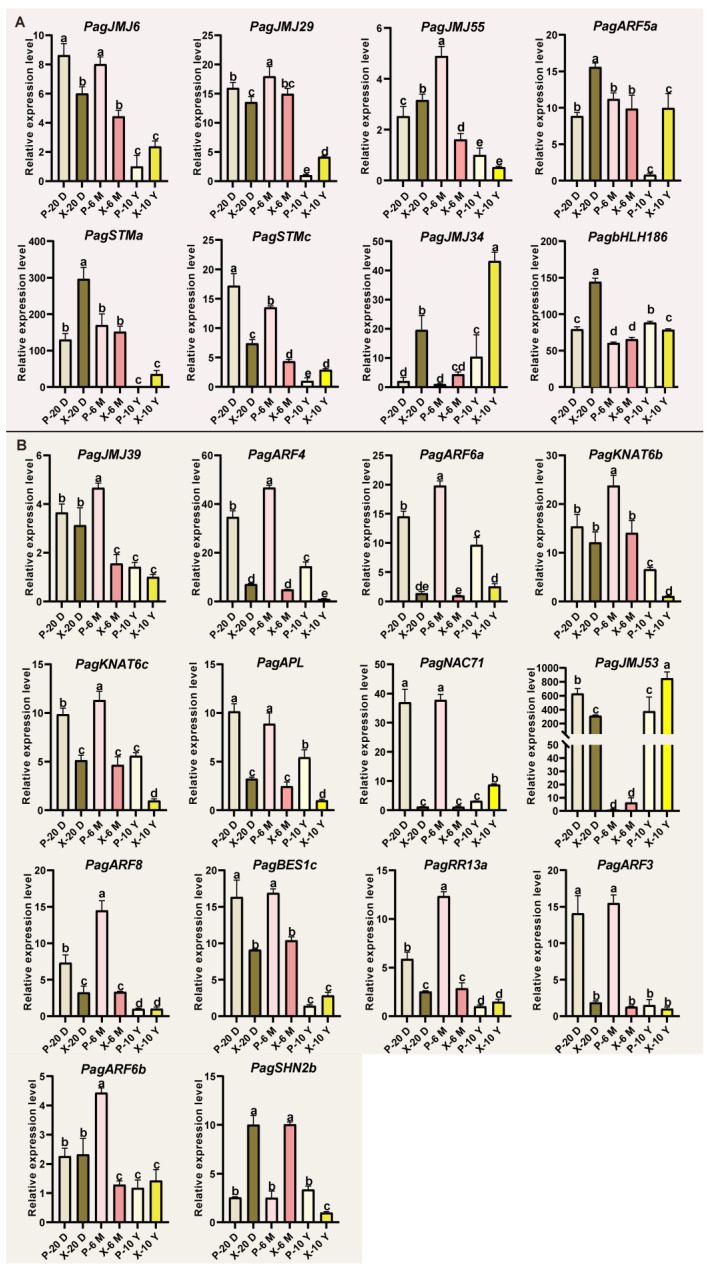
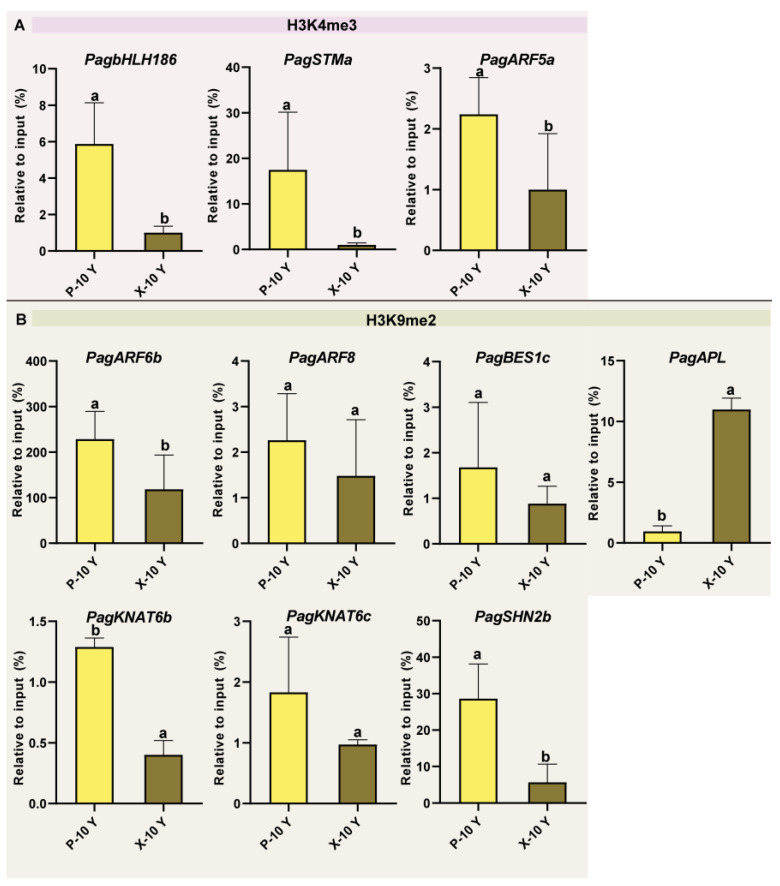
The Jumonji C (JMJ-C) domain-containing gene family regulates epigenetic and developmental processes in plants. We identified 55 JMJ-C genes in Populus alba × Populus glandulosa using HMM and BLASTp analyses. Chromosomal mapping revealed an asymmetric distribution with conserved synteny. Phylogenetic reconstruction revealed that PagJMJ genes segregate into five evolutionarily conserved subfamilies, exhibiting classification patterns identical to those of Arabidopsis thaliana and Populus trichocarpa. Synteny analysis indicated a closer relationship with P. trichocarpa than with A. thaliana. Motif and promoter analyses highlighted subfamily-specific features and diverse cis-elements, particularly light-responsive motifs. Expression profiling revealed tissue-specific patterns, with key genes enriched in roots, vascular tissues, and leaves. Developmental analysis in cambium and xylem identified four expression clusters related to wood formation. Co-expression analysis identified six key PagJMJ genes (PagJMJ6, 29, 34, 39, 53, and 55) strongly associated with wood formation-related transcription factors. ChIP-qPCR analysis revealed that key genes co-expressed with PagJMJ genes were marked by H3K4me3 and H3K9me2 modifications. These findings provide insights into the evolutionary and functional roles of PagJMJ genes in poplar vascular development and wood formation.

Keywords: JMJ-C family; P. alba × P. glandulosa; expression profile; transcription factor; wood formation.


Conflict of interest statement

The authors declare no conflicts of interest.

Figures

Figure 1
Figure 1
Chromosome distribution and synteny analysis of PagJMJ genes in P. alba × P. glandulosa. (A) Chromosomal localization of PagJMJ genes across the 12 chromosomes of the A genome in P. alba × P. glandulosa. (B) Chromosomal localization of PagJMJ genes across the 12 chromosomes of the B genome in P. alba × P. glandulosa. (C) Comparative analysis of the distribution and syntenic relationships within the PagJMJ gene family, with syntenic gene pairs illustrated by blue connecting lines.
Figure 2
Figure 2
Phylogenetic analysis of JMJ-C family proteins in three plant species. A phylogenetic tree of JMJ-C proteins from P. alba × P. glandulosa, P. trichocarpa, and Arabidopsis thaliana. The tree was constructed using the ClustalW and Neighbor-Joining (NJ) method, with 1000 bootstrap replicates in MEGA 12.0. Based on sequence homology, JMJ-C proteins were classified into five distinct subfamilies: KDM4/JHDM3, KDM5/JARID1, JMJD6, KDM3/JHDM2, and JMJ-C domain-only. These subfamilies are represented by different colored blocks, as illustrated in the lower left corner of the figure.
Figure 3
Figure 3
Collinear analysis of PagJMJ genes in P. alba × P. glandulosa with P. trichocarpa and A. thaliana. Collinear analysis of PagJMJ genes from P. alba × P. glandulosa was performed with two related species, P. trichocarpa and A. thaliana. Red boxes indicate chromosomes of P. trichocarpa, blue boxes indicate chromosomes of A. thaliana, green boxes indicate chromosomes of P. alba × P. glandulosa. Red lines highlight the collinear JMJ-C gene pairs between P. trichocarpa and P. alba × P. glandulosa. Blue lines represent the collinear JMJ-C gene pairs between P. trichocarpa and A. thaliana. Green lines denote the collinear JMJ-C gene pairs between P. alba × P. glandulosa and A. thaliana.
Figure 4
Figure 4
Comprehensive sequence analyses of PagJMJ genes. (A) Phylogenetic relationships of PagJMJ proteins were reconstructed using the NJ method, revealing that these proteins cluster into three distinct groups. (B) Conserved motifs within PagJMJ proteins were identified using the MEME tool (version 5.5.7), resulting in the identification of 10 unique motifs, designated as Motif 1 through Motif 10. (C) The schematic representation of conserved domains illustrates their positions and sizes, with each domain depicted as a colored square. (D) Gene structure analysis of PagJMJ genes highlighted the organization of UTRs, introns, and exons, where UTRs are shown in green, exons in yellow, and introns in grey. A scale bar of 2 kb is provided for reference.
Figure 5
Figure 5
Cis-acting elements of the PagJMJ genes. The distribution of cis-acting elements within the 2000 bp upstream promoter regions of PagJMJ genes is illustrated. Different colored circles represent distinct types of regulatory elements, highlighting their positions and abundance across the gene family.
Figure 6
Figure 6
Expression profiles of PagJMJ genes in P. alba × P. glandulosa in 20-day-old cambium (C-20 D) and xylem (X-20 D), 6-month-old phloem (P-6 M) and xylem (X-6 M), and 10-year-old phloem (P-10 Y) and xylem (X-10 Y). (A) Heatmap displaying the transcript abundance of PagJMJ genes across different tissues, including axillary buds, young leaves, functional leaves, cambium, xylem, and roots. (B) Expression patterns of PagJMJ genes with high expression levels in cambium and xylem at different developmental stages. K-means clustering analysis categorizes PagJMJ genes into five distinct clusters (I–V) based on their expression profiles. The color scale (blue to red) represents low to high expression levels.
Figure 7
Figure 7
Relationship between PagJMJ genes and potential transcription factors predicted by WGCNA. (A) Hierarchical cluster tree of gene co-expression modules, with color bands indicating 13 distinct modules. (B) Heatmap displaying the correlation between co-expression modules and tissue types. The color intensity represents the correlation coefficient, while values within the cells indicate p-values. (C,D) Co-expression networks of the brown and blue modules, showing interactions between PagJMJ genes and potential transcription factors. Red circles represent PagJMJ genes, while blue circles indicate transcription factors.
Figure 8
Figure 8
RT-qPCR analysis of PagJMJ genes and WGCNA-predicted transcription factors in xylem and phloem tissues of P. alba × P. glandulosa at different developmental stages. (A) Relative expression levels of genes from the brown module were determined by RT-qPCR. (B) Relative expression levels of genes from the blue module were determined by RT-qPCR.Expression was analyzed in phloem and xylem tissues collected from 20-day-old (P-20 D, X-20 D), 6-month-old (P-6 M, X-6 M), and 10-year-old (P-10 Y, X-10 Y) trees. Data are presented as means ± standard deviation (SD) of three biological replicates. Statistical significance was determined by one-way analysis of variance (ANOVA), and different lowercase letters indicate significant differences among samples (p < 0.05).
Figure 9
Figure 9
Detection of H3K4me3 (A) and H3K9me2 (B) levels at specific genes. Phloem and xylem tissues collected from 10-year-old (P-10 Y, X-10 Y) trees were used for the ChIP-qPCR assays with anti-H3K4me3 and anti-H3K9me3 antibodies. Data are presented as means ± standard deviation (SD) of three biological replicates. Statistical significance was determined by one-way analysis of variance (ANOVA), and different lowercase letters indicate significant differences among samples (p < 0.05).

Similar articles

References

    1. Skvortsova K., Iovino N., Bogdanović O. Functions and mechanisms of epigenetic inheritance in animals. Nat. Rev. Mol. Cell Biol. 2018;19:774–790. doi: 10.1038/s41580-018-0074-2. - DOI - PubMed
    1. Allis C.D., Jenuwein T. The molecular hallmarks of epigenetic control. Nat. Rev. Genet. 2016;17:487–500. doi: 10.1038/nrg.2016.59. - DOI - PubMed
    1. Zhang H., Zhu J.-K. Epigenetic gene regulation in plants and its potential applications in crop improvement. Nat. Rev. Mol. Cell Biol. 2024;26:51–67. doi: 10.1038/s41580-024-00769-1. - DOI - PubMed
    1. Law J.A., Jacobsen S.E. Establishing, maintaining and modifying DNA methylation patterns in plants and animals. Nat. Rev. Genet. 2010;11:204–220. doi: 10.1038/nrg2719. - DOI - PMC - PubMed
    1. Xue Y., Cao X., Chen X., Deng X., Deng X.W., Ding Y., Dong A., Duan C.G., Fang X., Gong L., et al. Epigenetics in the modern era of crop improvements. Sci. China Life Sci. 2025;68:1570–1609. - PubMed

LinkOut - more resources