. 2025 Jun 13;26(12):5679.
doi: 10.3390/ijms26125679.

Two Peas in a Pod: Retroviral RNA Dimers Organize Gag-RNA Nanoclusters with Novel Biophysical Properties

Affiliations

Two Peas in a Pod: Retroviral RNA Dimers Organize Gag-RNA Nanoclusters with Novel Biophysical Properties

Gregory S Lambert et al. Int J Mol Sci. .

Abstract

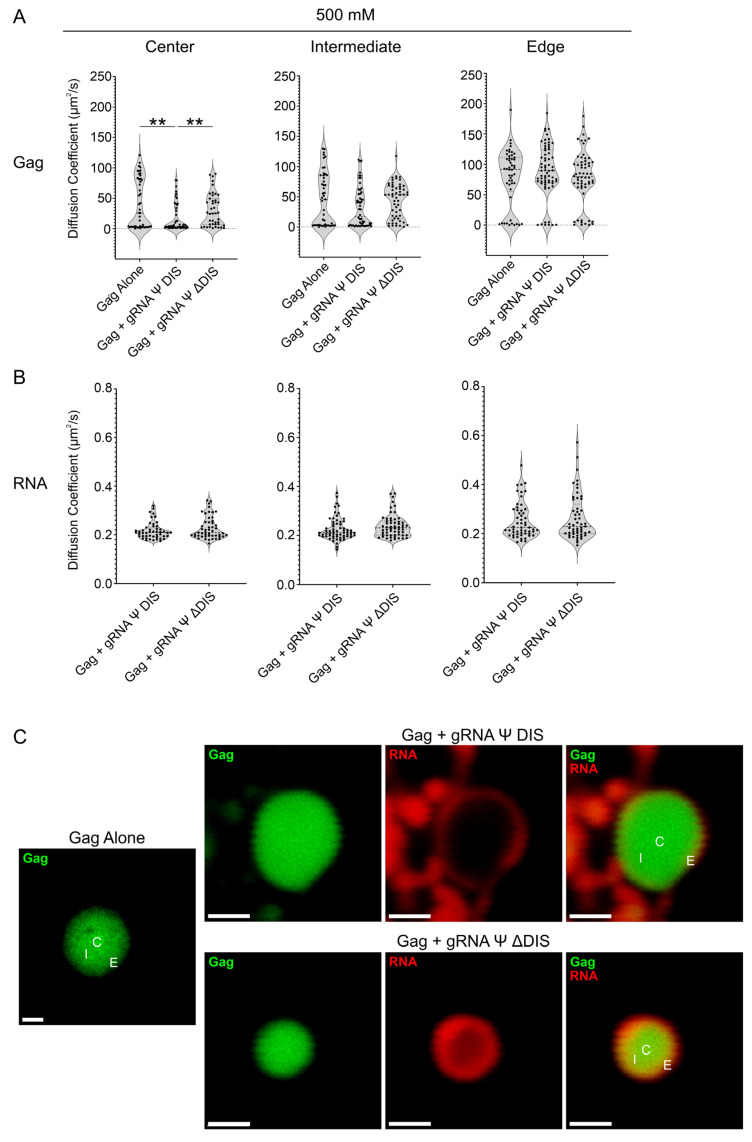
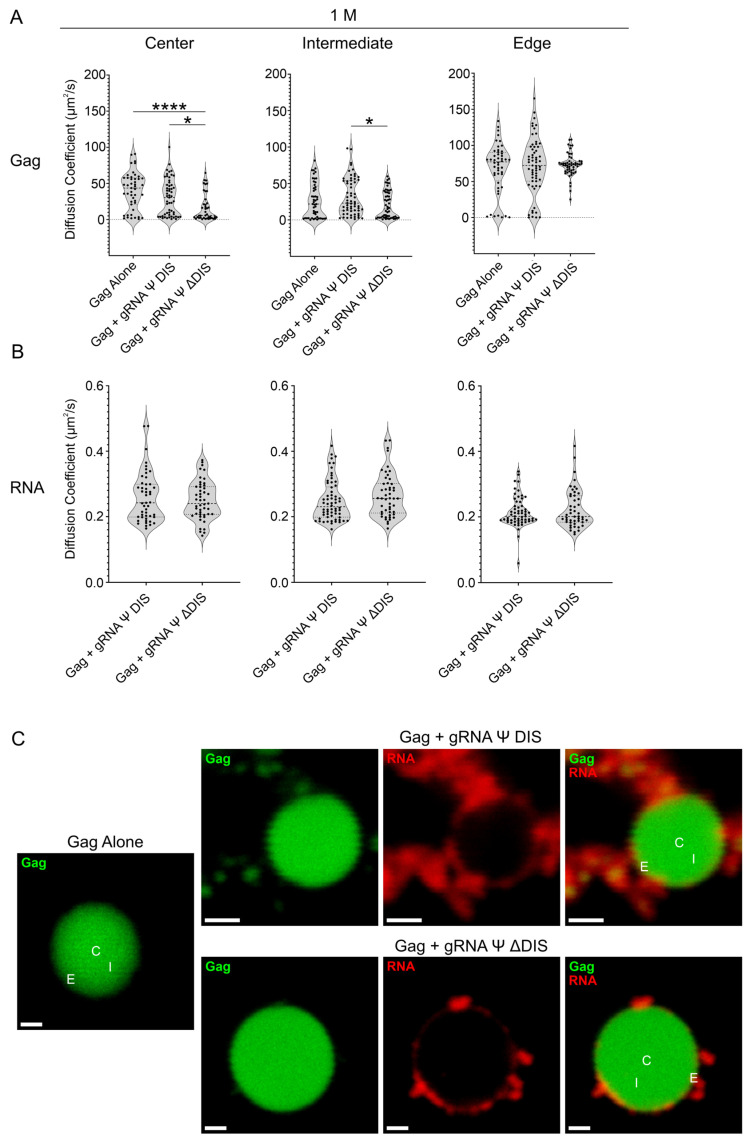
The continued effective control of retroviral infections will no doubt require the development of new clinical interventions targeting underexploited areas of retroviral biology such as genome selection and virion assembly. In our previous work, we demonstrated that both the Gag-psi (Ψ) interaction and genomic RNA (gRNA) dimerization each uniquely contribute to the formation, morphology, and stability of Rous sarcoma virus (RSV) Gag-viral RNA (vRNA) biomolecular condensates (BMCs). The present work builds upon those observations, utilizing atomic force microscopy (AFM) and fluorescence correlation spectroscopy (FCS) to elucidate the nanoscale morphology, resistance to mechanical deformation, and constituent diffusivity of RSV Gag-vRNA BMCs. These approaches revealed a novel role for gRNA dimerization in nanoscale condensate architecture and mechanical stability that aids in our understanding of why gRNA dimerization is critical for efficient packaging of the retroviral genome. Further biophysical characterization of RSV Gag-gRNA BMCs therefore possesses great potential to reveal novel avenues for therapeutic intervention.

Keywords: Rous sarcoma virus; atomic force microscopy; biomolecular condensates; biophysics; dimerization; fluorescence correlation spectroscopy; genome selection; retroviruses.


Conflict of interest statement

The authors declare no conflicts of interest.

Figures

Figure 1
Figure 1
Schematics of RSV Gag.ΔPR and gRNA Constructs. (A) The recombinant Rous sarcoma virus (RSV) Gag.ΔPR protein contains the matrix (MA), p2, p10, capsid (CA), and nucleocapsid (NC) domains, but lacks the carboxy-terminal protease (PR) domain responsible for autoproteolysis of this multidomain protein. Recognition of the psi (Ψ) packaging sequence in the viral genomic RNA (gRNA) is mediated by the NC domain, and both the NC and MA domains nonspecifically interact with other nucleic acids. Two intrinsically disordered regions (IDRs; amino acids ~102–234 and ~494–577) contribute to the formation of biomolecular condensates (BMCs) by this protein. (B) Schematic depicting the gRNA Ψ DIS and gRNA Ψ ΔDIS RNAs that are used in this manuscript. Regions encoding these RNAs are indicated in relation to the unspliced viral RNA from which they are derived; Ψ, psi packaging signal; DIS, dimerization initiation sequence; DLS, dimerization linkage structure. Figure adapted from Lambert et al., 2025 [54], PMID: 39861886.
Figure 2
Figure 2
Confocal and atomic force microscopy (AFM) analysis of RSV Gag–vRNA co-condensate morphology. Condensate morphology was assessed using both confocal (A,C,E) and atomic force microscopy (B,D,F) for RSV Gag alone (A,B), RSV Gag + gRNA Ψ DIS (C,D), and RSV Gag + gRNA Ψ ΔDIS (E,F). For fluorescence microscopy images (A,C,E), raw images were deconvolved and used to generate three-dimensional surfaces in Imaris Image Analysis Software. Both surface renderings (left panels) and orthogonal clipping plane images (right panels) are depicted. Regions boxed in the top set of images are enlarged below. Scale bars are either 2 μm (whole field, top panels) or 1 μm (enlarged boxed regions, bottom panels). For atomic force microscopy images (B,D,F), regions boxed in (a) are enlarged to the right. Three-dimensional renderings at 60° and 90° (b and c, respectively) are depicted below. Scale bars are as indicated.
Figure 3
Figure 3
RSV Gag–gRNA Ψ DIS co-condensates contain nanoclusters with increased resistance to mechanical deformation. (A) Elasticity (Young’s Modulus, kPa) values for Gag and Gag–vRNA condensates are depicted in histogram (left; bin size = 10, bin center plotted) and violin plot (right; median, first, and third quartile values displayed by dotted lines) form. Statistical significance was determined by Kruskal–Wallis test with Dunn’s post hoc test (****, p ≤ 0.0001), n ≥ 3849. (BD) Representative atomic force microscopy images (top) and modulus maps corresponding to boxed regions (bottom). Scale bars are as indicated.
Figure 4
Figure 4
Fluorescence correlation spectroscopy (FCS) diffusivity analysis of RSV Gag–vRNA condensates at 150 mM NaCl. (A,B) Violin plots containing Gag (A) and RNA (B) diffusion coefficient (μm2/s) values for Gag alone, Gag–gRNA Ψ DIS, and Gag–gRNA Ψ ΔDIS condensates as determined by FCS. Diffusivity was analyzed at three independent locations within condensates. Median, first, and third quartile values are displayed by dotted lines. Statistical significance was determined by Kruskal–Wallis test with Dunn’s post hoc test (A) (****, p ≤ 0.0001) or Mann–Whitney test (B) (n ≥ 42 for all datasets). (C) Representative images of Gag alone, Gag–gRNA Ψ DIS, and Gag–gRNA Ψ ΔDIS condensates analyzed by FCS. Scale bars = 1 μm. C, center; I, intermediate; E, edge.
Figure 5
Figure 5
Fluorescence correlation spectroscopy (FCS) diffusivity analysis of RSV Gag–vRNA condensates at 500 mM NaCl. (A,B) Violin plots containing Gag (A) and RNA (B) diffusion coefficient (μm2/s) values for Gag alone, Gag–gRNA Ψ DIS, and Gag–gRNA Ψ ΔDIS condensates as determined by FCS. Diffusivity was analyzed at three independent locations within condensates. Median, first, and third quartile values are displayed by dotted lines. Statistical significance was determined by Kruskal–Wallis test with Dunn’s post hoc test (A) (**, p ≤ 0.01) or Mann–Whitney test (B) (n ≥ 43 for all datasets). (C) Representative images of Gag alone, Gag–gRNA Ψ DIS, and Gag–gRNA Ψ ΔDIS condensates analyzed by FCS. Scale bars = 1 μm. C, center; I, intermediate; E, edge.
Figure 6
Figure 6
Fluorescence correlation spectroscopy (FCS) diffusivity analysis of RSV Gag–vRNA condensates at 1 M NaCl. (A,B) Violin plots containing Gag (A) and RNA (B) diffusion coefficient (μm2/s) values for Gag alone, Gag–gRNA Ψ DIS, and Gag–gRNA Ψ ΔDIS condensates as determined by FCS. Diffusivity was analyzed at three independent locations within condensates. Median, first, and third quartile values are displayed by dotted lines. Statistical significance was determined by Kruskal–Wallis test with Dunn’s post hoc test (A) (****, p ≤ 0.0001; *, p ≤ 0.05) or Mann–Whitney test (B) (n ≥ 41 for all datasets). (C) Representative images of Gag alone, Gag–gRNA Ψ DIS, and Gag–gRNA Ψ ΔDIS condensates analyzed by FCS. Scale bars = 1 μm. C, center; I, intermediate; E, edge.

Update of

Similar articles

References

    1. Maldonado R.J.K., Rice B., Chen E.C., Tuffy K.M., Chiari E.F., Fahrbach K.M., Hope T.J., Parent L.J. Visualizing Association of the Retroviral Gag Protein with Unspliced Viral RNA in the Nucleus. mBio. 2020;11:10–1128. doi: 10.1128/mBio.00524-20. - DOI - PMC - PubMed
    1. Tuffy K.M., Maldonado R.J.K., Chang J., Rosenfeld P., Cochrane A., Parent L.J. HIV-1 Gag Forms Ribonucleoprotein Complexes with Unspliced Viral RNA at Transcription Sites. Viruses. 2020;12:1281. doi: 10.3390/v12111281. - DOI - PMC - PubMed
    1. Kaddis Maldonado R.J., Parent L.J. Orchestrating the Selection and Packaging of Genomic RNA by Retroviruses: An Ensemble of Viral and Host Factors. Viruses. 2016;8:257. doi: 10.3390/v8090257. - DOI - PMC - PubMed
    1. Hanson H.M., Willkomm N.A., Yang H., Mansky L.M. Human Retrovirus Genomic RNA Packaging. Viruses. 2022;14:1094. doi: 10.3390/v14051094. - DOI - PMC - PubMed
    1. Banks J.D., Linial M.L. Secondary structure analysis of a minimal avian leukosis-sarcoma virus packaging signal. J. Virol. 2000;74:456–464. doi: 10.1128/JVI.74.1.456-464.2000. - DOI - PMC - PubMed

LinkOut - more resources