. 2025 Jun 13;26(12):5685.
doi: 10.3390/ijms26125685.

Bisphenol AF Induced Neurodevelopmental Toxicity of Human Neural Progenitor Cells via Nrf2/HO-1 Pathway

Affiliations

Bisphenol AF Induced Neurodevelopmental Toxicity of Human Neural Progenitor Cells via Nrf2/HO-1 Pathway

Huan Luo et al. Int J Mol Sci. .

Abstract

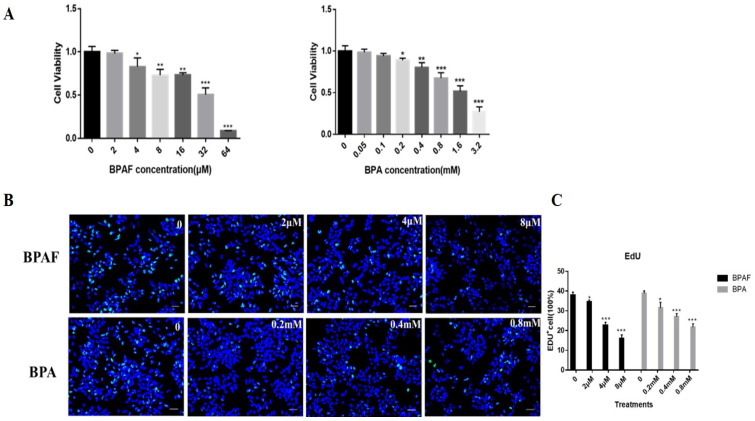
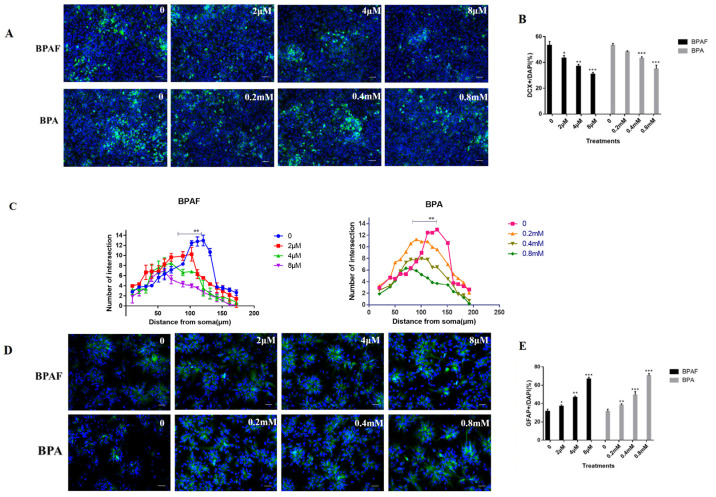
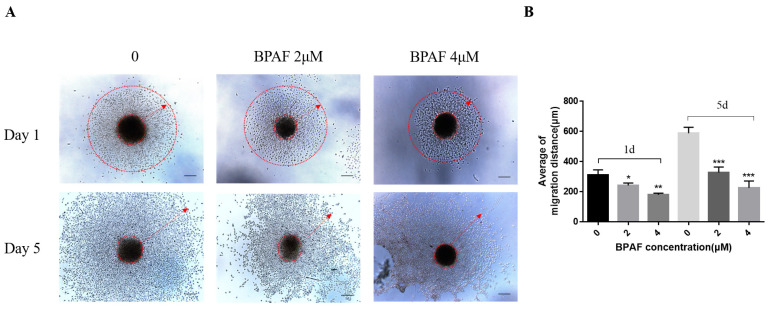
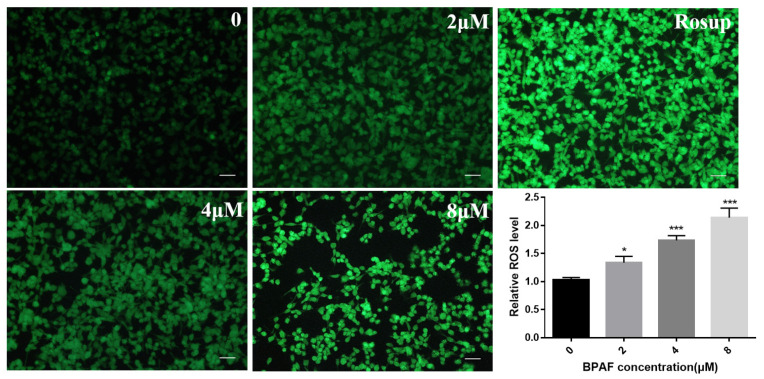
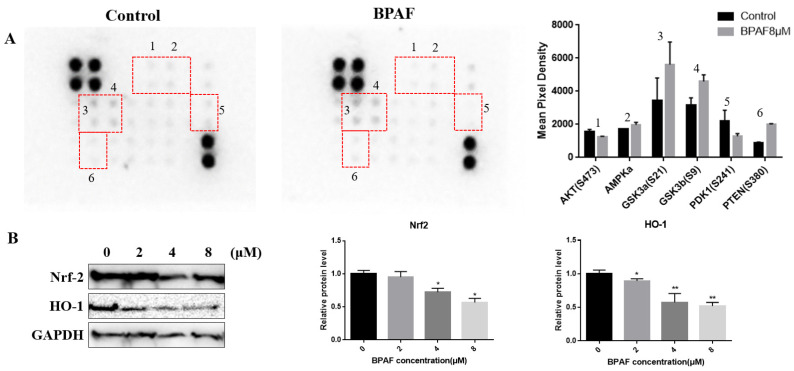
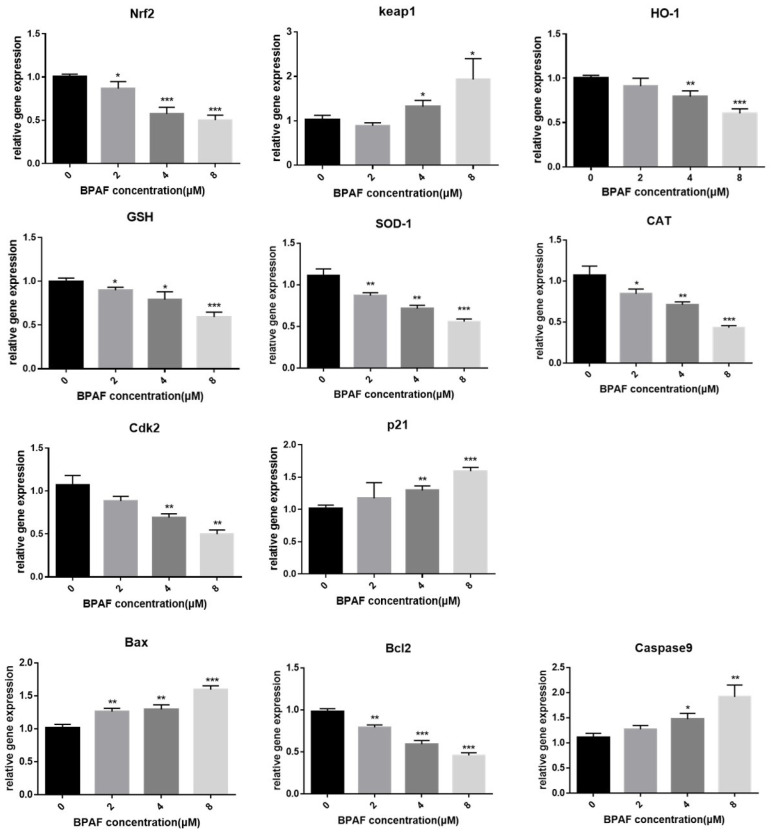
Bisphenol AF (BPAF) is widely utilized as an analog of bisphenol A (BPA) in the plastics industry. However, there is limited evidence on its neurodevelopmental toxicity. Existing studies suggest that BPAF has greater accumulation in vivo than other bisphenol analogs, and could pass through the placental barrier and the blood-brain barrier. In this study, we used the human neural progenitor cells line ReNcell CX, which was derived from 14-week human cortical brain tissue, as an in vitro model to investigate the neurodevelopmental toxicity effects of BPAF and BPA on ReNcell CX cells, and explored the possible mechanism by which BPAF induced neurodevelopmental toxicity on ReNcell CX cells. The results showed that BPAF reduced the proliferation of neural progenitor cells and changed the differentiation towards neurons after exposure for 24 h. Compared with BPA, ReNcell CX cells are more susceptible to BPAF exposure. In a 3D neurospheres model, BPAF affected the distance that neurons migrated outwards at the concentration of 2 μM. Furthermore, BPAF increased ROS levels in cells and reduced the expression of key proteins in the Nrf2/HO-1 pathway and its downstream molecules, such as SOD, GSH, and CAT. In conclusion, BPAF induces damage to critical nodes in neural progenitor cell development through the Nrf2/HO-1 pathway. Therefore, clarifying its neurodevelopmental toxicity and elaborating on the neurodevelopmental toxicity effects and mechanisms of bisphenol AF will help identify intervention targets for neurodevelopmental toxicity, and will have important public health significance for the safety assessment and risk prediction of bisphenol-related chemicals.

Keywords: BPAF; Nrf2/HO-1 pathway; ReNcell CX cells; neurodevelopmental toxicity.


Conflict of interest statement

The authors declare no conflicts of interest.

Figures

Figure 1
Figure 1
BPAF induced cytotoxicity and decreased the number of EdU+ (5-ethynyl-2′-deoxyuridine) cells. (A) The cytotoxicity was tested by CCK8 assay kit. (B) The cell proliferation was shown by the number of EdU+ cells (Green), and cell nuclei were stained with DAPI (Hoechst 33342, blue) (Scale bar, 100 μm). (C) Quantification results of Edu-positive cells were normalized as % control. The data presented here represent the mean ± SD of at least three separate experiments. * p < 0.05, ** p < 0.01, and *** p < 0.001 when compared to the corresponding control group.
Figure 2
Figure 2
BPAF reduced the number of neurons and injured synaptic growth. (A) Representative immunofluorescence images of ReNcell CX cells stained with the newborn neuronal marker doublecortin (DCX, Green), while the nuclear stain was DAPI (Hoechst 33342, blue) (Scale bar, 200 μm). (C) Sholl analysis of the number of intersections of radial distance from the cell body (N = 30 cells). (D) Representative immunofluorescence images of ReNcell CX cells stained with the astrocytes marker (GFAP), and the nuclei were counterstained by DAPI (blue) (Scale bar, 200 μm). (B,E) The percentage of immunofluorescence-positive cells. One-way ANOVA was applied to test the difference between two or more groups; two-way ANOVA and Bonferroni post-test were applied for the results with Sholl analysis. The data presented here represent the mean ± SD of at least three separate experiments. * p < 0.05, ** p < 0.01, and *** p < 0.001 when compared to the corresponding control group.
Figure 3
Figure 3
BPAF impaired the migration ability of ReNcell CX cells in the Neurosphere model. (A) The image of cells in the selected neurosphere which were spreading outwards, after BPAF treatment of 24 h (Scale bar, 100 μm; red arrow: the farthest distance at which cells migrated outward). (B) The migration average distance of cells at 1 and 5 days of differentiation were calculated by Image J software (ImageJ 1.53k). The data presented here represent the mean ± SD of at least three separate experiments. * p < 0.05, ** p < 0.01, and *** p < 0.001 when compared to the corresponding control group.
Figure 4
Figure 4
BPAF increased ROS levels in ReNcell CX cells. Immunofluorescence image of cellular ROS, ROS detected by DCFH-DA (Scale bar, 200 μm), and quantified DCF fluorescence (% of control) of ReNcell CX cells as shown by corresponding bar diagrams. The data presented here represent the mean ± SD of at least three separate experiments. * p < 0.05, and *** p < 0.001 when compared to the corresponding control group.
Figure 5
Figure 5
BPAF impacted neurodevelopment of ReNcell CX cells via the Nrf/HO-1 pathway. (A) The expression levels of AKT-related cytokines after BPAF exposure (1: AKT(S473); 2: AMPKa; 3: GSK3a(S21); 4: GSK3b(S9); 5:PDK1(S241); 6: PTEN(S380)). Total protein was collected after cells were treated with BPAF in amounts under 0, 2, 4 and 8 μM, respectively. The expression level of the detected plots collected by ImageJ (ImageJ 1.53k). (B) The protein expression levels of Nrf2 and HO-1 in ReNcell CX cells by Western blot. The relative quantification analysis of each protein. GAPDH was used to normalize the Western blots. The results are expressed as fold changes compared with the control. The data presented here represent the mean ± SD of at least three separate experiments. * p < 0.05, ** p < 0.01, when compared to the corresponding control group.
Figure 6
Figure 6
BPAF reduced the mRNA level of Nrf2/HO-1 pathway genes’ expression by qRT-PCR. The results are expressed as fold changes compared with the control. The data presented here represent the mean ± SD of at least three separate experiments. * p < 0.05, ** p < 0.01, *** p < 0.001 vs. the control group.

Similar articles

References

    1. Jin H., Zhu J., Chen Z., Yanjun H. Occurrence and Partitioning of Bisphenol Analogues in Adults’ Blood from China. Environ. Sci. Technol. 2018;52:812–820. doi: 10.1021/acs.est.7b03958. - DOI - PubMed
    1. Da C., Kurunthachalam K., Hongli T., Zhengui Z., Yong-Lai F., Yan W., Margaret W. Bisphenol Analogues Other Than BPA: Environmental Occurrence, Human Exposure, and Toxicity—A Review. Environ. Sci. Technol. 2016;50:5438–5453. doi: 10.1021/acs.est.5b05387. - DOI - PubMed
    1. Galts C.P.C., Bettio L.E.B., Jewett D.C., Yang C.C., Brocardo P.S., Rodrigues A.L.S., Thacker J.S., Gil-Mohapel J. Depression in neurodegenerative diseases: Common mechanisms and current treatment options. Neurosci. Biobehav. Rev. 2019;102:56–84. doi: 10.1016/j.neubiorev.2019.04.002. - DOI - PubMed
    1. Götz M., Huttner W.B. The cell biology of neurogenesis. Nat. Rev. Mol. Cell Biol. 2005;6:777–788. doi: 10.1038/nrm1739. - DOI - PubMed
    1. Faust T.E., Gunner G., Schafer D.P. Mechanisms governing activity-dependent synaptic pruning in the developing mammalian CNS. Nat. Rev. Neurosci. 2021;22:657–673. doi: 10.1038/s41583-021-00507-y. - DOI - PMC - PubMed

LinkOut - more resources