. 2025 Jun 13;26(12):5688.
doi: 10.3390/ijms26125688.

Evaluating the Antitumor Potential of Cannabichromene, Cannabigerol, and Related Compounds from Cannabis sativa and Piper nigrum Against Malignant Glioma: An In Silico to In Vitro Approach

Affiliations

Evaluating the Antitumor Potential of Cannabichromene, Cannabigerol, and Related Compounds from Cannabis sativa and Piper nigrum Against Malignant Glioma: An In Silico to In Vitro Approach

Andrés David Turizo Smith et al. Int J Mol Sci. .

Abstract

Malignant gliomas, including glioblastoma multiforme (GBM), are highly aggressive brain tumors with a poor prognosis and limited treatment options. This study investigates the antitumor potential of bioactive compounds derived from Cannabis sativa and Piper nigrum using molecular docking, cell viability assays, and transcriptomic and expression analyses from public databases in humans and cell lines. Cannabichromene (CBC), cannabigerol (CBG), cannabidiol (CBD), and Piper nigrum derivates exhibited strong binding affinities relative to glioblastoma-associated targets GPR55 and PINK1. In vitro analyses demonstrated their cytotoxic effects on glioblastoma cell lines (U87MG, T98G, and CCF-STTG1), as well as on neuroblastoma (SH-SY5Y) and oligodendroglial (MO3.13) cell lines, revealing interactions among these compounds. The differential expression of GPR55 and PINK1 in tumor versus normal tissues further supports their potential as biomarkers and therapeutic targets. These findings provide a basis for the development of novel therapies and suggest unexplored molecular pathways for the treatment of malignant glioma.

Keywords: CCF-STTG1; Cannabis sativa; GPR55; PINK1; Piper nigrum; T98G; U87MG; cannabichromene; cannabidiol; cannabidiolic acid (CBDA); cannabigerol; glioblastoma; piperine.


Conflict of interest statement

The authors declare no conflicts of interest.

Figures
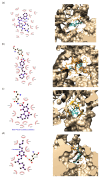
Figure 1
Figure 1
Binding Interactions of ligands with PINK1. (a) OSI, (b) P, (c) THC, (d) CBG, (e) CBDA, (f) CBC, (g) CBD, (h) BCP. These ligands engage critical residues involved in PINK1’s catalytic activity, suggesting potential for targeted therapies. OSI binds strongly via hydrophobic and electrostatic interactions with key residues like Ile162, Leu369, Met318, Asp366, and Lys164. P forms a hydrogen bond with Tyr321. THC binds through hydrogen bonds with Gln327 and hydrophobic interactions with Val170 and Asp366. CBG and CBDA interact with Glu371, Trp379, and Val184.
Figure 1
Figure 1
Binding Interactions of ligands with PINK1. (a) OSI, (b) P, (c) THC, (d) CBG, (e) CBDA, (f) CBC, (g) CBD, (h) BCP. These ligands engage critical residues involved in PINK1’s catalytic activity, suggesting potential for targeted therapies. OSI binds strongly via hydrophobic and electrostatic interactions with key residues like Ile162, Leu369, Met318, Asp366, and Lys164. P forms a hydrogen bond with Tyr321. THC binds through hydrogen bonds with Gln327 and hydrophobic interactions with Val170 and Asp366. CBG and CBDA interact with Glu371, Trp379, and Val184.
Figure 2
Figure 2
Binding interactions of ligands with GPR55. (a) CBC, (b) OSI, (c) P, (d) CBG, (e) CBDA, (f) THC, (g) CBD, (h) BCP. Hydrophobic interactions are observed with residues such as Phe102, Phe159, and Leu148 for ligands like CBC, CBG, CBD, THC, OSI, P, and BCP. Hydrogen bonds are formed between specific residues and ligands like CBC, OSI, THC, and CBDA. Ligands such as P, CBG, CBD, and BCP primarily interact through hydrophobic contacts.
Figure 2
Figure 2
Binding interactions of ligands with GPR55. (a) CBC, (b) OSI, (c) P, (d) CBG, (e) CBDA, (f) THC, (g) CBD, (h) BCP. Hydrophobic interactions are observed with residues such as Phe102, Phe159, and Leu148 for ligands like CBC, CBG, CBD, THC, OSI, P, and BCP. Hydrogen bonds are formed between specific residues and ligands like CBC, OSI, THC, and CBDA. Ligands such as P, CBG, CBD, and BCP primarily interact through hydrophobic contacts.
Figure 3
Figure 3
Boiled egg diagram for all compounds analyzed. 1. CBC. 2. CBG. 3. CBD. 4. CBDA. 5. Piperine. 6. BCP. 7. THC. 8. OSI. 9. TMZ. 10. CisPt. BBB: Blood–brain barrier. HIA: Human intestinal absorption. PgP: P-glycoprotein.
Figure 4
Figure 4
Immunohistochemical analysis of PINK1 and GPR55 expression in glioblastoma patient samples.
Figure 5
Figure 5
MTT viability assays of CCF-STTG1, 24 h. The asterisks in the figure represent the following levels of statistical significance: p < 0.05 (*), p < 0.01 (**), p < 0.001 (***), p < 0.0001 (****).
Figure 6
Figure 6
MTT viability assays of CBG and CBD with CisPt in CCF-STTG1. The asterisks in the figure represent the following levels of statistical significance: p < 0.05 (*), p < 0.01 (**), p < 0.0001 (****).
Figure 7
Figure 7
Viability assays and morphological changes in the CCF-SSTG1 cell line treated with selected compounds. (a) MTT viability assays of CBD, CBG, PiperOH, and P in CCF-STTG1. (b) Morphological changes in the CCF-SSTG1 cell line treated with CBD, CBG, and CBG + POH, observed under an optical microscope at 10× magnification with a scale of 150 µm. 1. CBD 25 ng/μL; 2. CBD and POH 25 ng/μL each; 3. CBG 25 ng/μL; 4. CBG + POH 25 ng/μL each; 5. control. Note: 2500 ng/100 μL = 25 ng/μL. The asterisks in the figure represent the following levels of statistical significance: p < 0.01 (**), p < 0.001 (***), p < 0.0001 (****).
Figure 7
Figure 7
Viability assays and morphological changes in the CCF-SSTG1 cell line treated with selected compounds. (a) MTT viability assays of CBD, CBG, PiperOH, and P in CCF-STTG1. (b) Morphological changes in the CCF-SSTG1 cell line treated with CBD, CBG, and CBG + POH, observed under an optical microscope at 10× magnification with a scale of 150 µm. 1. CBD 25 ng/μL; 2. CBD and POH 25 ng/μL each; 3. CBG 25 ng/μL; 4. CBG + POH 25 ng/μL each; 5. control. Note: 2500 ng/100 μL = 25 ng/μL. The asterisks in the figure represent the following levels of statistical significance: p < 0.01 (**), p < 0.001 (***), p < 0.0001 (****).
Figure 8
Figure 8
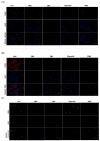
Assessment of mitochondrial membrane potential in astrocytoma cells U87 mg, T98G, and CCFSTTG1. (AC) Cells were treated with control (Ctrl), CBG, CBC (4 ng/µL), PiperOH (12.5 ng/µL), and TMZ (50 ng/µL) for 24 h and analyzed via confocal microscopy (magnification × 20 scale bar 150 µm) using TMRE dye, with nuclear staining using DAPI.
Figure 9
Figure 9
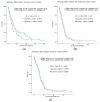
Kaplan–Meier estimator survival analysis of the glioblastoma subtype correlated with PINK1 expression: (a) proneural, (b) mesenchymal, and (c) classical. The blue line indicates low PINK1 expression, and the lilac line indicates high PINK1 expression. Statistical significance is indicated by * for the log-rank test p-value and + for the Wilcoxon test p-value. A p-value < 0.05 is considered statistically significant for both tests. The log-rank test assesses overall survival differences between groups, while the Wilcoxon test emphasizes early survival differences.
Figure 10
Figure 10
PINK1 as a prognostic marker in other types of cancer. Kaplan–Meier plots illustrate the survival outcomes for various cancers where high PINK1 expression levels show a statistically significant correlation (p < 0.001) with patient survival. The prognosis—whether favorable or unfavorable—is noted in brackets alongside each plot. Survival analysis: Kaplan–Meier plots summarize results from analysis of correlations between mRNA expression levels and patient survival. Patients were divided, based on expression levels, into one of the two following groups: “low” (under cut-off) or “high” (over cut-off). The x-axis shows the time for survival (years), and the y-axis shows the probability of survival, where 1.0 corresponds to 100 percent. The blue line indicates low PINK1 expression, and the lilac line indicates high PINK1 expression.
Figure 11
Figure 11
Boxplot comparing the expression levels of PINK1 between tumor (T) and normal (N) tissues across different cancer types. Red indicates tumor samples, and gray represents normal tissue. Significant differences in expression are marked with an asterisk (*). Cancer types include glioblastoma multiforme (GBM), low-grade glioma (LGG), kidney renal papillary cell carcinoma (KIRP), kidney renal clear cell carcinoma (KIRC), lung squamous cell carcinoma (LUSC), and pancreatic adenocarcinoma (PAAD). Expression− log2(TPM + 1).
Figure 12
Figure 12
Specimens of Cannabis sativa (a) and Piper nigrum (b).

Similar articles

References

    1. Hoggarth A.R., Muthukumar S., Thomas S.M., Crowley J., Kiser J., Witcher M.R. Clinical Theranostics in Recurrent Gliomas: A Review. Cancers. 2024;16:1715. doi: 10.3390/cancers16091715. - DOI - PMC - PubMed
    1. Rahman M.A., Ali M.M. Recent Treatment Strategies and Molecular Pathways in Resistance Mechanisms of Antiangiogenic Therapies in Glioblastoma. Cancers. 2024;16:2975. doi: 10.3390/cancers16172975. - DOI - PMC - PubMed
    1. Kurdi M., Alkhotani A., Alsinani T., Alkhayyat S., Katib Y., Jastaniah Z., Sabbagh A.J., Butt N.S., Toonsi F.A., Alharbi M., et al. Effects of Radiotherapy Alone Versus Concomitant Radiotherapy with Temozolomide Chemotherapy on the Outcome of IDH-Wildtype Glioblastoma Patients. Clin. Oncol. 2025;38:103741. doi: 10.1016/j.clon.2024.103741. - DOI - PubMed
    1. Adhikaree J., Moreno-Vicente J., Kaur A.P., Jackson A.M., Patel P.M. Resistance Mechanisms and Barriers to Successful Immunotherapy for Treating Glioblastoma. Cells. 2020;9:263. doi: 10.3390/cells9020263. - DOI - PMC - PubMed
    1. Zha S., Liu H., Li H., Li H., Wong K.-L., All A.H. Functionalized Nanomaterials Capable of Crossing the Blood–Brain Barrier. ACS Nano. 2024;18:1820–1845. doi: 10.1021/acsnano.3c10674. - DOI - PMC - PubMed

MeSH terms