. 2025 Jun 15;26(12):5743.
doi: 10.3390/ijms26125743.

Quercetin as a Therapeutic Option in a Rat Model of Aluminum Chloride- and D-Galactose-Induced Neurodegeneration

Affiliations

Quercetin as a Therapeutic Option in a Rat Model of Aluminum Chloride- and D-Galactose-Induced Neurodegeneration

Marina Kukolj et al. Int J Mol Sci. .

Abstract

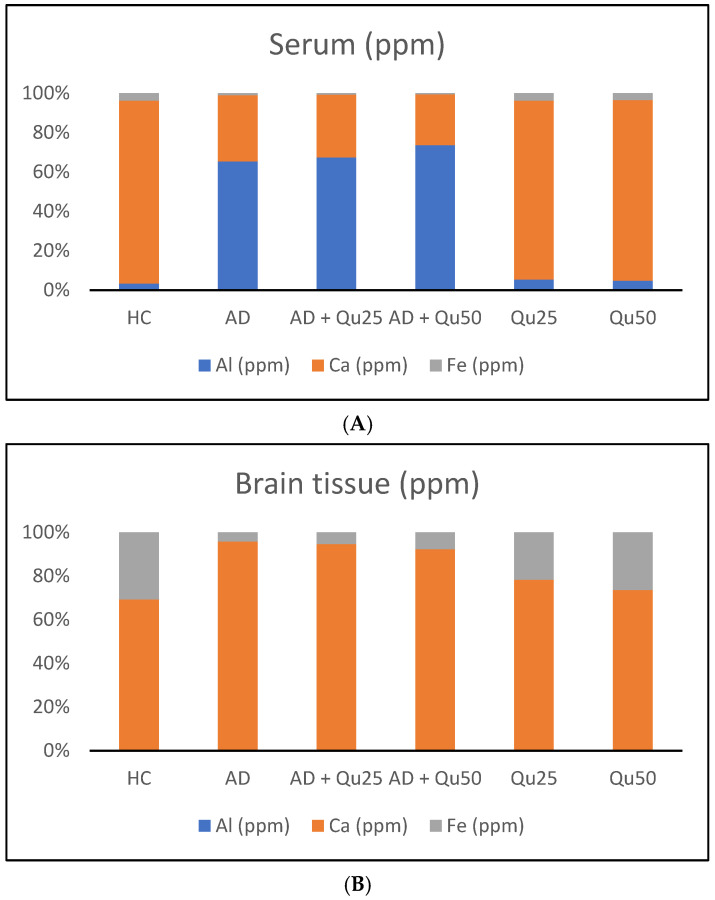
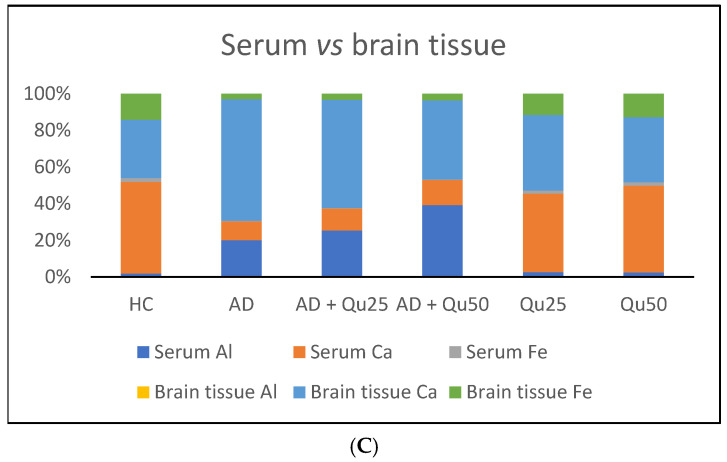
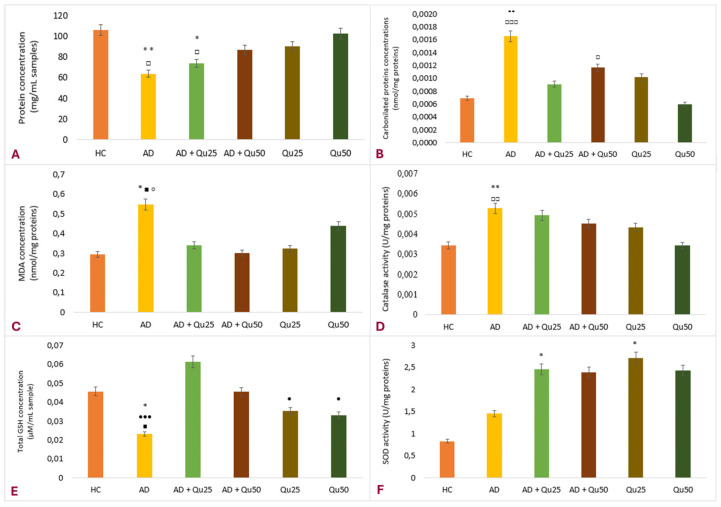
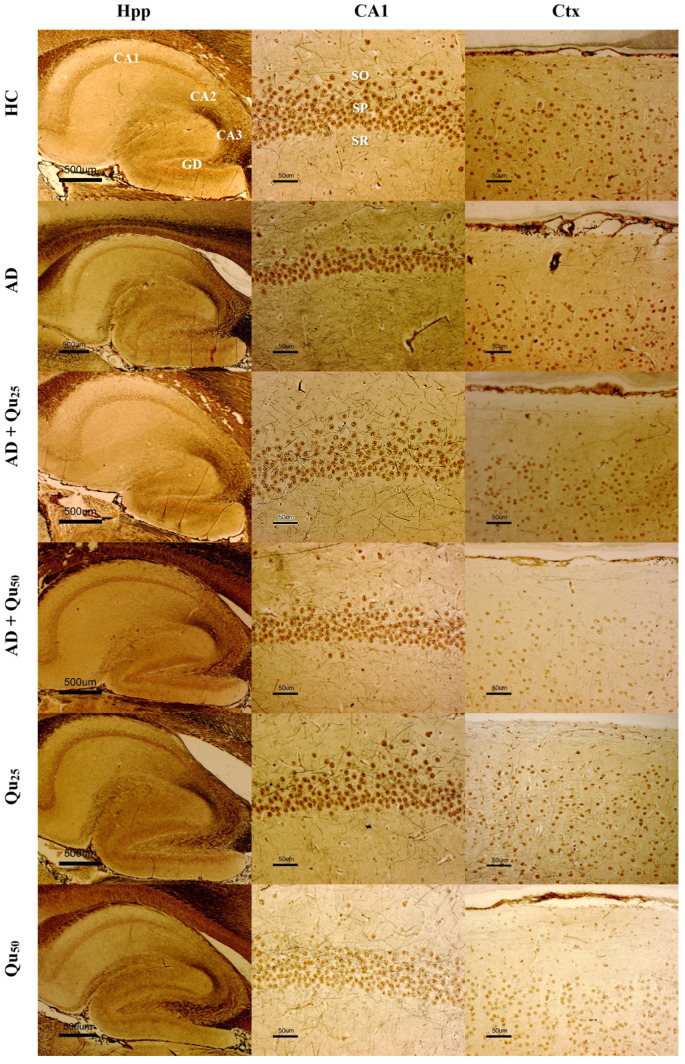
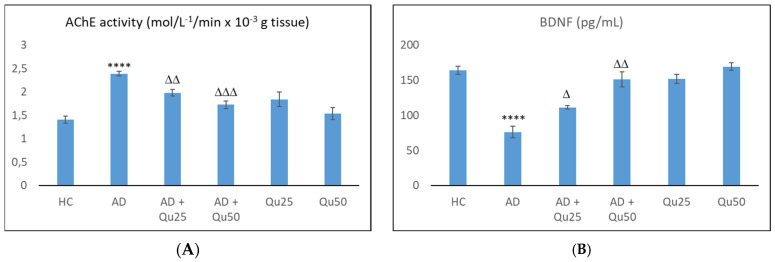
Aluminum (Al) is one of the most abundant metals on Earth and is well known as an environmental neurotoxic agent in the pathogenesis of Alzheimer's disease. Aluminum toxicity is associated with oxidative stress, reduction of antioxidant enzymes, and disruption of the balance of cellular metals, such as iron (Fe), calcium (Ca), and copper (Cu), which causes structural and functional changes in the nervous tissue of the brain or peripheral nervous system. The intake of functional foods, rich in antioxidants, such as quercetin, may be beneficial in combating oxidative stress and neurodegenerative changes in the brain. The aim of this study was to provide deeper insight into the cellular and molecular neuroprotective effects of quercetin in regulating amyloid-beta (Aβ) accumulation, tau pathology, and neuroinflammation in the Al/D-galactose-induced rat model (Al/D-gal) of AD. The results showed that quercetin successfully modulated the impaired homeostatic and neuropathological consequences of aluminum chloride and D-galactose administration over 28 days: it directly protected neurons by regulating the level of oxidative stress and antioxidants, reduced Aβ aggregation by inhibiting the activity of acetylcholinesterase (AChE), increased the survival, growth, and differentiation of nerve cells by maintaining the level of brain-derived neurotrophic factor (BDNF), and regulated microglial immunoreactivity and neuroinflammation by reducing the level of proinflammatory cytokines. The multiple effects confirm that quercetin can be applied as an alternative non-pharmaceutical approach in reducing Al-induced neurotoxicity and maintaining adaptive homeostasis, which consequently affects the functioning of the central nervous system and the whole organism.

Keywords: aluminum/D-galactose-induced Alzheimer’s disease; cellular and molecular neuroprotective effects of quercetin; metal disbalance; molecular insight; neurodegeneration; oxidative-inflammatory markers; quercetin.


Conflict of interest statement

The authors declare no conflicts of interest.

Figures

Figure 1
Figure 1
Body weight changes in rats following chronic administration of aluminum chloride + D-galactose and quercetin. Rats (n = 10 per group) were injected with aluminum chloride + D-galactose (10 mg/kg + 60 mg/kg) and quercetin at doses of 25 or 50 mg/kg through the intraperitoneal route (i.p.) for 28 days. Control rats received intraperitoneal saline solution. Data are presented as the mean ± SEM and were analyzed using the Kruskal–Wallis nonparametric test. * Significantly different compared to the healthy control (HC) group (* p ≤ 0.05; ** p ≤ 0.01). Significantly different compared to the Qu50 group ( p ≤ 0.05; □□ p ≤ 0.01). Abbreviations: HC—Healthy control group; AD—Alzheimer’s disease rat model; AD + Qu25—AD model injected with quercetin i.p. at a dose of 25 mg/kg; AD + Qu50—AD model injected with quercetin i.p. at a dose of 50 mg/kg; SEM—standard error of the mean.
Figure 2
Figure 2
Percentage of aluminum (Al), calcium (Ca), and iron (Fe) in rat serum (A), brain tissue (B), and serum vs. brain (C) after chronic administration of aluminum chloride + D-galactose and quercetin. The rats (n = 3 per group) were injected with aluminum chloride + D-galactose (10 mg/kg + 60 mg/kg) and quercetin at doses of 25 or 50 mg/kg through the intraperitoneal route (i.p.) for 28 days. Control rats were injected i.p. with saline solution. Data are expressed as a %. Abbreviations: HC—Healthy control group; AD—Alzheimer’s disease rat model; AD + Qu25—AD model injected with quercetin i.p. at a dose of 25 mg/kg; AD + Qu50—AD model injected with quercetin i.p. at a dose of 50 mg/kg.
Figure 2
Figure 2
Percentage of aluminum (Al), calcium (Ca), and iron (Fe) in rat serum (A), brain tissue (B), and serum vs. brain (C) after chronic administration of aluminum chloride + D-galactose and quercetin. The rats (n = 3 per group) were injected with aluminum chloride + D-galactose (10 mg/kg + 60 mg/kg) and quercetin at doses of 25 or 50 mg/kg through the intraperitoneal route (i.p.) for 28 days. Control rats were injected i.p. with saline solution. Data are expressed as a %. Abbreviations: HC—Healthy control group; AD—Alzheimer’s disease rat model; AD + Qu25—AD model injected with quercetin i.p. at a dose of 25 mg/kg; AD + Qu50—AD model injected with quercetin i.p. at a dose of 50 mg/kg.
Figure 3
Figure 3
Parameters of oxidative stress and antioxidant protection in rat brain tissue homogenates after chronic administration of aluminum chloride + D-galactose and quercetin. (A) Protein concentration; (B) Carbonilated proteins concentration; (C) MDA concentration; (D) catalase activity; (E) Total GSH concentration; (F) SOD activity. The rats (n = 6 per group) were injected with aluminum chloride + D-galactose (10 mg/kg + 60 mg/kg) and quercetin at doses of 25 or 50 mg/kg through the intraperitoneal route (i.p.) for 28 days. Control rats were injected i.p. with saline solution. Data are expressed as the mean ± SEM and analyzed using the Kruskal–Wallis nonparametric test. * Significantly different compared to HC (* p ≤ 0.05, ** p ≤ 0.01). Significantly different compared to Qu50 ( p ≤ 0.05; □□ p ≤ 0.01, □□□ p ≤ 0.001). Statistically different compared to AD + Qu50 ( p ≤ 0.05). Statistically different compared to Qu25 ( p ≤ 0.05). Statistically different compared to AD + Qu25 ( p ≤ 0.05, ●●● p ≤ 0.001). Abbreviations: HC—Healthy control group; AD—Alzheimer’s disease rat model; AD + Qu25—AD model injected with quercetin i.p. at a dose of 25 mg/kg; AD + Qu50—AD model injected with quercetin i.p. at a dose of 50 mg/kg; SEM—standard error of the mean.
Figure 4
Figure 4
Silver staining of the cortex (Ctx), hippocampus (Hpp), and CA1 area of hippocampal formation in representative cross-sections of rat brains after chronic administration of aluminum chloride + D-galactose and quercetin. The rats (n = 6 per group) were injected with aluminum chloride + D-galactose (10 mg/kg + 60 mg/kg) and quercetin at doses of 25 or 50 mg/kg through the intraperitoneal route (i.p.) for 28 days. Control rats were injected i.p. with saline solution. The actual magnification is 20× for Ctx and CA1 area (scale bar = 50 µm) and 2× for Hpp (scale bar = 500 µm). Abbreviations: HC—Healthy control group; AD—Alzheimer’s disease rat model; AD + Qu25—AD model injected with quercetin i.p. at a dose of 25 mg/kg; AD + Qu50—AD model injected with quercetin i.p. at a dose of 50 mg/kg; Hippocampal formation: GD—gyrus dentatus and Ammon’s horn (CA1-CA3, cornu ammonis). Layers of the CA1 region: SO—stratum oriens, SP—stratum pyramidale and SR—stratum radiatum.
Figure 5
Figure 5
The number of cells in the molecular layer of the cerebral cortex (A) and CA1 area of hippocampal formation (B) in rat brains after chronic administration of aluminum chloride + D-galactose and quercetin. The rats (n = 6 per group) were injected with aluminum chloride + D-galactose (10 mg/kg + 60 mg/kg) and quercetin at doses of 25 or 50 mg/kg through the intraperitoneal route (i.p.) for 28 days. Control rats were injected i.p. with saline solution. Data are expressed as the mean ± SEM and analyzed using the Kruskal–Wallis nonparametric test. * Statistical significance compared to HC (* p ≤ 0.05, ** p ≤ 0.01, *** p ≤ 0.001). Significantly different compared to AD + Qu25 (●● p ≤ 0.01). Significantly different compared to AD + Qu50 (■■ p ≤ 0.01). Significantly different compared to Qu25 ( p ≤ 0.05). Significantly different compared to Qu50 ( p ≤ 0.05, □□□ p ≤ 0.001) Abbreviations: HC—Healthy control group; AD—Alzheimer’s disease rat model; AD + Qu25—AD model injected with quercetin i.p. at a dose of 25 mg/kg; AD + Qu50—AD model injected with quercetin i.p. at a dose of 50 mg/kg; SEM—standard error of the mean.
Figure 6
Figure 6
Expression of the 4G8 marker in representative cross-sections of the rat brain cortex and hippocampus, visualized by immunohistochemical staining after chronic administration of aluminum chloride + D-galactose and quercetin. The rats (n = 6 per group) were injected with aluminum chloride + D-galactose (10 mg/kg + 60 mg/kg) and quercetin at doses of 25 or 50 mg/kg through the intraperitoneal route (i.p.) for 28 days. Control rats were injected i.p. with saline solution. The scale bar for the actual magnification at 40× is 50 µm, with a positive signal indicated by a white arrow. An artifact created during the production of the histological specimen is highlighted by a red rectangle. Abbreviations: HC—Healthy control group; AD—Alzheimer’s disease rat model; AD + Qu25—AD model injected with quercetin i.p. at a dose of 25 mg/kg; AD + Qu50—AD model injected with quercetin i.p. at a dose of 50 mg/kg.
Figure 7
Figure 7
Quantitative analysis of 4G8 marker expression in the brain hippocampal formation, cerebral cortex, and cerebellum of rat brains after chronic administration of aluminum chloride + D-galactose and quercetin. (A) Number of plaques; (B) Plaque surface. The rats (n = 6 per group) were injected with aluminum chloride + D-galactose (10 mg/kg + 60 mg/kg) and quercetin at doses of 25 or 50 mg/kg through the intraperitoneal route (i.p.) for 28 days. Control rats were injected i.p. with saline solution. Data are expressed as the mean ± SEM and analyzed using the Kruskal–Wallis nonparametric test. Significantly different compared to AD + Qu25 (●● p ≤ 0.01, ●●● p ≤ 0.001). Statistically different compared to AD + Qu50 ( p ≤ 0.05, ■■ p ≤ 0.01). Abbreviations: HC—Healthy control group; AD—Alzheimer’s disease rat model; AD + Qu25—AD model injected with quercetin i.p. at a dose of 25 mg/kg; AD + Qu50—AD model injected with quercetin i.p. at a dose of 50 mg/kg; SEM—standard error of the mean.
Figure 8
Figure 8
Expression of the Iba1 marker in representative cross-sections of the outer area of the cerebral cortex (Ctx) of the rat brain after chronic administration of aluminum chloride + D-galactose and quercetin. The rats (n = 6 per group) were injected with aluminum chloride + D-galactose (10 mg/kg + 60 mg/kg) and quercetin at a dose of 25 or 50 mg/kg through the intraperitoneal (i.p.) route for 28 days. Control rats were injected i.p. with saline solution. Actual magnification at 20× (scale bar = 50 µm) and 40× (scale bar = 20 µm). Abbreviations: HC—Healthy control group; AD—Alzheimer’s disease rat model; AD + Qu25—AD model injected with quercetin i.p. at a dose of 25 mg/kg; AD + Qu50—AD model injected with quercetin i.p. at a dose of 50 mg/kg.
Figure 9
Figure 9
Expression of the Iba1 marker in representative cross-sections of the selected areas of hippocampal formation (GD—gyrus dentatus, CA1—cornu ammonis, SUB—subiculum) of the rat brain after chronic administration of aluminum chloride + D-galactose and quercetin. The rats (n = 6 per group) were injected with aluminum chloride + D-galactose (10 mg/kg + 60 mg/kg) and quercetin at a dose of 25 or 50 mg/kg through the intraperitoneal (i.p.) route for 28 days. Control rats were injected i.p. with saline solution. Scale bar = 20 µm (40×). Abbreviations: HC—Healthy control group; AD—Alzheimer’s disease rat model; AD + Qu25—AD model injected with quercetin i.p. at a dose of 25 mg/kg; AD + Qu50—AD model injected with quercetin i.p. at a dose of 50 mg/kg.
Figure 10
Figure 10
AChE activity (A) and BDNF concentration (B) in rat brain tissue homogenates after chronic administration of aluminum chloride + D-galactose and quercetin. The rats (n = 3 per group) were injected with aluminum chloride + D-galactose (10 mg/kg + 60 mg/kg) and quercetin at doses of 25 or 50 mg/kg through the intraperitoneal route (i.p.) for 28 days. Control rats were injected i.p. with saline solution. Data are expressed as the mean ± SEM and analyzed using the Student t-test. **** Significantly different compared to the HC group (**** p ≤ 0.0001). Δ Significantly different compared to the AD model (Δ p ≤ 0.05; ΔΔ p ≤ 0.01; ΔΔΔ p ≤ 0.01). Abbreviations: HC—Healthy control group; AD—Alzheimer’s disease rat model; AD + Qu25—AD model injected with quercetin i.p. at a dose of 25 mg/kg; AD + Qu50—AD model injected with quercetin i.p. at a dose of 50 mg/kg; SEM—standard error of the mean.

Similar articles

Cited by

References

    1. Zvěřová M. Clinical aspects of Alzheimer’s disease. Clin. Biochem. 2019;72:3–6. doi: 10.1016/j.clinbiochem.2019.04.015. - DOI - PubMed
    1. Moya-Alvarado G., Gershoni-Emek N., Perlson E., Bronfman F.C. Neurodegeneration and Alzheimer’s disease (AD). What Can Proteomics Tell Us About the Alzheimer’s Brain? Mol. Cell. Proteom. 2016;15:409–425. doi: 10.1074/mcp.R115.053330. - DOI - PMC - PubMed
    1. Hardy J., Orr H. The genetics of neurodegenerative diseases. J. Neurochem. 2006;97:1690–1699. doi: 10.1111/j.1471-4159.2006.03979.x. - DOI - PubMed
    1. Mahdi O., Baharuldin M.T.H., Mohd Nor N.H., Chiroma S.M., Jagadeesan S., Moklas M.A.M. Chemicals used for the induction of Alzheimer’s disease-like cognitive dysfunctions in rodents. Biomed. Res. Ther. 2019;6:3460–3484. doi: 10.15419/bmrat.v6i11.575. - DOI
    1. Kaur R., Sood A., Lang D.K., Bhatia S., Al-Harrasi A., Aleya L., Behl T. Potential of flavonoids as anti-Alzheimer’s agents: Bench to bedside. Environ. Sci. Pollut. Res. Int. 2022;29:26063–26077. doi: 10.1007/s11356-021-18165-z. - DOI - PubMed

MeSH terms

LinkOut - more resources